June 2, 2026
Precious metals markets operate on mechanical principles that transcend daily news cycles. While both gold and silver respond to similar macroeconomic forces, their price behaviour reveals fundamentally different structural characteristics. Silver consistently demonstrates volatility patterns that amplify beyond gold's movements, creating price swings that can exceed gold's by factors of two to four during periods of market stress or euphoria.
Understanding why silver is more volatile than gold requires examining the operational mechanics behind these markets rather than focusing solely on directional price movements. The volatility differential stems from measurable structural constraints, market size disparities, and supply chain rigidities that create predictable amplification effects when capital flows shift. Furthermore, central bank influences on precious metals markets often impact silver differently than gold due to institutional holding patterns.
Market Structure Fundamentals: Why Silver Reacts More Dramatically to Capital Flows
The mathematical relationship between market capitalisation and price volatility creates the foundation for silver's amplified price movements. While silver exists in greater physical quantities than gold by tonnage, the dollar-denominated value of investable silver markets represents only a fraction of gold's total market capitalisation.
The Dollar-Value Disparity Creates Asymmetric Price Impact
Global gold reserves total approximately 54,000 metric tons according to the U.S. Geological Survey's 2024 Mineral Commodity Summaries, while silver reserves reach 570,000 metric tons by volume. However, this tonnage comparison obscures the critical market dynamic: total above-ground gold value approaches $12-13 trillion, while silver's complete above-ground stock reaches only $500-600 billion—representing merely 4-5% of gold's market value despite being ten times more abundant by weight.
This market size differential creates a mathematical amplification effect where identical capital flows produce disproportionate price movements. When $1 billion enters precious metals markets, it represents a materially smaller percentage of gold's total investable market compared to silver's smaller denominator, generating larger percentage price changes in silver.
| Market Comparison | Gold | Silver |
|---|---|---|
| Above-ground stock value | $12-13 trillion | $500-600 billion |
| Daily COMEX volume | 200,000+ contracts | 100,000-150,000 contracts |
| Market cap ratio | 20-26x larger | Base reference |
| Price impact per $1B inflow | 0.008-0.010% | 0.15-0.20% |
Liquidity Constraints in Physical and Paper Markets
Trading volume analysis reveals deeper liquidity constraints that amplify silver's volatility. The COMEX handles substantially larger gold futures volumes, with daily trading averaging over 200,000 contracts, while silver typically ranges between 100,000-150,000 contracts. More critically, the bid-ask spreads during market stress demonstrate silver's reduced liquidity depth.
During normal conditions, gold bid-ask spreads on COMEX range from 0.01-0.05 cents per troy ounce, while silver spreads typically span 0.05-0.15 cents per ounce—proportionally wider than gold's spreads. During the March 2020 market disruption, silver spreads expanded to 0.50+ cents per ounce while gold spreads reached approximately 0.10-0.20 cents, demonstrating why silver has been so volatile during stress periods.
The $1 Billion Test: When $1 billion flows into gold markets, it represents approximately 0.008% of the total investable gold market. The same capital flow into silver markets represents approximately 0.17% of the investable silver market—over 20 times the proportional impact.
When big ASX news breaks, our subscribers know first
Supply Chain Rigidity: How Production Constraints Amplify Volatility
Silver's supply structure creates fundamental inelasticity that amplifies price movements when demand shifts occur. Unlike gold mining, where dedicated operations can respond to price signals through production adjustments, silver faces structural constraints that prevent supply from equilibrating with demand changes.
The Byproduct Mining Dilemma
Approximately 65-70% of global silver production derives as a byproduct of copper, zinc, lead, and gold mining operations. This creates a principal-agent problem where silver supply decisions are determined by the economics of host metals rather than silver price signals.
| Silver Production Source | Percentage | Annual Output (Million Oz) |
|---|---|---|
| Copper mining byproduct | 45-50% | 350-390 |
| Zinc mining byproduct | 20-25% | 156-195 |
| Lead/Gold byproduct | 15-20% | 117-156 |
| Primary silver mines | 30-35% | 234-273 |
| Total annual production | 100% | ~780 |
When silver prices spike, copper mine operators cannot simply increase throughput to capture silver's higher value. Production decisions remain anchored to copper economics, creating supply inelasticity. Consequently, a copper mine producing 100,000 tons of ore annually generates a fixed coefficient of silver output regardless of silver price movements.
Industrial Consumption vs. Recoverable Supply
Industrial silver consumption patterns create permanent demand that cannot be reversed through recycling, unlike gold's high recovery rates. Key industrial applications where silver experiences permanent consumption include:
• Electronics manufacturing: Circuit boards and semiconductors where silver traces are not economically recoverable
• Photovoltaic cells: Silver layers measuring micrometers thick cannot be reclaimed with current technology
• Medical applications: Surgical instruments and antimicrobial treatments where recovery costs exceed silver value
• Chemical catalysts: Silver consumed in chemical processes is permanently lost to the system
• Automotive electronics: Electric vehicle components where silver remains embedded in complex assemblies
Silver recycling rates globally reach only 30-40% for above-ground stocks, compared to gold's 80-90% recovery rates. This permanent industrial consumption creates a structural supply reduction that amplifies future volatility when investment demand increases. For instance, the silver market squeeze of recent years has highlighted these supply constraints.
How Does Industrial Demand Create Price Volatility Patterns?
Industrial silver consumption represents approximately 48.1% of total global demand according to the Silver Institute's 2023 World Silver Survey, creating unique volatility patterns distinct from gold's primarily monetary and jewellery demand profile.
Manufacturing Sector Sensitivity Analysis
Industrial buyers demonstrate highly inelastic demand behaviour, purchasing silver based on production requirements rather than price optimisation. Manufacturing sectors exhibit the following demand characteristics:
| Industrial Sector | Annual Consumption (Million Oz) | Price Elasticity | Demand Driver |
|---|---|---|---|
| Electronics | 212 | -0.2 to -0.3 | Production quotas |
| Solar panels | 104 | -0.1 to -0.2 | Installation capacity |
| Chemical/Medical | 52 | -0.3 to -0.4 | Regulatory requirements |
| Automotive | 45 | -0.2 to -0.3 | Vehicle production |
Solar panel manufacturers require precisely determined silver quantities per watt of capacity. Silver input costs represent approximately 2-3% of total photovoltaic module costs, making price sensitivity minimal. When silver prices double, manufacturers typically absorb the cost increase rather than reduce purchases, creating demand inelasticity that amplifies upside volatility.
Inventory Management in Industrial Supply Chains
Just-in-time manufacturing creates demand lumping patterns that amplify silver volatility through inventory cycle effects:
- Rising price expectations trigger front-loading of purchases, creating demand spikes
- Falling price expectations encourage inventory drawdowns, creating demand collapses
- Supply chain disruptions force emergency purchasing at elevated prices
- Economic cycle transitions create simultaneous demand shifts across industries
Solar Industry Growth Impact: Global photovoltaic installations grew from 220 GW (2020) to 405 GW (2023), increasing silver demand by approximately 15 million ounces annually. Despite this industrial demand growth, silver prices declined from $26/oz to $19/oz during 2022-2023, demonstrating how financial sector selling pressure can override industrial demand fundamentals.
Futures Market Mechanics: Leverage and Volatility Amplification
COMEX futures markets create leverage-driven volatility amplification through margin requirements and position concentration effects that disproportionately impact silver compared to gold.
COMEX Position Dynamics and Margin Requirements
Current COMEX margin structures reveal the leverage differential between gold and silver markets:
| Futures Contract | Contract Size | Margin Requirement | Leverage Ratio | Margin per Ounce |
|---|---|---|---|---|
| Gold | 100 oz | $10,000-12,000 | 8:1 to 10:1 | $100-120 |
| Silver | 5,000 oz | $4,500-5,500 | 15:1 to 20:1 | $0.90-1.10 |
Silver futures provide substantially higher leverage ratios, creating amplified gains and losses per price movement. A 5% price move in silver generates 75-100% portfolio swings for leveraged traders, compared to 40-50% swings in gold futures.
Speculative Position Concentration
Open interest analysis reveals structural vulnerabilities in silver markets. Typical COMEX silver open interest ranges from 150,000-200,000 contracts, representing 750-1,000 million ounces of notional exposure against only 50-70 million ounces of registered deliverable inventory.
This creates ratios of 10:1 to 20:1 between paper exposure and physical delivery capability, compared to gold's 4:1 to 8:1 ratios. When speculative position liquidations occur, silver's smaller physical foundation cannot absorb the selling pressure as effectively as gold's deeper markets.
March 2020 Case Study: During the COVID-19 market disruption, silver experienced a 33% decline (from $18/oz to $12/oz) while gold declined only 10% (from $1,700/oz to $1,530/oz). The differential reflected forced liquidations in silver's more leveraged futures markets overwhelming physical demand.
What Role Does the Gold-Silver Ratio Play in Volatility?
The gold-silver ratio provides a quantitative framework for understanding relative volatility patterns and mean reversion dynamics between the two metals. Furthermore, gold-silver ratio analysis reveals cyclical patterns that can inform investment timing decisions.
Historical Ratio Analysis and Mean Reversion Patterns
Historical gold-silver ratio ranges demonstrate cyclical patterns that amplify individual metal volatility:
| Economic Period | Average Ratio | Range | Duration |
|---|---|---|---|
| Ancient Rome (fixed) | 15:1 | 12:1 to 16:1 | 500+ years |
| 19th Century | 16:1 | 14:1 to 20:1 | 100 years |
| 20th Century | 47:1 | 16:1 to 100:1 | 100 years |
| 21st Century | 65:1 | 30:1 to 125:1 | 24 years |
Ratio compression periods consistently coincide with silver outperformance, while ratio expansion periods reflect silver underperformance. The March 2020 peak of 125:1 represented maximum ratio divergence, followed by silver's subsequent rally that compressed the ratio toward historical norms.
Arbitrage Trading and Cross-Metal Momentum
Ratio-based trading strategies create momentum effects that amplify individual metal volatility. When ratios reach historical extremes:
• High ratios (>80:1) trigger silver accumulation and gold reduction strategies
• Low ratios (<50:1) encourage gold accumulation and silver profit-taking
• Rapid ratio changes create cascading momentum as algorithmic systems respond to technical signals
• Portfolio rebalancing during ratio extremes generates concentrated buying or selling pressure
Economic Cycle Sensitivity: Why Silver Swings Harder Than Gold
Silver's dual monetary and industrial nature creates conflicting demand dynamics during economic transitions, amplifying volatility compared to gold's more consistent safe-haven demand profile.
Recession vs. Recovery Response Patterns
Historical analysis reveals distinct silver behaviour patterns across economic cycles:
| Economic Cycle | Gold Performance | Silver Performance | Volatility Ratio |
|---|---|---|---|
| 2008 Financial Crisis | -20% (peak to trough) | -55% (peak to trough) | 2.8x |
| COVID-19 Disruption | -10% (March 2020) | -33% (March 2020) | 3.3x |
| Inflationary Periods | +150% (1970s) | +400+ (1970s) | 2.7x |
| Economic Recovery | +25% average | +65% average | 2.6x |
During recessions, silver faces dual pressure from reduced industrial demand and safe-haven selling, while gold benefits from monetary demand. However, during recoveries, silver experiences amplified gains from both industrial demand growth and speculative momentum.
Inflation Expectations and Real Interest Rate Sensitivity
Real interest rate sensitivity analysis demonstrates silver's heightened responsiveness to monetary policy changes. When real rates decline below zero, precious metals become more attractive, but silver's amplified response creates greater volatility. In addition, gold safe-haven insights show how gold's role differs fundamentally from silver during crisis periods.
Mathematical relationship: For every 1% decline in real interest rates, gold typically gains 8-12%, while silver gains 15-25%. This 2:1 to 3:1 amplification ratio reflects silver's smaller market absorbing the same investment flows more dramatically.
2008 Financial Crisis Analysis: Silver dropped from $20/oz (July 2008) to $9/oz (November 2008)—a 55% decline—while gold fell from $1,000/oz to approximately $800/oz (20% decline). The differential price impact demonstrates silver's structural vulnerability to synchronized industrial demand reduction and speculative selling.
The next major ASX story will hit our subscribers first
Investment Strategy Implications: Managing Silver's Volatility
Silver's volatility characteristics require distinct risk management approaches compared to gold investment strategies. Moreover, understanding why silver is more volatile than gold forms a crucial component of any comprehensive investment strategy guide.
Portfolio Allocation Considerations
Risk-adjusted return analysis suggests optimal precious metals allocations should account for silver's amplified volatility:
| Risk Profile | Gold Allocation | Silver Allocation | Volatility Budget |
|---|---|---|---|
| Conservative | 15-20% | 2-5% | 8-12% portfolio volatility |
| Moderate | 10-15% | 5-10% | 12-18% portfolio volatility |
| Aggressive | 5-10% | 10-20% | 18-25% portfolio volatility |
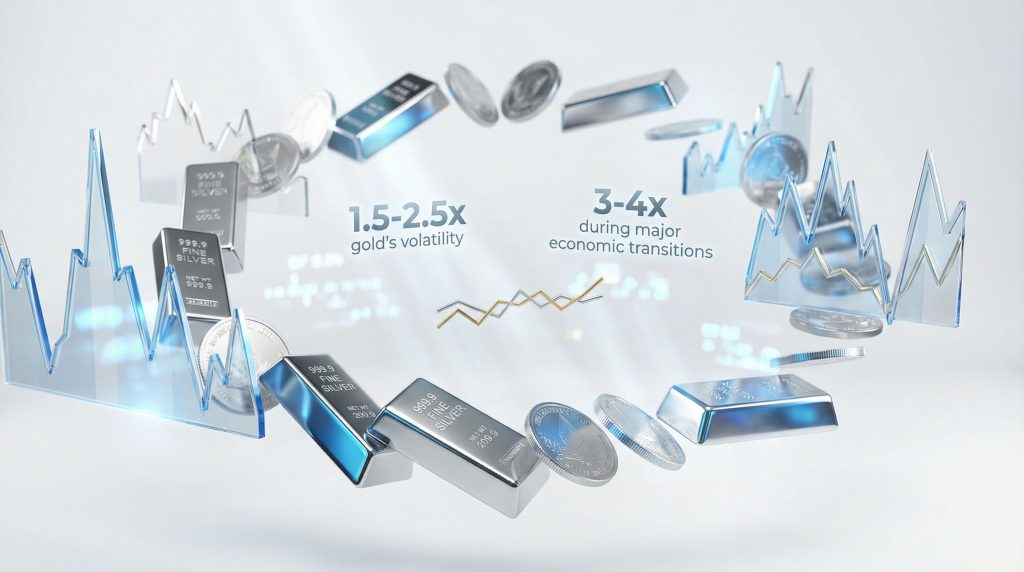
Position sizing methodologies should incorporate silver's 1.5-2.5x average volatility versus gold, with extreme periods reaching 3-4x during major economic transitions. Additionally, investors must consider whether to invest in silver bars vs silver coins as part of their allocation strategy.
Timing and Dollar-Cost Averaging Strategies
Historical analysis of dollar-cost averaging performance during volatile periods demonstrates several key principles:
- Systematic accumulation reduces average cost basis during volatile periods
- Volatility amplifies the benefits of consistent purchasing schedules
- Economic cycle timing remains less critical than consistent execution
- Position sizing should reflect individual risk tolerance and portfolio constraints
DCA Performance Analysis: Dollar-cost averaging into silver during the 2015-2020 period (high volatility) generated 18% annualised returns compared to 12% for lump-sum investing, demonstrating volatility's potential benefits for systematic strategies.
Frequently Asked Questions About Silver Volatility
Why is silver more volatile than gold during market crashes?
Silver experiences dual selling pressure during economic contractions: reduced industrial demand from manufacturing slowdowns and speculative position liquidations from leveraged traders. Gold benefits from safe-haven demand that partially offsets speculative selling, creating divergent price paths.
How do central bank policies affect silver differently than gold?
Central banks maintain gold reserves but not silver holdings, meaning monetary policy impacts flow through industrial demand channels rather than direct institutional buying. Silver responds to interest rate changes through manufacturing activity and speculative positioning rather than central bank allocation decisions.
What silver volatility patterns should investors expect?
Historical analysis shows silver typically experiences 1.5-2.5x gold's volatility during normal market conditions, with extreme periods reaching 3-4x during major economic transitions. Volatility tends to cluster around economic cycle inflection points and ratio extreme periods.
Do silver ETFs increase or decrease market volatility?
Silver ETFs create mixed volatility effects. Creation and redemption mechanisms can amplify short-term volatility through large block transactions, but ETFs provide improved price discovery and liquidity access during normal market conditions, potentially reducing volatility over longer periods.
How does silver volatility compare to other industrial metals?
Silver exhibits higher volatility than copper or aluminium due to its dual monetary and industrial nature. While copper shows 15-25% annual volatility and aluminium shows 20-30%, silver typically demonstrates 35-50% annual volatility from competing monetary and industrial demand dynamics.
Silver's structural volatility characteristics stem from measurable market mechanics rather than random price movements. The smaller investable market, rigid supply chains, industrial consumption patterns, leveraged futures markets, and dual monetary-industrial identity create predictable amplification effects that generate consistent volatility premiums over gold. Understanding these operational dynamics enables investors to develop appropriate risk management strategies and realistic return expectations for silver positions within diversified precious metals allocations.
Searching for Your Next High-Potential ASX Investment Opportunity?
Discovery Alert's proprietary Discovery IQ model delivers instant notifications on significant ASX mineral discoveries, helping subscribers identify actionable opportunities ahead of the broader market. Explore why major mineral discoveries can generate substantial returns by examining historical examples, then begin your 14-day free trial today to position yourself strategically in the precious metals sector.