
June 4, 2026
The Hidden Fault Lines Beneath the World's Most Concentrated Equity Markets
Investor psychology has a curious relationship with concentration. When a narrow group of assets drives the overwhelming majority of returns, the experience feels like validation rather than warning. Returns compound, narratives strengthen, and the feedback loop between price action and conviction becomes self-reinforcing. It is precisely in these moments, when breadth collapses and leverage expands, that the structural fragility beneath the surface becomes most dangerous. The intersection of the South Korea currency crisis and AI stock bubble risks represents one of the most compelling, and most underappreciated, macro setups in global financial markets today.
When big ASX news breaks, our subscribers know first
Why Market Concentration Is the Hidden Risk No One Is Pricing In
The Narrowing Breadth Problem: From the Magnificent Seven to a Two-Stock Index
The debate around market concentration in US equities has centred on the so-called Magnificent Seven technology giants that have dominated NASDAQ returns over the past several years. Critics rightly note that this level of narrowness is historically unusual. Yet compared to what is unfolding in South Korea, the NASDAQ's concentration problem looks almost diversified by comparison.
The Korean Stock Price Index, commonly known as the KOSPI, has effectively become a two-stock market. Samsung Electronics and SK Hynix together now account for materially more than half of the entire index's market capitalisation, driven by their dominant positions in global memory chip manufacturing and their direct exposure to the AI infrastructure buildout. This is not a market with narrow breadth. It is a market where breadth has functionally ceased to exist.
Furthermore, South Korea's AI boom has propelled the KOSPI into territory that many emerging market specialists are now describing as a massive bubble, with the index's extraordinary rise drawing comparisons to some of the most extreme valuation episodes in modern financial history.
How Single-Sector Dominance Creates Systemic Fragility in Equity Markets
When a major index becomes dependent on fewer than five companies for the majority of its price gains, historical precedent consistently demonstrates that the eventual unwinding is faster and deeper than the preceding rally. This is not simply because concentrated markets are volatile. It is because the mechanisms that drive concentration, namely momentum-chasing capital, leveraged retail participation, and passive vehicle inflows, are inherently procyclical. They amplify upside during the advance and collapse symmetrically on the reversal.
The KOSPI has risen approximately 291% from its April 2025 low, representing a gain of roughly 3.9 times in just over thirteen months. For context, the NASDAQ composite rose approximately 83.9% over the same period, which is itself a historically exceptional performance. The KOSPI's trajectory, driven almost entirely by two semiconductor exporters riding the global AI hardware boom, has produced a turbocharged microcosm of everything that concerns analysts about the broader technology rally. Concerns about gold during market volatility are similarly relevant here, as concentrated equity markets tend to trigger sharp risk-off rotations that benefit monetary metals.
KOSPI vs. NASDAQ: A Side-by-Side Concentration Risk Comparison
| Metric | NASDAQ (2024-2025) | KOSPI (2024-2025) |
|---|---|---|
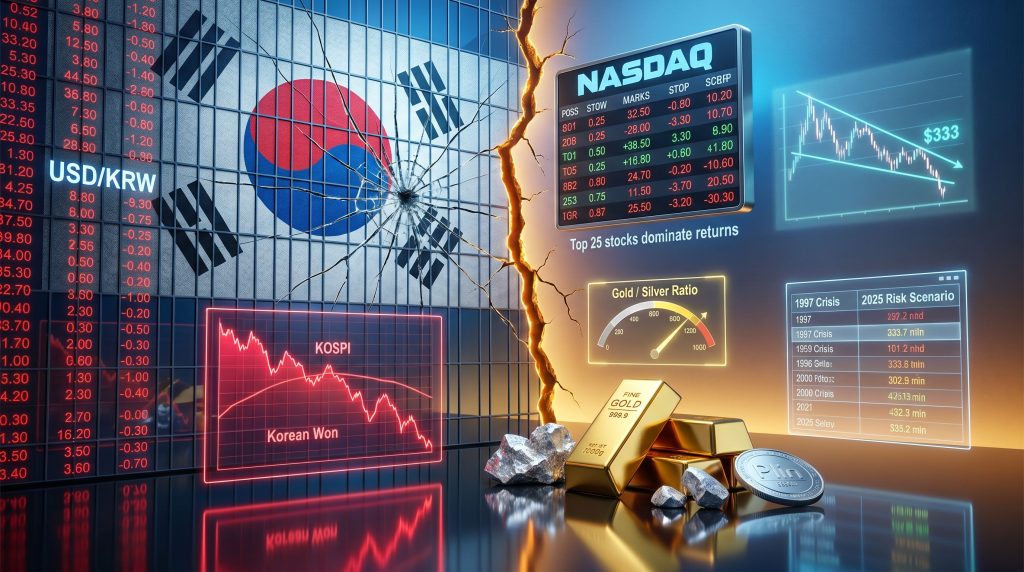
| Market breadth | Top 25 stocks dominate returns | Effectively 2 stocks drive index |
| Primary sector | AI, cloud, semiconductors | AI-linked semiconductors |
| Foreign investor trend | Gradual rotation | Active net withdrawal |
| Retail leverage | Elevated | Record margin levels |
| Currency pressure | USD broadly stable | Korean won weakening despite export boom |
| 13-month gain from April 2025 low | ~83.9% | ~291% |
| Historical parallel | Nifty Fifty (1970s) | More extreme than any prior NASDAQ phase |
The Nifty Fifty era of the early 1970s was itself considered a dangerously narrow advance. The KOSPI's current structure is more extreme than that historical benchmark, with market leadership concentrated in just two companies rather than fifty.
What Is the South Korea Currency Crisis Risk and Why Is It Building Now?
Understanding the Korean Won's Structural Weakness in 2025
The Korean won is exhibiting a paradox that reveals the depth of the structural pressures building beneath the surface. South Korea's two dominant semiconductor exporters are generating record dollar-denominated revenues, with memory chip prices having risen approximately 90% and 180% year-over-year across different product categories. These companies are operating with constrained supply against excess demand, producing extraordinary cash flows denominated in US dollars.
Yet despite this dollar inflow from chip exports, the USD/KRW exchange rate has continued to climb, meaning the won is losing purchasing power precisely when the country's export revenues are at historic highs. This divergence is the central puzzle of the South Korea currency crisis and AI stock bubble dynamic, and it deserves considerably more attention than it is currently receiving in mainstream financial commentary.
The Paradox of Record Chip Sales and a Depreciating Currency
Several structural factors explain why record semiconductor revenues are failing to support the won:
-
Foreign institutional withdrawal: Professional international fund managers have been net sellers of Korean equities throughout most of 2025, withdrawing capital that previously anchored currency stability. As the KOSPI climbed to historically extreme valuations, professional managers took profits and repatriated capital.
-
Retail replacement dynamic: Domestic South Korean retail investors, including pension-age Koreans, have stepped in to replace departing institutional capital using record margin leverage. Some are reportedly surrendering insurance policies and savings vehicles to increase equity exposure to these two dominant stocks.
-
Energy import costs: South Korea is a significant energy importer. Supply chain disruptions affecting major transit routes have forced the country to pay substantially more in dollars for energy, depleting dollar reserves at precisely the moment currency support is most needed.
-
Yen carry trade dynamics: A portion of the capital that flowed into Korean assets came via cheap yen-funded carry trades. As Japanese interest rate conditions shift, this hot money creates additional vulnerability.
When retail investors at record leverage levels replace exiting professional capital in a concentrated, momentum-driven market, the historical pattern points toward an accelerated reversal when sentiment shifts.
How Foreign Direct Investment Withdrawal Is Undermining the Won
A key technical observation about the KOSPI reveals a historically unusual relationship: the Korean won typically strengthens when foreign capital flows into the market during strong performance periods. The current environment is doing the opposite. Despite the KOSPI's extraordinary gains, the USD/KRW rate has continued higher, indicating net capital outflows are overwhelming the dollar revenues from chip exports.
Charts tracking the KOSPI against the USD/KRW exchange rate show that periods of KOSPI weakness have historically been associated with won weakness, and vice versa. What is remarkable about the current setup is that the most extreme KOSPI rally in recent history is coinciding with won depreciation, not appreciation. This unusual decoupling signals that foreign direct investment is leaving the country at a scale sufficient to overwhelm even record export revenues. Consequently, how this dynamic interacts with gold versus stock markets on a global basis becomes an increasingly important question for asset allocators.
How Does the 1997 South Korea Currency Crisis Compare to Today's Risk?
Revisiting the 1997 Asian Financial Crisis: Structural Causes and Collapse Mechanics
The 1997 Asian financial crisis unfolded through a specific chain of vulnerabilities that led to one of the most severe emerging market collapses of the modern era:
-
Corporate and banking sector over-leverage: South Korean chaebols carried extreme debt-to-equity ratios with weak underlying profitability, creating balance sheet fragility throughout the corporate sector.
-
Short-term foreign currency borrowing: Korean institutions borrowed heavily in US dollars with short maturities, creating a refinancing cliff when global credit conditions tightened.
-
Reserve depletion: As the won came under pressure, the Bank of Korea burned through foreign exchange reserves attempting to defend the currency peg.
-
Confidence collapse: Foreign lenders refused to roll over short-term debt obligations, triggering a liquidity spiral that rapidly became a solvency crisis.
-
IMF intervention: South Korea ultimately required an IMF rescue package worth approximately $58 billion, accompanied by painful structural reform conditions.
1997 vs. 2025: A Structural Comparison
| Dimension | 1997 Crisis | 2025 Risk Scenario |
|---|---|---|
| Crisis type | Foreign currency liquidity crisis | Equity valuation and currency confidence crisis |
| Trigger mechanism | Short-term USD debt rollover failure | FDI withdrawal and retail leverage unwind |
| Balance sheet stress | Corporate and bank insolvency risk | Retail margin accounts and pension capital misallocation |
| Currency pressure source | Dollar debt obligations | Energy import costs and capital outflows |
| Market concentration | Broad chaebol sector weakness | Two-stock index dependency |
| IMF involvement | Required | Not yet applicable |
| Contagion pathway | Regional banking system | Global AI sector sentiment and EM currency basket |
What Is Different This Time: Valuation Risk vs. Liquidity Risk
The 1997 crisis was fundamentally a liquidity event driven by dollar debt mismatches. Today's risk is better characterised as a confidence and valuation crisis, where the unwinding of an extreme equity concentration trade interacts with structural currency weakness to produce a potentially severe capital flow reversal.
South Korea's foreign exchange reserve position is substantially stronger today than in 1997, which reduces the probability of an acute liquidity crisis requiring IMF intervention. However, the currency confidence dimension, amplified by energy import costs and the yen carry trade, adds a layer of fragility that is structurally distinct from but not necessarily less severe than the 1997 template. The intersection of the South Korea currency crisis and AI stock bubble concerns makes this a uniquely complex macro environment to navigate.
Is the AI Stock Boom a Bubble? Applying Historical Valuation Frameworks
Defining Bubble Conditions: What Separates Speculation from Sustainable Growth
A financial bubble typically exhibits several measurable characteristics that distinguish speculative excess from sustainable valuation re-rating:
- Valuation multiples that price in decades of future earnings at current growth rates
- Market capitalisation concentration in a narrow group of thematically linked companies
- Retail participation surge driven by narrative rather than fundamental analysis
- Leverage expansion at both the investor and corporate level
- IPO and listing activity reaching historic scale, signalling peak exit liquidity demand for early institutional investors
The potential listing of SpaceX at a reported valuation of approximately $1.8 trillion represents exactly the kind of landmark event that historically accompanies market cycle peaks. It is not simply the scale of the listing itself, but the mechanism: passive investment vehicles including major index funds would mechanically purchase shares, creating what some analysts describe as a structured exit liquidity event for early institutional holders.
The Bull Case: Why Today's AI Leaders Differ from Dot-Com Era Companies
Supporters of sustained AI valuations point to structural differences from the 2000 technology bubble:
- Leading AI-adjacent companies generate substantial free cash flow and are largely self-financing
- Enterprise AI adoption is producing measurable productivity gains across multiple sectors
- Semiconductor demand is being driven by verifiable capital expenditure commitments from hyperscale cloud providers
- Unlike 2000-era companies, today's leaders have proven revenue models rather than speculative business plans dependent on future monetisation
The Bear Case: Concentration, Expectations, and the Exit Liquidity Question
Critics of current AI valuations raise the following concerns:
- Current market capitalisation levels exceed every prior historical valuation peak, including 1929 and 2000, across multiple standard metrics
- Market breadth is historically narrow, with index gains concentrated in fewer than ten companies
- Major upcoming IPO events may represent peak exit liquidity moments for early institutional investors who helped build the narrative
- Passive investment vehicles have mechanically amplified concentration by continuously purchasing the largest-cap constituents, creating a feedback loop between index weights and capital flows
The distinction between a bubble and a re-rating is ultimately resolved by whether future earnings growth justifies current prices. The risk is not that AI is unimportant. It is that the market may have already priced in outcomes that will take a decade or more to materialise.
The NASDAQ-to-Gold Ratio: The Most Honest Measure of Relative Value
When equity market performance is measured in gold ounces rather than fiat currency, a materially different picture emerges. Dividing the NASDAQ or S&P 500 by the gold price reveals that equity markets have underperformed gold over the past three to four years on a real-value basis, despite nominal record highs. The ratio's long-term chart structure shows what technical analysts describe as a rounded top formation, with recent quarters of apparent NASDAQ outperformance occurring precisely during gold's sharpest correction period.
Once gold resumes its uptrend, this ratio is expected by some analysts to resume its structural decline. This framing is essential for investors assessing whether equity wealth gains are real or simply reflective of currency debasement. A portfolio that nominally gains 20% in a year while the monetary measuring stick loses 25% of its purchasing power has not generated real wealth. It has generated a tax liability denominated in a shrinking unit of account.
What Is Stagflation and Why Does It Matter for Asset Allocation Today?
Defining Stagflation: The Dual Pressure of Rising Costs and Stagnant Growth
Stagflation occurs when an economy simultaneously experiences:
- Persistent inflation: Rising prices for goods, services, and energy that erode real purchasing power
- Economic stagnation: Slowing GDP growth, rising unemployment, and declining real wages
- Policy paralysis: Central banks unable to cut rates without worsening inflation, or raise rates without deepening the slowdown
This combination is particularly destructive because it eliminates the standard policy responses available to central banks. Rate cuts would worsen inflation. Rate hikes would worsen unemployment. The result is an environment where conventional monetary tools are poorly suited to the problem. In addition, stagflation and precious metals have historically shared a powerful relationship that asset allocators ignore at their peril.
Supply Chain Disruption as a Stagflationary Amplifier
Global shipping route disruptions create layered cost pressures that extend well beyond headline freight rates:
-
Insurance premiums on cargo increase significantly when major transit routes are compromised, adding cost to every shipment regardless of whether physical disruption occurs
-
Rerouting costs add both additional transit time and fuel expenditure to supply chains that were optimised for specific routing assumptions
-
Inventory buffer requirements force companies to hold substantially more stock, tying up working capital and reducing financial efficiency
-
Input delivery delays can halt production lines even when finished goods demand remains strong, creating the supply-side contraction that adds the stagnation component to inflation
The 1970s stagflation episode demonstrated that supply-side cost shocks can simultaneously raise consumer prices while suppressing economic output. This combination is poorly suited to conventional monetary policy tools, which were designed to address demand-side inflation or demand-side recession, not both simultaneously.
How Stagflation Redistributes Wealth: Asset Owners vs. Wage Earners
Stagflation functions as a wealth redistribution mechanism that systematically favours those who hold real assets over those who depend on wages or fixed-income instruments. Asset values, including property, equities, and commodities, tend to rise nominally during inflationary periods, even if they underperform monetary metals in real terms. Meanwhile, real wages compress as nominal wage growth fails to keep pace with price increases.
The tax system compounds this dynamic through what is known as bracket creep and capital gains exposure. Nominal asset gains, even those that merely preserve purchasing power against a depreciating currency, generate tax liabilities. Investors who held assets that simply retained real value find themselves forced to sell portions of their holdings to meet tax obligations denominated in a currency that is simultaneously losing value. This mechanism progressively hollows out the wealth of those who are not in the top tier of asset holders.
The next major ASX story will hit our subscribers first
How Are Gold, Silver, and Platinum Performing in a Stagflationary Environment?
Gold's Technical Structure in 2025: Reading the Correction Phases
Gold's price action through 2025 has followed a recognisable multi-wave correction pattern following its historic breakout above the $2,000 level. Technical analysis identifies three distinct selling waves within this correction:
-
First correction wave: A sharp and fast decline from approximately the $5,600 range to around $4,400, representing a flush of leveraged long positions that had accumulated during the initial breakout phase
-
Second correction wave: A more violent retest that pushed prices toward $4,098, effectively rinsing investors who bought the first dip in anticipation of an immediate recovery
-
Third correction wave (current): A slower, grinding channel decline, far less violent than the first two waves, characteristic of a market working through excess positioning rather than experiencing a structural trend reversal
Key technical levels to monitor include the descending channel ceiling, referred to by some analysts as the capping descending grind line, and the prior correction lows around $4,098 as potential downside risk if a broader risk-off event forces liquidity selling. A decisive break above the descending resistance line with momentum confirmation would signal the correction has concluded and a resumption of the primary uptrend is underway.
Silver's Long-Term Technical Setup: The Falling Wedge and the $333 Target Framework
Silver's price structure presents what technical analysts describe as a falling wedge continuation pattern following an extraordinary advance from below $50 to $121, a move of approximately $71 in a compressed timeframe. This pattern is considered a bullish continuation structure in technical analysis, implying the correction is a pause within an ongoing bull market rather than a reversal. Furthermore, understanding silver relative to gold provides essential context for positioning within the precious metals complex at this stage of the cycle.
| Phase | Price Range | Interpretation |
|---|---|---|
| Initial breakout | Sub-$50 to $121 | First major leg; $71 move in compressed timeframe |
| First interim target | ~$100-$110 | Reached; shooting star candle confirmed |
| Current phase | Correction and consolidation | Three-wave selling pattern; grinding lower |
| Second interim | ~$110 area | Rejection expected; currently in progress |
| Long-term target | ~$333 | Derived geometrically from 1980 historical data |
| Ultimate thesis | Single-digit gold/silver ratio | Implies dramatic silver outperformance relative to gold |
The $333 silver target is derived geometrically from the structure of multi-decade price history extending back to 1980, including silver's historic $50 trading level from that era. The long-term thesis extends beyond this target, with the gold-silver ratio analysis pointing toward eventual compression to single digits, implying that silver would dramatically outperform gold on a percentage basis over the full cycle.
The $333 silver target is a long-term technical projection based on multi-decade structural analysis, not a near-term price forecast. It assumes the continuation of monetary debasement trends and should be considered within a framework of appropriate investment time horizons and risk tolerance.
Why Platinum and Silver Are Preferred Over Industrial Commodities in a Debasement Cycle
A critical and often misunderstood distinction separates monetary metals from industrial commodities in a fiat debasement environment. When copper, zinc, iron ore, and other industrial commodities are measured not in dollar terms but in gold ounces, their relative performance deteriorates substantially.
Copper, for example, may appear to be performing strongly on a nominal price chart. When divided by the gold price, however, the picture reveals consistent underperformance over any extended period. The same applies to zinc, iron ore, and virtually every industrial commodity. The only recent quarter in which industrial commodities have looked competitive against gold corresponds precisely to the period when gold experienced its sharpest correction, a temporary and misleading crosscurrent that is likely to reverse once gold resumes its uptrend.
The implication for asset allocation is direct: investors seeking to preserve and grow real wealth in a debasement cycle should concentrate in monetary metals, specifically gold, silver, and platinum, rather than diversifying broadly across the commodity complex. The performance gap between monetary and industrial metals in gold-adjusted terms consistently supports concentration over diversification within the commodity space.
What Happens to Global Markets If the KOSPI Corrects Sharply?
The Contagion Pathway: From Korean Retail Margin Calls to Global Risk-Off
A sharp KOSPI correction would likely trigger the following sequence of events:
-
Margin call cascade: Retail investors using record leverage would face forced selling pressure across concentrated positions in Samsung and SK Hynix
-
Won depreciation acceleration: Capital flight would intensify currency weakness, potentially triggering a feedback loop between equity selling and currency decline
-
Semiconductor sector sentiment shock: Given the two companies' dominant global market share in memory chips, a KOSPI collapse would reverberate through global AI hardware supply chain narratives and potentially pressure AI-adjacent stocks globally
-
Emerging market contagion: Won weakness could pressure other Asian currencies, particularly those with similar energy import dependencies and export-driven growth models
-
Global risk-off rotation: International capital would seek safe-haven assets, potentially benefiting gold in the near term before structural debt market concerns reassert
The Precious Metals Safe Haven Thesis in a Multi-Asset Crisis
The conventional crisis playbook directs capital from equities into government bonds. However, several structural factors complicate this assumption in the current environment:
-
Sovereign debt levels in major Western economies have reached historically unprecedented levels relative to GDP, undermining the risk-free status of government bonds
-
Interest rate trajectories remain elevated, with some analysts projecting major Western central bank rates potentially reaching 6%, a level that would cause significant mark-to-market losses on existing bond holdings
-
Real assets including residential property and equities show nominal resilience but consistent underperformance when measured in gold ounces over three to four year periods
The bond market's traditional role as a crisis safe haven is structurally compromised by the intersection of high sovereign debt, elevated rates, and the long-term trend of currency debasement. In an environment where both equities and bonds face structural headwinds, the case for monetary metals as the primary capital preservation vehicle becomes substantially more compelling.
Precious Metals vs. Other Asset Classes: Where Does Capital Go in a Crisis?
The Monetary Metals Case for the Current Macro Environment
Gold, silver, and platinum share a characteristic that distinguishes them from every other asset class in a fiat debasement environment: they cannot be created by central bank policy. Their supply grows only through geological discovery and extraction, a slow and capital-intensive process that fundamentally limits the rate at which new supply enters the market. This supply inelasticity is precisely what makes them effective stores of value when the purchasing power of fiat currencies is under sustained pressure.
The practical investment implication, based on the analysis discussed above, is straightforward. Rather than spreading capital across eight different commodity or asset class themes in pursuit of broad exposure, concentrated allocation to the monetary metals complex has historically produced superior real returns during debasement cycles. Diversification within the wrong asset classes produces the psychological comfort of broad exposure while delivering the returns of the worst performers in the group.
Key takeaways for investors navigating the current macro environment:
-
Market concentration risk is not limited to the NASDAQ. The KOSPI represents an extreme version of the same dynamic, amplified by its two-stock dependence and retail leverage at record levels
-
Currency weakness in export-driven economies despite record revenues signals deeper structural capital flow problems that conventional monetary policy cannot easily address
-
Stagflation benefits asset owners disproportionately while compressing real wages, making asset allocation decisions made during this period particularly consequential over the long term
-
Gold, silver, and platinum have consistently outperformed industrial commodities when measured on a real purchasing power basis during monetary debasement cycles
-
The bond market's traditional role as a crisis safe haven is structurally compromised by sovereign debt levels and rate trajectories
-
Technical analysis of precious metals suggests a multi-wave consolidation is in progress before a resumption of the broader bull market trend, with the $333 long-term silver target derived from geometric analysis of multi-decade price structure
FAQ: South Korea Currency Crisis and AI Stock Bubble
Is South Korea Currently in a Currency Crisis?
As of mid-2025, South Korea is not in a formal currency crisis, but the Korean won is exhibiting meaningful stress signals including persistent weakening against the US dollar despite record semiconductor export revenues, net foreign institutional capital withdrawal, elevated domestic retail leverage in equity markets, and rising energy import costs depleting dollar reserves. These conditions are considered potential precursors to more acute currency instability if the equity market reverses sharply and triggers a margin call cascade.
What Caused the 1997 South Korea Currency Crisis?
The 1997 crisis was primarily a foreign currency liquidity event. Korean banks and corporations had borrowed heavily in short-term US dollar debt. When foreign lenders refused to roll over these obligations, the won came under severe pressure, foreign exchange reserves were depleted, and South Korea required an IMF rescue package of approximately $58 billion. The underlying vulnerabilities included over-leveraged chaebols, weak bank governance, and inadequate foreign reserve buffers relative to short-term foreign currency obligations.
Is the AI Stock Boom a Bubble in 2025?
Analysts are divided on this question. Critics point to historically extreme valuation multiples that exceed every prior market peak including 1929 and 2000, narrow market breadth, record IPO activity, and passive fund concentration as classic bubble indicators. Supporters argue that leading AI companies generate strong cash flows and that enterprise AI adoption is producing real productivity gains that differentiate the current boom from the speculative dot-com era. The debate remains unresolved, with the answer ultimately dependent on whether AI earnings growth over the next three to five years justifies current pricing.
How Does Stagflation Affect Precious Metals Prices?
Stagflation historically creates a favourable environment for monetary metals. Rising inflation erodes the real value of cash, bonds, and fixed-income assets, while economic stagnation reduces the appeal of growth-oriented equities. Gold and silver tend to benefit as capital seeks stores of value not subject to central bank debasement. The 1970s stagflation period produced one of the most significant precious metals bull markets in modern financial history, with gold rising from approximately $35 per ounce in 1971 to over $800 by 1980.
What Is the Gold-Silver Ratio and Why Does It Matter?
The gold-silver ratio measures how many ounces of silver are required to purchase one ounce of gold. Historically, this ratio has ranged between approximately 15:1 and 100:1. When the ratio is elevated, silver is considered cheap relative to gold, and historical episodes of ratio compression have produced silver outperformance of gold on a percentage basis. The long-term technical thesis discussed above implies the ratio could compress to single digits during the full cycle, which would represent extraordinary silver outperformance relative to every other asset class.
Could a KOSPI Crash Trigger a Global Financial Contagion Event?
A KOSPI correction alone is unlikely to trigger a global systemic crisis of the scale seen in 1997-1998. However, given the KOSPI's concentration in AI-linked semiconductor stocks, a sharp reversal could function as a leading indicator for broader AI sector sentiment deterioration, potentially accelerating a correction in NASDAQ-listed AI hardware and software companies. The currency dimension adds a second contagion pathway through emerging market foreign exchange markets, and the margin call dynamics could amplify the speed and severity of any initial correction.
This article is for informational and educational purposes only and does not constitute investment advice or a solicitation to buy or sell any securities or financial instruments. The views and analysis presented reflect publicly available market commentary and technical analysis frameworks. All forward-looking statements, price targets, and scenario projections are speculative in nature and subject to significant uncertainty. Past performance of any asset class is not indicative of future results. Readers should conduct their own research and consult a licensed financial adviser before making any investment decisions.
Want to Position Yourself Ahead of the Next Major Mineral Discovery?
While macro forces reshape global markets, Discovery Alert's proprietary Discovery IQ model cuts through the noise by delivering real-time alerts on significant ASX mineral discoveries — turning complex data across 30-plus commodities into a single, actionable gold-equivalent metric. Explore historic discoveries and their extraordinary returns, then begin your 14-day free trial at Discovery Alert to secure your market-leading edge before the broader market moves.