
July 18, 2026
Why Institutional Gold Forecasts Deserve More Attention Than Weekly Price Charts
Precious metals markets have a long history of separating short-term price behaviour from long-term value trajectories. The two rarely move in the same direction at the same time, and the investors who confuse one for the other tend to make the most costly decisions. Understanding why a correction happens matters far more than reacting to the fact that it happened. That distinction sits at the core of why the State Street gold forecast $5,000 by Q1 2027 carries analytical weight that deserves careful examination rather than dismissal.
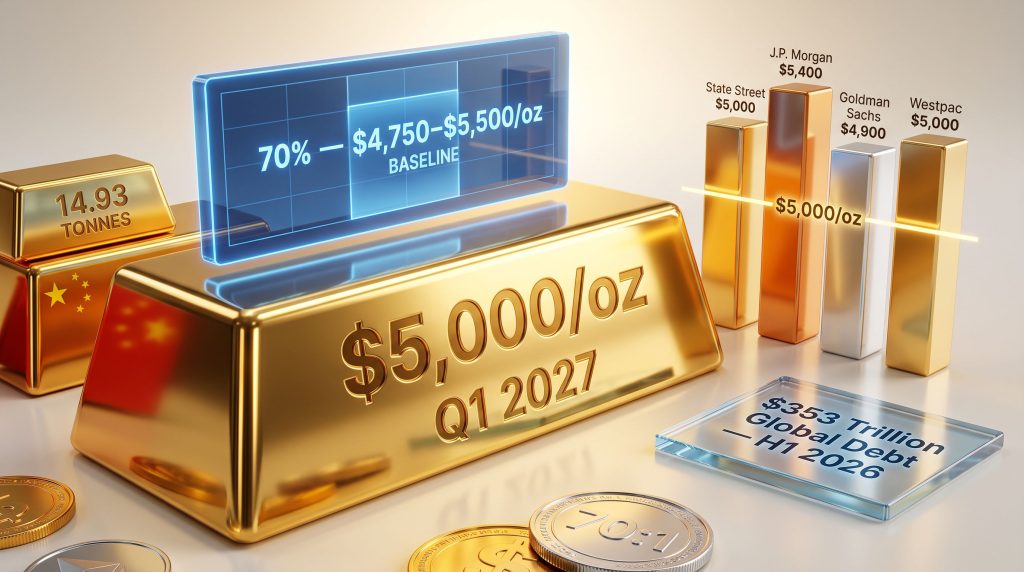
State Street Investment Management's July 2026 Monthly Gold Monitor does not frame its outlook as a simple directional call. Instead, the firm's SPDR Gold Strategy Team constructs a probability-weighted scenario matrix that assigns likelihoods to multiple price outcomes. The headline target of $5,000 per ounce by early 2027 sits within a 70% probability baseline range of $4,750 to $5,500/oz. That framing is not accidental. It reflects a level of methodological discipline that distinguishes institutional commodity research from retail price speculation.
When big ASX news breaks, our subscribers know first
Three Structural Pillars Supporting the $5,000 Target
Record Global Debt and What It Means for Monetary Hedges
The most durable argument in State Street's thesis is fiscal in nature. Total global debt reached an all-time high of $353 trillion in H1 2026, with government borrowing now approaching one-third of that total, also a record high. US federal net interest expenses as a proportion of GDP have climbed to multi-decade peaks, creating a structural sensitivity to interest rate levels that limits how aggressively policymakers can maintain restrictive monetary conditions over the long term.
This dynamic matters for gold in a specific way. When sovereign debt burdens reach structural extremes, the monetary policy path that debt servicing actually permits tends to run looser than an inflation-neutral environment would otherwise demand. Gold, as a monetary reserve asset with no counterparty risk and no dilution mechanism, benefits directly from that environment. The $353 trillion figure does not reset because gold corrected 27% in a quarter. It compounds.
Furthermore, the institutional gold price forecast landscape reflects these fiscal pressures, with multiple major institutions converging on similar structural conclusions about the long-term implications of sovereign debt accumulation.
The Collapse of the 60/40 Portfolio's Built-In Hedge
For approximately 25 years through 2021, equities and bonds moved in opposite directions with enough consistency that the inverse relationship formed the backbone of institutional portfolio construction. A 60/40 equity-bond split provided automatic stabilisation: when equities fell, bonds typically rallied, cushioning drawdowns.
That regime has materially broken down. Stock-bond correlations have remained elevated relative to the prior period, meaning bonds no longer reliably provide the hedging function they once did. For institutional allocators managing multi-asset portfolios, this creates a genuine structural problem: the built-in hedge is gone, and a replacement is needed. The gold-bond relationship has consequently attracted renewed institutional interest, as gold has demonstrated consistent diversification properties across the post-2021 macro environment.
Sovereign and Retail Physical Demand as a Structural Price Floor
Central bank gold reserves buying behaviour during the 2026 correction provides one of the more revealing data points in the current cycle. The People's Bank of China added 14.93 tonnes to its gold reserves in June 2026 alone, representing its largest single-month purchase since 2023 and its 20th consecutive month of accumulation. This buying occurred during gold's steepest quarterly decline since 2013.
Central banks operate on decade-long reserve mandates, not quarterly return targets. Their willingness to accumulate during the deepest drawdown in over a decade signals that the price dip was treated as an entry opportunity, not a warning sign.
China's retail gold imports also surged following geopolitical escalation in early 2026, with local premiums rising in response to constrained onshore supply. This combination of institutional sovereign buying and retail physical demand creates a price floor that behaves very differently from ETF-driven investment flows, which are far more sensitive to short-term rate expectations.
Understanding the 2026 Correction: The Mechanics Behind the Selloff
What Actually Caused a 27% Drop From the All-Time High
Gold reached an all-time high of $5,589 per ounce in January 2026, according to the World Gold Council. By mid-2026, the price had fallen to approximately $4,100/oz, representing a decline of roughly 27% and ranking as the steepest quarterly drop since 2013. The scale of the move prompted widespread questions about whether the structural thesis had broken down. The evidence suggests it had not.
| Metric | Data Point |
|---|---|
| Gold All-Time High (January 2026) | $5,589/oz |
| Price Level at Time of Analysis | ~$4,100/oz |
| Magnitude of Decline | ~27% |
| Severity Ranking | Steepest quarterly drop since 2013 |
| June 2026 Monthly US-Listed ETF Outflows | ~$5.3 billion |
| US Money Market Fund Assets (Record) | $7.9 trillion |
The causal chain is traceable and specific. US-Iran military conflict in early 2026 drove energy prices sharply higher, transmitting into broader inflationary pressure. Elevated inflation forced Federal Reserve Chair Kevin Warsh into a tighter-than-expected policy stance. The US Overnight Index Swap curve shifted to pricing approximately 1.5 rate hikes by mid-year, a dramatic reversal from the two to three cuts that markets had anticipated as recently as February 2026.
Rising real yields increased the opportunity cost of holding a non-yielding asset. US money market funds attracted record inflows as investors rotated toward yield-bearing instruments, reaching $7.9 trillion in assets. US-listed gold ETFs recorded approximately $5.3 billion in monthly redemptions in June 2026 alone. The US dollar strengthened, and gold underperformed relative to the greenback by approximately 2.6 percentage points against other G10 currencies during the March to June period.
The critical analytical distinction is that this correction was driven by an identifiable, geopolitically-triggered sequence of events, not by any deterioration in the underlying case for gold ownership. State Street's analysis explicitly frames the hawkish Federal Reserve pivot as a tactical headwind that does not alter the post-pandemic structural dynamic.
State Street's Three-Scenario Framework Explained
How Probability-Weighted Modelling Works
Rather than issuing a single directional price target, State Street's research methodology distributes probability across three discrete scenarios. This approach forces analytical discipline: it requires specifying not just where price goes, but under what conditions and with what likelihood. According to State Street's latest quarterly gold commentary, this scenario-based framework is central to how the firm communicates its gold strategy to institutional clients.
| Scenario | Probability | Price Range | Key Conditions |
|---|---|---|---|
| Baseline (Bull) | 70% | $4,750 to $5,500/oz | Structural tailwinds persist; Fed easing begins in 2027 |
| Bear | 25% | $4,000 to $4,750/oz | Fed remains hawkish; dollar stays elevated; real yields persist |
| Tail Risk Support | Small | $3,750 to $4,000/oz | Extreme hawkishness; significant risk-off dollar surge |
| Upside Bull | 5% | $5,500 to $6,250/oz | Rapid Fed pivot; dollar weakness; accelerated central bank buying |
What the 25% Bear Case Actually Requires
Intellectual honesty demands that the bear scenario receives serious consideration. State Street assigns a 25% probability to gold remaining range-bound between $4,000 and $4,750/oz through Q1 2027. This is not a negligible tail risk. It requires:
- Federal Reserve hawkishness persisting well into 2027 without meaningful policy adjustment
- The US dollar maintaining structural elevation against major currencies
- Real yields staying high enough to sustain the opportunity cost premium over gold
- No meaningful resumption of institutional ETF inflows into gold products
Goldman Sachs revised its year-end 2026 gold target down to $4,900/oz in June, citing ETF outflows and the removal of anticipated 2026 rate cuts from its base case. Importantly, Goldman's own modelling quantifies that every 50 basis points of Fed easing delivers approximately $120 per ounce of additional price support for gold. With two to three expected 2026 cuts removed from the market's base case, this represents roughly $240 to $360/oz of deferred price support that shifts into 2027 rather than disappearing entirely.
How the State Street Forecast Compares Across Major Institutions
The 2026 to 2027 Institutional Gold Forecast Landscape
| Institution | Target Price | Target Timeframe |
|---|---|---|
| State Street Investment Management | $5,000/oz baseline; up to $5,500/oz | Q1 2027 |
| Goldman Sachs | $4,900/oz (revised down) | Year-end 2026 |
| J.P. Morgan | $5,400/oz | End-2027 |
| Westpac | $5,000/oz | Q1 2027 |
| Bank of America | Up to $8,000/oz | Extreme upside tail scenario |
The clustering of multiple major institutions around the $5,000 to $5,500/oz range for 2027 is analytically significant. When independently constructed models converge on similar outputs, it reflects shared macro assumptions rather than coordinated positioning. The divergences between institutions, such as Goldman's more conservative near-term view versus J.P. Morgan's gold price analysis pointing to a higher 2027 target, reflect differing assumptions about the Federal Reserve's rate path and the pace of dollar normalisation.
Bank of America's extreme upside scenario of $8,000/oz is explicitly a tail-risk case contingent on a significant deterioration in confidence in fiat monetary systems. It is not a base case and should not be interpreted as one.
How the Fed Rate Mechanism Transmits Into Gold Pricing
Mapping the Policy-to-Price Chain Step by Step
Understanding precisely how Federal Reserve decisions flow through to gold prices helps investors distinguish between tactical noise and structural shifts:
- Federal Reserve rate decision alters the federal funds rate
- Rate change shifts the real yield curve (nominal yields adjusted for inflation expectations)
- Real yield movement changes the opportunity cost of holding non-yielding gold
- Opportunity cost shift drives institutional reallocation between gold ETFs and yield-bearing instruments
- ETF flow changes generate near-term price pressure in either direction
- Structural demand from central banks and physical buyers provides a floor that ETF flows alone cannot fully override
This sequencing explains why gold fell sharply during the mid-2026 period and why the structural case remained intact simultaneously. The tactical pressure came through steps two to five. The structural floor held through step six.
The next major ASX story will hit our subscribers first
Silver's Position Within the Gold Recovery Thesis
High-Beta Amplification and a Sixth Consecutive Supply Deficit
Silver responds to identical macro drivers as gold and then amplifies those moves through an additional industrial demand layer. Approximately 58% of global silver consumption now derives from industrial applications, including solar photovoltaics, electric vehicles, semiconductors, and 5G infrastructure, according to the Silver Institute. This dual monetary-industrial identity gives silver its characteristic high-beta behaviour relative to gold.
| Silver Market Metric | Data |
|---|---|
| Consecutive years of supply deficit | 6 years entering 2026 |
| Projected 2026 supply shortfall | 46.3 million ounces |
| Cumulative above-ground stock drawdown since 2021 | 762 million ounces |
| Industrial share of total demand | ~58% |
| Key industrial end-uses | Solar PV, EVs, semiconductors, 5G |
The gold-silver ratio currently sits near 70:1, approaching the upper boundary of its 50-year historical range of 60 to 70. Historically, when gold recovers toward prior highs, silver has amplified the move in percentage terms due to its high-beta characteristics. Mean reversion in the ratio from 70:1 toward the historical midpoint, combined with gold recovering toward the $5,000 target, implies a materially larger percentage gain for silver than for gold alone over the same period.
The structural setup for silver within a gold recovery scenario is considered by analysts to be among the most compelling in recent years. Silver supply deficits entering a sixth consecutive year, combined with growing industrial demand from electrification and clean energy buildout, and a monetary thesis that tracks directly with State Street's gold analysis collectively build a substantive case. The risk, as always with silver, is that its industrial exposure means a global manufacturing slowdown weighs on it more heavily than on gold, and its higher volatility cuts in both directions.
A Lesser-Known Dynamic: The Deferred Support Mechanism
Why Removed Rate Cuts Don't Disappear, They Relocate
One of the more nuanced analytical points embedded in the institutional gold outlook for 2027 involves understanding the difference between deferred monetary support and eliminated monetary support. When Goldman Sachs removed its expected 2026 rate cuts from its base case following the geopolitical-driven inflation spike, gold bears interpreted this as a permanent removal of price support.
The more accurate framing is that the support moved in time, not in magnitude. Using Goldman's own sensitivity estimate of approximately $120 per ounce per 50 basis points of easing, the two to three cuts that were priced out of 2026 represent between $240 and $360 per ounce of price support that now sits in the 2027 timeline rather than materialising in 2026. The State Street gold forecast $5,000 by Q1 2027 baseline scenario implicitly prices in the eventual realisation of this deferred support as a key driver of the $4,750 to $5,500 recovery range.
This deferred support mechanism is not widely understood by retail investors, who tend to interpret each removed rate cut expectation as a net negative for gold without accounting for the temporal redistribution of that monetary easing into future pricing periods.
Key Takeaways for Investors Evaluating the State Street Gold Forecast
What the $5,000 Target Does and Does Not Mean
- A 70% probability baseline is not a guarantee. It is an assessment that the structural case outweighs tactical headwinds under the most likely set of future conditions
- The 25% bear case carries genuine analytical weight and should inform position sizing and time horizon decisions, not be dismissed
- The correction has not altered the three structural pillars: record global debt, the breakdown of the stock-bond inverse correlation, and sustained sovereign physical demand
- Goldman's $120/oz per 50bps sensitivity estimate provides a framework for quantifying what deferred Fed easing means for the 2027 price outlook
- Silver's gold-silver ratio at 70:1 near the top of its 50-year range suggests larger percentage potential within the same macro recovery thesis
Individual allocation decisions depend on personal risk tolerance, investment time horizon, and the specific role precious metals play within a broader portfolio. The State Street gold forecast $5,000 by Q1 2027, as outlined in the firm's July 2026 Monthly Gold Monitor, provides an analytical framework, not a personalised investment prescription.
Disclaimer: This article is for informational and educational purposes only and does not constitute financial or investment advice. All data sourced from State Street Investment Management Monthly Gold Monitor (July 2026), the Silver Institute, the World Gold Council Gold Mid-Year Outlook 2026, and publicly reported institutional research. Past performance is not indicative of future results. All investment decisions should be made in consultation with a qualified financial adviser.
Want to Identify the Next Major Mineral Discovery Before the Broader Market Does?
While institutional gold forecasts highlight the structural case for precious metals, Discovery Alert's proprietary Discovery IQ model delivers real-time alerts on significant ASX mineral discoveries — instantly translating complex commodity data into actionable opportunities for both traders and long-term investors. Explore historic discoveries and their exceptional returns, then begin your 14-day free trial at Discovery Alert to position yourself ahead of the market.