August 7, 2026
The World's Most Critical Maritime Chokepoint Is Now Barely Functioning
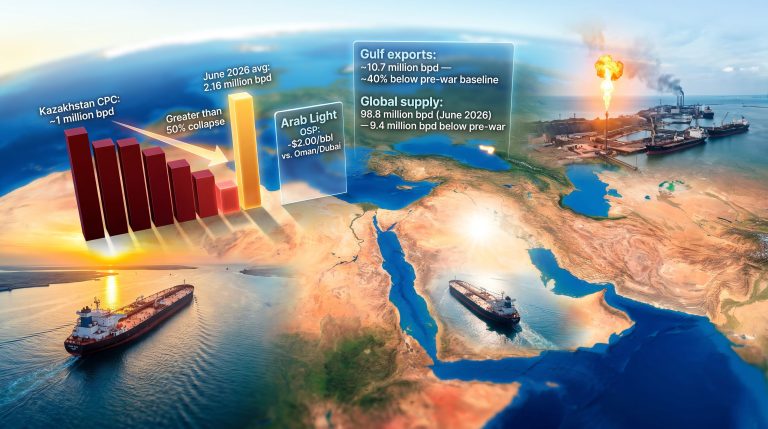
Energy security analysts have long identified maritime chokepoints as the hidden pressure valves of the global economy. When they hold, the world barely notices. When they fail, the consequences cascade across every oil-importing nation, every freight market, and every energy-dependent industry on the planet. No chokepoint carries more systemic weight than the Strait of Hormuz shipping traffic drops after US naval blockade situation unfolding in 2026, and right now, that pressure valve is effectively sealed.
The strait connects the Persian Gulf to the Gulf of Oman, forming a narrow passage roughly 33 kilometres wide at its narrowest navigable point, flanked by Iran to the north and Oman to the south. Before hostilities reshaped the regional landscape in early 2026, this channel carried approximately 20 million barrels of oil per day, representing close to one-fifth of all global oil and gas shipments. No alternative route exists at comparable scale.
The East-West pipeline options within Saudi Arabia, primarily the Petroline and IPSA corridors, offer a combined bypass capacity of roughly 5 million barrels per day, covering only a fraction of normal Hormuz throughput and offering no solution whatsoever for liquefied natural gas exports.
Understanding why the current disruption is so structurally severe requires comparing Hormuz against other major maritime chokepoints.
| Chokepoint | Daily Oil Throughput (Pre-Conflict) | Viable Bypass Route | LNG Dependency |
|---|---|---|---|
| Strait of Hormuz | ~20 million barrels | Very limited (5 mbpd max via pipeline) | Critical, no alternative |
| Suez Canal | ~5.5 million barrels | Cape of Good Hope rerouting viable | Moderate |
| Strait of Malacca | ~16 million barrels | Lombok/Sunda Strait alternatives exist | High but diversifiable |
The comparison is stark. Hormuz stands alone in terms of the combination of throughput volume, absence of meaningful bypass infrastructure, and irreplaceability for LNG trade flows.
When big ASX news breaks, our subscribers know first
How the Conflict Unfolded: An Escalation Timeline
The collapse in Strait of Hormuz shipping traffic did not happen overnight. It followed a sequence of escalating military and political actions that progressively squeezed commercial vessel movements through the waterway.
| Date | Event | Traffic Impact |
|---|---|---|
| February 28, 2026 | U.S. and Israeli military strikes against Iran initiated | Sharp immediate decline in vessel transits |
| April 8, 2026 | Ceasefire announced | Brief partial recovery; throughput remained minimal |
| April 13, 2026 | U.S. CENTCOM declares blockade on ships docking at Iranian ports | 58 commercial vessels redirected; traffic collapses further |
| Late April 2026 | Iran reimposed partial strait closure | Dual-sided restriction compounds the chokepoint crisis |
| July 9, 2026 | Renewed U.S.-Iran strikes; near-total standstill recorded | Only 21 carriers crossed the strait |
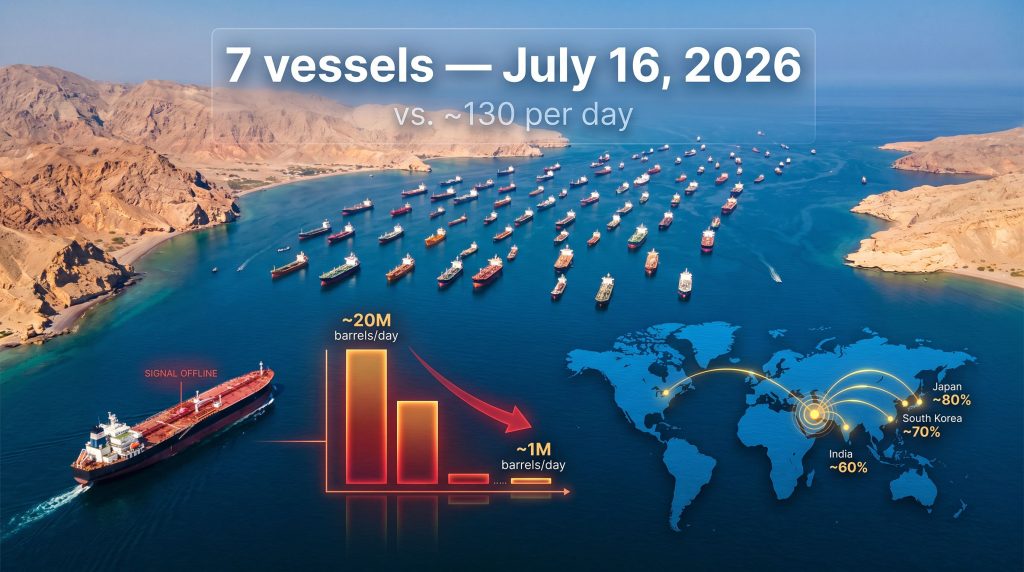
| July 16, 2026 | Seven vessels recorded crossing the strait | Down from 13 the previous day; no VLCCs or LNG tankers |
What makes this sequence particularly significant from an energy market perspective is the compounding nature of the restrictions. The U.S. Central Command blockade operates from one direction, targeting vessels with any commercial connection to Iranian ports. Iran's own closure declaration enforces restriction from the other side. The result is a dual-sided chokepoint squeeze that has no direct historical parallel in terms of its completeness, driving oil market volatility to unprecedented levels.
The Mechanics of the U.S. Naval Blockade
The U.S. CENTCOM blockade, declared on April 13, 2026, differs from a traditional wartime naval blockade in several technical respects. Rather than physically intercepting all vessels attempting transit, the enforcement mechanism operates through a combination of interdiction authority, port access prohibition, and secondary compliance pressure on vessel operators, cargo insurers, and flag state registries. Since the declaration, at least 58 commercial ships have been redirected away from Iranian port destinations.
Vessel operators navigating compliance with the blockade face a complex decision matrix that involves not only immediate route selection but also longer-term reputational and financial exposure. War risk insurance premiums for Gulf transits have surged substantially since April, creating a financial deterrent that operates independently of any direct military threat to individual vessels.
Iran's Asymmetric Leverage: Closing From Within
Iran's ability to declare and partially enforce a strait closure reflects a strategic reality that energy analysts have long flagged as the ultimate vulnerability of the global oil system. Iran does not need to physically block every vessel to create a systemic disruption. The credible threat of minelaying, anti-ship missile deployment, and naval harassment is sufficient to deter commercial operators whose cost of compliance with safety and insurance requirements makes Gulf transit economically unviable.
This asymmetry has been a persistent feature of Iranian strategic doctrine since the 1980s Tanker War, during which both Iran and Iraq targeted commercial vessels in the Gulf, sustaining multi-year energy market volatility through relatively limited direct military action. The current situation is structurally more severe, as the near-complete cessation of VLCC and LNG tanker movements suggests commercial operators are treating the risk as existential rather than merely elevated.
The Traffic Data: What the Numbers Actually Reveal
The scale of the shipping traffic collapse becomes fully apparent only when pre-war baseline figures are placed alongside current operational reality.
| Metric | Pre-War Baseline (February 2026) | Blockade-Era Reality (April-July 2026) |
|---|---|---|
| Daily vessel crossings | ~130 | 1-11 (frequently fewer than 6) |
| Daily oil throughput | ~20 million barrels | ~1 million barrels |
| Throughput as % of normal | 100% | Under 5% |
| Ships stranded in Gulf | Negligible | 600+, including 325 tankers |
| VLCC crossings (July 16) | Multiple daily | Zero |
| LNG tanker crossings (July 16) | Multiple daily | Zero |
Source: Kpler vessel tracking data; MarineTraffic
On July 16, 2026, Kpler data recorded just seven vessels crossing the strait across the full 24-hour period, down from 13 the previous day. Of those seven, four were empty vessels entering the Gulf: three small oil tankers and a single dry bulk carrier intended for grain loading. The three vessels exiting the strait carried liquefied petroleum gas, coal, and fuel oil. Not a single Very Large Crude Carrier or LNG tanker was among them.
The complete absence of VLCC and LNG tanker movements on July 16 is not merely a data point. It represents the functional shutdown of the two highest-value cargo categories that the strait was built to facilitate. These are the vessels that move the oil quantities that matter to importing nations.
The AIS Transponder Deactivation Signal
One of the most technically revealing data points from the week of July 14-16 was the observation by Kpler that a Suezmax tanker carrying approximately 1 million barrels of Saudi crude exited the strait on July 15 with its Automatic Identification System transponder switched off.
AIS transponder deactivation is a practice with well-understood implications in maritime risk analysis. Vessels are required under international maritime law to broadcast their position, identity, and course via AIS. Deactivation in conflict or sanctions-affected zones is a recognised evasion tactic used when operators wish to avoid detection, whether to circumvent sanctions monitoring, evade interdiction, or navigate contested waters without broadcasting their cargo identity to all parties in a conflict zone.
For cargo insurers, port authorities, and sanctions compliance teams, a transponder-dark vessel carrying 1 million barrels of Gulf crude is an immediate red flag that elevates counterparty risk, complicates chain-of-custody documentation, and potentially triggers sanctions screening obligations at the vessel's next port of call.
The 600-Ship Backlog: A Floating Supply Chain Crisis
Beyond the daily vessel crossing statistics lies a less-visible but equally significant dimension of the disruption: more than 600 commercial vessels, including approximately 325 tankers, are currently stranded inside the Gulf awaiting safe passage clearance. This floating backlog represents:
- Accumulated demurrage costs that are eroding the financial viability of extended wait strategies for vessel operators
- Cargo insurance complications as policies designed for normal transit timeframes are stretched beyond their intended scope
- Force majeure disputes between cargo owners and shipping counterparties as contracted delivery windows are missed
- Port congestion at Gulf terminals as berth occupancy rates remain elevated by vessels unable to complete loading or discharge cycles
The backlog also creates a secondary supply shock dynamic. When and if the strait does partially reopen, the release of 325 stranded tankers simultaneously into the seaborne crude market could create short-term price suppression even within a broader supply-constrained environment — an outcome that would complicate the price signals energy markets depend on for investment and production decisions.
Supply Shock Magnitude: Comparing Historical Disruptions
The scale of the effective supply removal from global oil markets places this disruption in a category that has no precise precedent. Daily throughput via the strait has fallen from approximately 20 million barrels to roughly 1 million barrels, representing a reduction of approximately 95% from pre-war baseline levels. Furthermore, the associated oil price shock is reverberating across every energy-dependent economy.
| Historical Disruption | Estimated Supply Removed | Duration | Brent Price Impact |
|---|---|---|---|
| 1973 Arab Oil Embargo | ~5 million barrels/day | ~6 months | Price quadrupled |
| 1979 Iranian Revolution | ~5.6 million barrels/day | ~12 months | Price doubled |
| 1990-91 Gulf War | ~4.3 million barrels/day | ~6 months | Price spike then stabilised |
| 2019 Abqaiq Attacks | ~5.7 million barrels/day (temporary) | ~2 weeks | Temporary spike, recovered quickly |
| 2026 Hormuz Blockade | ~19 million barrels/day | Ongoing | Severe and sustained volatility |
Note: Historical comparisons are indicative. All figures represent approximate estimates from publicly available energy research sources.
The 2026 disruption dwarfs every prior oil supply shock in recorded history in terms of the daily volume of supply effectively removed from global seaborne markets. Strategic petroleum reserve releases by consuming nations can moderate short-term price spikes but cannot substitute for sustained production at this scale. OPEC+ spare capacity, estimated at approximately 3-5 million barrels per day across all member states in 2025-2026, covers less than a quarter of the disrupted volume. In addition, OPEC's market influence is being severely tested by the sheer scale of this interruption.
Which Nations Bear the Greatest Exposure
The downstream consequences of the disruption are not evenly distributed. Nations with the highest dependence on Hormuz-routed crude imports face the most acute pressure.
| Region / Country | Hormuz Dependency | Exposure Level |
|---|---|---|
| Japan | ~80% of crude imports via Hormuz | Critical |
| South Korea | ~70% of crude imports via Hormuz | Critical |
| India | ~60% of crude imports via Hormuz | Very High |
| China | ~40% of crude imports via Hormuz | High |
| Europe | Indirect via LNG and spot markets | Moderate to High |
| United States | Domestic production buffer | Lower but not immune |
India's position deserves particular attention given its scale of exposure combined with its relatively limited ability to rapidly diversify supply sources at short notice. With approximately 60% of its crude imports transiting via Hormuz, India faces structural supply pressure that strategic reserve drawdowns can only partially and temporarily address.
Rerouting Realities: Why Alternatives Fall Short
Step-by-Step: How a Tanker Operator Navigates the Current Crisis
- Risk assessment: The operator evaluates current Kpler and MarineTraffic AIS data, CENTCOM blockade advisories, and applicable war risk insurance terms for Gulf transit
- Route modelling: Alternative routing via the Cape of Good Hope adds approximately 15-20 additional transit days and materially increases fuel and operating costs per voyage
- Insurance renegotiation: War risk premiums for the Gulf region have surged since April 2026, with some underwriters declining coverage entirely for Hormuz-linked routes
- Cargo owner notification: Force majeure clauses are activated for contracts with delivery obligations contingent on Hormuz transit within specified timeframes
- Port coordination: Fujairah and Oman-based terminal options are evaluated as interim discharge points where operationally viable, though capacity constraints limit their effectiveness at scale
- Regulatory compliance verification: Operators confirm compliance with CENTCOM blockade directives to avoid vessel interdiction before committing to any Gulf entry
The Saudi Arabia Petroline and IPSA pipeline systems offer a partial bypass, moving crude from the Eastern Province to Red Sea export terminals at Yanbu. However, their combined operational capacity of approximately 5 million barrels per day represents only a fraction of normal Hormuz throughput. Furthermore, LNG supply constraints remain entirely unresolvable via these overland alternatives, as LNG exports have no viable pipeline substitute at scale.
Scenario Modelling: Three Pathways Forward
Scenario A: Rapid Diplomatic Resolution (Low Probability)
A ceasefire holds and the U.S. blockade is formally lifted within 30-60 days. Traffic recovery to 50% of pre-war levels might be achievable within 90 days, but shipping insurance markets and vessel operator confidence would require considerably longer to normalise. Oil prices would stabilise at elevated levels rather than returning to pre-conflict baselines due to the persistent supply chain confidence deficit.
Scenario B: Prolonged Partial Reopening (Base Case)
Intermittent ceasefire periods allow limited commercial traffic through the strait. Monthly vessel crossings remain well below pre-war norms for a period of 6-12 months. Structural rerouting investments accelerate, including expanded use of Saudi pipeline bypass capacity and Cape of Good Hope routing for crude tankers. The LNG spot market remains severely constrained throughout this period, with no viable bypass infrastructure capable of absorbing redirected volumes.
Scenario C: Extended Closure and Escalation (Tail Risk)
The conflict broadens to involve additional regional actors, maintaining effective closure of the strait for more than 12 months. Global recession risk becomes elevated as energy cost inflation transmits through manufacturing, transport, and consumer prices across import-dependent economies. Strategic petroleum reserve depletion in Japan, South Korea, and India accelerates to unsustainable rates. Permanent rerouting infrastructure investment is triggered across Gulf producer states, fundamentally restructuring the global energy trade map over a multi-year horizon.
Historical precedent from the 1980s Tanker War demonstrates that even partial and intermittent Hormuz disruptions can sustain multi-year energy market volatility. The current disruption is categorically more severe, given the near-total cessation of the two highest-value cargo classes and a dual-sided enforcement regime with no direct historical parallel.
The next major ASX story will hit our subscribers first
Long-Term Structural Consequences for Global Energy Supply Chains
Accelerating Post-Hormuz Infrastructure Investment
One underappreciated dimension of the current disruption is its likely catalytic effect on energy infrastructure investment across Gulf producer states and major consuming nations. The vulnerability exposed by near-total Hormuz dependence has been well understood in academic and policy circles for decades, but the commercial incentive to act on that knowledge has historically been insufficient when the strait was functioning normally.
That calculus has now fundamentally shifted. The disruption is forcing Gulf producers to fast-track overland pipeline expansion projects, terminal capacity increases at Red Sea and Mediterranean export facilities, and longer-term investments in LNG liquefaction capacity positioned outside the Gulf's geographic exposure zone.
The Confidence Deficit That Will Outlast the Conflict
Even when some form of resolution allows commercial traffic to resume, energy markets face a structural confidence deficit that will persist for years. Shipping insurance markets are not episodic in their risk pricing. War risk premium increases tend to be sticky, reflecting underwriter assessments of structural rather than temporary risk elevation. Vessel operators who have invested in Cape of Good Hope routing capabilities will not abandon them the moment a ceasefire is announced.
Major energy importing nations, particularly in Asia, are accelerating strategic diversification efforts away from Hormuz-dependent supply sources. This represents a structural demand shift for Middle Eastern producers that may prove more consequential over a decade than the immediate supply shock of the blockade period itself.
Geopolitical Precedent: Maritime Interdiction as a Policy Instrument
The use of a formal naval blockade as a geopolitical pressure instrument against a major oil-producing nation sets a significant precedent for how maritime interdiction may be deployed in future resource and security conflicts. Consequently, the broader geopolitical oil price factors at play here extend well beyond the immediate conflict zone.
Gulf Cooperation Council member states are now navigating an extraordinarily difficult position: their export economics depend on Hormuz functionality, yet their security relationships create complex obligations that constrain their public positioning on the blockade.
The long-term implications for the global LNG market architecture are particularly significant. If Hormuz reliability is structurally compromised even at the level of elevated insurance premiums and reduced confidence, the investment calculus for new LNG liquefaction projects in the Gulf region versus alternative export geographies will shift materially in favour of non-Gulf locations including East Africa, the Eastern Mediterranean, and North American export terminals.
Disclaimer: This article contains forward-looking analysis, scenario modelling, and market projections based on publicly available data as of July 2026. All scenarios represent analytical perspectives only and should not be construed as financial advice. Energy market forecasts involve inherent uncertainty. Readers should consult qualified financial and energy advisors before making investment or procurement decisions based on the information contained herein. Historical comparisons are indicative and approximate. Vessel tracking data referenced is attributed to Kpler and MarineTraffic.
Want to Stay Ahead of the Resource Discoveries That Emerge From Global Energy Disruptions?
Major geopolitical shocks like the Hormuz blockade reshape commodity demand across dozens of sectors simultaneously, creating windows for significant mineral discovery opportunities on the ASX. Discovery Alert's proprietary Discovery IQ model scans ASX announcements in real time, instantly identifying high-potential discoveries across more than 30 commodities — and with historic examples demonstrating the exceptional returns major discoveries can generate, subscribers can begin a 14-day free trial today to position themselves ahead of the broader market.