July 21, 2026

Global energy markets operate on interconnected networks of supply chains where single chokepoints can trigger cascading disruptions across continents. The strategic positioning of narrow maritime passages creates systemic vulnerabilities that extend far beyond regional boundaries, affecting everything from manufacturing costs in Asia to heating bills in Europe. Understanding these dependencies requires examining not just the physical infrastructure, but the complex web of economic relationships that make certain waterways indispensable to modern civilisation. The potential for a Strait of Hormuz closure represents one of the most significant risks to global energy security, with implications that extend far beyond regional conflicts.
Understanding the Strait of Hormuz: Why This 21-Mile Waterway Controls Global Energy Markets
The Strait of Hormuz represents the world's most critical energy chokepoint, where geographic constraints create unprecedented leverage over global commerce. At its narrowest point, this strategic waterway measures just 21 nautical miles wide, with shipping lanes compressed to merely 2 nautical miles in each direction, separated by a median line according to U.S. Energy Information Administration specifications. These confined waters accommodate heavily laden tankers navigating depths ranging from 100 to 300 feet, creating natural bottlenecks that amplify any disruption.
Geographic Chokepoint Analysis
The strait's strategic positioning between Iran and Oman creates a singular gateway connecting the Persian Gulf to the Gulf of Oman and Arabian Sea. This geographic reality means that oil exports from all Gulf Cooperation Council states must traverse these narrow waters, with no viable maritime alternatives for the majority of crude shipments.
Alternative routing analysis reveals the stark limitations facing energy exporters. The Cape of Good Hope route adds approximately 6,000 nautical miles and 15-20 days transit time compared to direct Hormuz passage. The Suez Canal alternative extends voyages by roughly 4,000 nautical miles and 10-14 days, while imposing canal toll costs of approximately $500,000-$1 million per large tanker.
| Route Option | Additional Distance | Extra Transit Time | Major Constraints |
|---|---|---|---|
| Cape of Good Hope | +6,000 nautical miles | +15-20 days | Weather, fuel costs |
| Suez Canal | +4,000 nautical miles | +10-14 days | Canal fees, size limits |
| Pipeline Bypass | N/A | N/A | Limited to 3.5 million b/d total capacity |
Historical Precedents and Closure Patterns
The 1980-1988 Iran-Iraq War's "Tanker War" phase provides the most relevant historical precedent for Strait of Hormuz closure scenarios. During this period, Iranian and Iraqi forces attacked over 500 commercial vessels in the Persian Gulf, though the strait remained technically navigable with dramatically elevated insurance premiums and operational risks. Military activity created de facto restrictions rather than complete closure, offering insights into how modern conflicts might unfold.
Economic recovery patterns from historical disruptions indicate that wholesale market impacts occur within hours, whilst retail market effects typically manifest over 5-14 days depending on regional distribution systems. The restoration of normal shipping operations has historically required 2-4 weeks following conflict resolution, with insurance premiums returning to baseline levels over 3-6 months.
When big ASX news breaks, our subscribers know first
How Much Global Energy Flows Through the Strait of Hormuz?
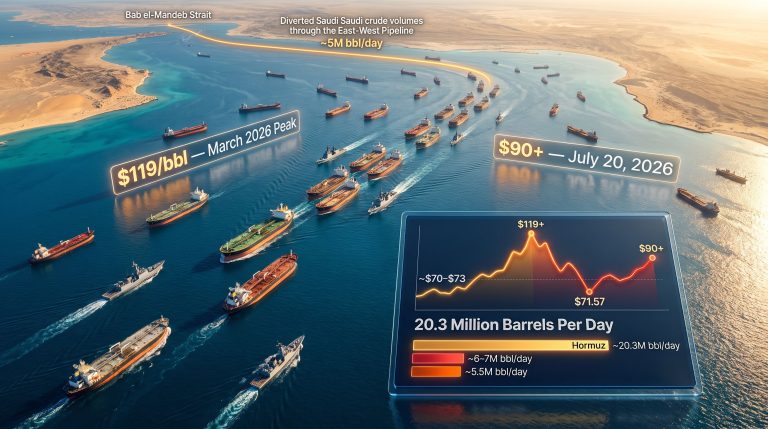
Daily energy transit through the Strait of Hormuz represents approximately 21 million barrels of crude oil, constituting 21% of global petroleum supply according to current flow analysis. This volume translates to roughly 7.7 billion barrels annually, making any disruption an immediate global concern. The concentration of energy flows through this single passage creates systemic risk that no alternative infrastructure can fully compensate for in the short term.
Furthermore, the oil price rally analysis demonstrates how geopolitical tensions in critical chokepoints directly influence global commodity markets.
Oil Transit Volume Breakdown
Regional export dependencies reveal the disproportionate reliance on Hormuz transit amongst major oil producers:
- Saudi Arabia: 9-10 million barrels per day via Hormuz, with East-West Pipeline providing limited 5-7 million b/d bypass capacity
- UAE: 2.5-3.0 million barrels per day, with Fujairah Terminal offering 1.5 million b/d alternative routing
- Kuwait: 2.5-3.0 million barrels per day with no major bypass infrastructure
- Qatar: LNG equivalent of 0.6-0.7 million barrels per day of oil equivalent
Seasonal variation patterns create additional complexity in supply chain planning. Summer cooling demand increases LNG requirements in Asia-Pacific markets by 15-20%, creating peak vulnerability periods when alternative supplies become even more critical. Monsoon season effects in the Arabian Sea further constrain alternative routing options during specific months.
Natural Gas and LNG Dependencies
Liquefied natural gas flows through the Strait of Hormuz account for approximately 20% of global LNG trade, with Qatar serving as the primary source for Asian markets. The majority of LNG cargo destined for Asia-Pacific regions must transit through these waters before proceeding to secondary shipping routes, creating direct linkage between Strait access and Asian energy security.
Qatar's position as the world's largest LNG exporter means that any Strait of Hormuz closure immediately affects natural gas supplies to Japan, South Korea, China, and India. These nations depend on consistent LNG deliveries for power generation, industrial processes, and residential heating, making supply interruptions economically disruptive beyond simple price effects.
What Are the Immediate Economic Consequences of a Strait Closure?
Market data from March 20, 2026, reveals commodity prices already reflecting significant geopolitical premium: WTI crude trading at $96.50 per barrel and Brent crude at $108.56 per barrel. Natural gas prices at $3.05 per MMBtu indicate regional variations in supply security perceptions. These baseline prices suggest markets are already pricing substantial risk premiums related to potential Strait of Hormuz closure scenarios.
Energy Price Shock Scenarios
Historical analysis of chokepoint disruptions indicates oil price spikes of $20-40 per barrel occur within 24-48 hours of closure events. Current price levels suggest either existing disruption effects or market anticipation of imminent closure. Natural gas price transmission varies by region, with Asian LNG spot prices typically experiencing 50-100% increases during Middle Eastern supply disruptions.
In addition, the tariff market impact compounds these energy price effects, creating multiplied economic pressures across global markets.
Refined product premiums typically exceed crude oil premiums by $15-25 per barrel during severe disruptions due to refinery bottlenecks and transportation constraints. Gasoline and diesel markets experience amplified volatility as storage limitations create local shortages even when crude supplies remain theoretically available.
Strategic Petroleum Reserve Response Mechanisms
The International Energy Agency's March 11, 2026 announcement that 32 member countries unanimously agreed to release 400 million barrels from emergency reserves represents unprecedented coordinated intervention. IEA Executive Director Fatih Birol characterised the situation as presenting oil market challenges that are unprecedented in scale, requiring emergency collective action of unprecedented size.
Initial reserve releases began flowing to markets by March 19, 2026, according to IEA statements, indicating real-time intervention rather than theoretical response planning. This rapid deployment demonstrates the severity of current market conditions and the coordinated international concern about supply security.
| Reserve System | Capacity | Deployment Speed | Market Impact |
|---|---|---|---|
| IEA Coordinated Release | 400 million barrels | Days to weeks | Moderates 5-15% of price spike |
| U.S. Strategic Petroleum Reserve | 600+ million barrels | 1-2 weeks | Significant but limited duration |
| Producer Nation Spare Capacity | Variable | 2-4 weeks | Subject to technical constraints |
Which Countries Face the Greatest Economic Vulnerability?
Import-dependent nations face asymmetric vulnerability during Strait of Hormuz closure events, with Asian economies experiencing disproportionate impacts due to geographic constraints and limited alternative supply sources. Economic dependency extends beyond simple import percentages to encompass manufacturing competitiveness, currency stability, and social stability factors.
Import-Dependent Nations Risk Assessment
Japan's Strategic Vulnerability
Japan's 85% reliance on Middle Eastern oil via Hormuz creates immediate economic pressure during disruptions. As the world's third-largest economy with limited domestic energy resources, Japan lacks strategic geographic alternatives for crude imports. Petrochemical-dependent manufacturing sectors representing 8-10% of industrial output face direct cost pressures that cascade through automotive, electronics, and specialty chemical exports.
South Korea's Integrated Risk Profile
South Korea's 70% oil import dependency via Hormuz combines with 45% natural gas reliance on Middle Eastern LNG to create dual vulnerability. Heavy industries including shipbuilding, automotive, and semiconductor manufacturing depend on stable energy costs for global competitiveness. LNG supply disruptions particularly affect power generation and industrial heating applications with limited short-term substitution options.
India's Emerging Economy Exposure
India's 60% oil import dependency via Hormuz intersects with 5-7% annual energy demand growth to create compounding vulnerability. With 1.4 billion residents, even modest supply disruptions trigger immediate economic and social pressures. Indian refineries processing additional Middle Eastern crude for export create multiplier effects where disruptions affect both domestic consumption and export revenue streams.
China's Diversification Advantage
China's 40% import dependency via Hormuz reflects successful supply diversification through Central Asian pipelines providing 15-20% of imports and Russian pipeline supplies offering additional alternatives. Substantial strategic petroleum reserves with continued expansion provide buffer capacity that smaller economies cannot match.
Gulf Producer Nations Economic Calculations
Regional oil exporters maintain varying degrees of bypass infrastructure that determines their vulnerability to Strait disruptions:
- Saudi Arabia's East-West Pipeline: 5-7 million barrels per day capacity connecting Red Sea export terminals, providing substantial but incomplete bypass options
- UAE's Fujairah Infrastructure: 1.5 million barrels per day transloading capacity offers limited alternative routing for Emirati exports
- Kuwait's Complete Dependency: No major pipeline bypass or alternative terminal infrastructure leaves Kuwait entirely Strait-dependent
- Qatar's LNG Flexibility: Liquefied natural gas vessels can utilise longer alternative routes, though with significantly increased transportation costs
International leaders have acknowledged that the effects of current Middle Eastern conflicts will be felt by people in all parts of the world, especially the most vulnerable populations in developing nations. Commitments to work with International Financial Institutions to provide support for affected nations indicate recognition of asymmetric economic impacts across different development levels.
How Do Alternative Transportation Routes Compare?
Existing bypass infrastructure provides only 3.5 million barrels per day of alternative transportation capacity, representing merely 16.7% of normal Hormuz transit volumes. This massive 83% capacity shortfall means that alternative routes cannot substitute for Strait closure, but rather serve as partial mitigation measures during extended disruptions.
Existing Pipeline Infrastructure Assessment
Saudi Arabia's East-West Pipeline represents the largest single bypass option at 5-7 million barrels per day capacity. This infrastructure connects eastern production facilities to Red Sea export terminals, allowing substantial crude volumes to reach global markets without Hormuz transit. However, even this significant capacity addresses only 25-35% of normal Saudi exports through the Strait.
The UAE's pipeline to Fujairah Terminal provides 1.5 million barrels per day of bypass capacity, though this represents less than half of typical UAE exports via Hormuz. Geographic limitations prevent significant expansion of existing pipeline infrastructure due to terrain constraints and capital requirements exceeding $10-15 billion for major new pipeline systems.
Maritime Detour Analysis
Cape of Good Hope routing creates fundamental economic challenges that extend beyond simple distance considerations. Extended voyages increase fuel consumption by 40-50% whilst reducing effective global tanker capacity by 50-60% due to longer transit times. Insurance premiums multiply 10-20 times during crisis periods, adding $2-5 million to typical cargo delivery costs.
Suez Canal detours offer shorter alternative routing but impose canal fees approaching $1 million per large tanker along with size restrictions that prevent Very Large Crude Carriers from utilising this route. Transit time increases of 10-14 days still significantly reduce effective global shipping capacity and increase inventory financing costs for importers.
| Route Comparison | Distance | Transit Time | Additional Costs | Capacity Constraints |
|---|---|---|---|---|
| Hormuz Direct | 7,000 nm to Europe | 25-30 days | Baseline | None |
| Cape of Good Hope | 13,000 nm to Europe | 45-50 days | 40-50% fuel increase | Weather delays |
| Suez Canal | 11,000 nm to Europe | 35-40 days | $500K-$1M canal fees | Size restrictions |
What Military and Geopolitical Factors Drive Closure Scenarios?
International condemnation of recent attacks on unarmed commercial vessels in the Gulf reflects the escalating nature of current tensions. UN Security Council Resolution 2817 provides the legal framework demanding cessation of threats, mine-laying activities, drone and missile attacks, and other attempts to block commercial shipping access to the Strait.
Iran's Strategic Leverage Calculations
Iran's asymmetric warfare capabilities in narrow waterways include demonstrated mine-laying technologies that require specialised mine-countermeasure vessels for clearance operations. The deployment of naval mines creates persistent hazards that continue threatening commercial navigation even after active hostilities cease, extending disruption periods beyond immediate conflict duration.
Regional proxy networks provide Iran with multiple escalation options that can expand conflict beyond direct Strait confrontation. Attacks on civilian infrastructure including oil and gas installations demonstrate capability to disrupt energy production at source facilities rather than only transportation chokepoints.
International Naval Response Protocols
World leaders have expressed readiness to contribute to appropriate efforts to ensure safe passage through the Strait whilst welcoming preparatory planning commitments from various nations. This coordinated response framework indicates substantial international naval capabilities available for Strait reopening operations, though specific deployment timelines remain classified.
However, the US–China trade impact further complicates international coordination efforts, as competing economic interests may influence naval deployment decisions.
Coalition maritime security frameworks built during previous Middle Eastern conflicts provide operational templates for mine-clearing operations, convoy escort protocols, and air defence coverage. Historical precedents suggest 2-4 week timelines for clearing simple mine deployments, though sophisticated mine systems could extend clearance operations significantly.
The next major ASX story will hit our subscribers first
How Do Global Supply Chains Adapt to Hormuz Disruptions?
Manufacturing supply chains dependent on petrochemical feedstocks experience cascading disruptions that extend far beyond energy sectors. South Korean exports of approximately $50 billion annually in petrochemical derivatives face immediate feedstock supply constraints during Strait closures, affecting global automotive parts, electronics, and specialty chemical availability.
Port Infrastructure Stress Testing
Alternative port facilities face immediate capacity constraints when normal Hormuz transit redirects to longer routes. Red Sea terminals handling Saudi East-West Pipeline exports operate near design capacity during normal conditions, creating bottlenecks when emergency bypass operations commence. Fujairah Terminal's 1.5 million barrel per day capacity cannot absorb additional UAE export volumes beyond designed throughput levels.
Storage infrastructure at alternative terminals lacks sufficient inventory capacity to buffer supply chain disruptions. Tank farm limitations at bypass facilities create immediate bottlenecks when large crude volumes require temporary storage during vessel scheduling delays. These physical constraints prevent smooth substitution of alternative routes for normal Hormuz operations.
Industrial Sector Vulnerability Mapping
Indian refineries in Gujarat and Tamil Nadu processing 3 million barrels daily of Middle Eastern crude face inventory pressure within 20-30 days of Strait closure. Refinery residence times and crude logistics create inflexible operating windows where alternative supply arrangements must activate quickly to prevent production disruptions.
Petrochemical manufacturing complexes integrated with refining operations experience multiplicative effects during crude supply disruptions. Feedstock availability affects production of plastics, synthetic fibres, and specialty chemicals that support automotive, textile, and consumer goods industries globally.
What Long-Term Market Transformations Result from Closure Events?
Energy security strategies investment patterns accelerate dramatically following major chokepoint disruptions as governments and corporations recognise strategic vulnerability. Historical precedents indicate 25-50% increases in strategic reserve expansion programmes within 2-3 years of major supply disruptions, reflecting policy emphasis on buffer capacity rather than efficiency optimisation.
Energy Security Investment Acceleration
Strategic petroleum reserve expansion programmes receive priority funding during post-disruption periods as nations recognise the inadequacy of existing buffer stocks. China's continued reserve expansion objectives exemplify this trend, with developing economies particularly focused on achieving 90-120 day import coverage through strategic stockpiles.
Renewable energy adoption timeline acceleration occurs as energy security concerns override pure economic optimisation in policy planning. Solar and wind capacity additions typically increase 15-25% above baseline projections following major fossil fuel supply disruptions, driven by strategic independence objectives rather than cost competitiveness alone.
Geopolitical Realignment Patterns
Regional alliance structures evolve significantly following major energy chokepoint disruptions as nations reassess supply security relationships. Energy importers develop stronger bilateral relationships with alternative suppliers, often including military cooperation agreements and infrastructure investment commitments.
Trade route diversification strategies reshape global logistics networks as companies build redundancy into supply chain planning. Investment flows redirect toward alternative energy infrastructure, pipeline development, and strategic storage capacity in response to demonstrated chokepoint vulnerabilities.
How Can Investors and Businesses Prepare for Hormuz Risk?
Energy sector exposure assessment requires examining both direct investments in oil and gas companies and indirect exposure through energy-intensive industries. Manufacturing companies with significant energy input costs experience margin compression during price spike periods, whilst energy producers may benefit from higher commodity prices offset by operational disruptions.
Portfolio Risk Management Strategies
Geographic diversification principles suggest avoiding concentration in single-region energy suppliers or energy-intensive industries dependent on Middle Eastern supply chains. Investment portfolios balanced across different energy sources, supplier regions, and industrial sectors provide greater resilience during chokepoint disruption events.
Hedging instrument utilisation through energy derivatives, currency hedging, and supply chain insurance provides tactical protection against short-term disruption impacts. Options strategies, futures contracts, and swap agreements offer mechanisms to limit downside exposure whilst maintaining upside participation in normal market conditions.
Supply Chain Resilience Building
Inventory buffer optimisation involves analysing the cost-benefit relationship between carrying additional inventory and accepting supply disruption risk. Companies with 60-90 day inventory buffers typically navigate short-term disruptions more effectively than just-in-time operations, though carrying costs must be balanced against disruption probability.
Alternative sourcing contingency planning requires pre-negotiated supply agreements, qualified supplier networks, and transportation logistics capable of rapid activation. Companies that establish backup supply relationships during normal conditions can access alternative sources more quickly when primary supply chains fail.
What Does Historical Data Reveal About Recovery Timelines?
Market normalisation patterns following chokepoint disruptions typically require 3-6 months for price volatility to return to baseline levels, though physical supply chain restoration occurs more rapidly. Wholesale markets adjust within days to weeks once shipping resumes, whilst retail markets lag by additional 2-4 weeks depending on regional distribution efficiency.
Market Normalisation Patterns
Price volatility duration analysis indicates that commodity markets experience elevated volatility for 90-180 days following major supply disruptions, even after physical supply restoration. Risk premiums embedded in energy prices decline gradually as market confidence rebuilds and alternative supply sources prove reliable.
Shipping route restoration follows predictable sequences where larger vessels resume operations first due to better navigation equipment and insurance coverage, followed by smaller vessels as maritime security conditions normalise. Insurance premium reductions typically lag physical route reopening by 30-60 days as underwriters assess residual risk levels.
Structural Market Changes Post-Disruption
Permanent supply chain modifications occur as companies implement lessons learned during disruption periods. Investment flows redirect toward bypass infrastructure, alternative energy sources, and strategic storage capacity that provide long-term supply security benefits beyond immediate disruption response.
Strategic partnership evolution includes deeper integration between energy importers and alternative suppliers, often involving equity investments, infrastructure development commitments, and long-term purchase agreements that restructure global energy trade patterns permanently.
Building Economic Resilience Against Chokepoint Vulnerabilities
National energy security framework development requires coordinated policy approaches that balance economic efficiency with supply security objectives. Countries with successful diversification strategies typically implement 10-15 year planning horizons that gradually reduce chokepoint dependencies whilst maintaining competitive energy costs.
National Energy Security Framework Development
Diversification strategy implementation involves systematic reduction of single-source supply dependencies through alternative supplier development, strategic reserve expansion, and renewable energy capacity building. Effective frameworks establish target percentages for supply source distribution and timeline milestones for dependency reduction.
International cooperation enhancement includes bilateral energy security agreements, coordinated strategic reserve policies, and shared emergency response protocols. Multilateral frameworks like the IEA emergency release mechanism demonstrate the effectiveness of coordinated response systems during actual disruption events.
Furthermore, the OPEC production outlook influences how nations develop their strategic reserves and alternative supply arrangements.
Private Sector Adaptation Strategies
Risk assessment methodology improvement requires incorporating chokepoint vulnerability analysis into standard business planning processes. Companies that regularly stress-test operations against supply disruption scenarios develop more robust contingency capabilities and maintain competitive advantages during actual disruption events.
Technology solution development includes advanced inventory management systems, supply chain visibility platforms, and alternative sourcing algorithms that enable rapid response to supply disruptions. Investment in these capabilities provides long-term operational resilience beyond immediate crisis response benefits.
Critical Analysis Framework: The Strait of Hormuz closure scenario demonstrates how geographic constraints create systemic vulnerabilities in global energy markets. Whilst alternative routes and bypass infrastructure provide partial mitigation, no combination of existing options can fully substitute for normal Strait operations. Understanding these limitations enables more effective risk management and strategic planning across all economic sectors dependent on Middle Eastern energy supplies.
Consequently, analysis from the Brookings Institution emphasises that disruption of the Strait represents more than a regional security issue, but rather a fundamental challenge to global economic stability requiring coordinated international response mechanisms.
Disclaimer: This analysis is based on publicly available information and historical precedents. Actual market conditions, geopolitical developments, and supply chain responses may vary significantly from projected scenarios. Investors and businesses should conduct independent risk assessments and consult with qualified advisers before making strategic decisions based on chokepoint vulnerability analysis.
Concerned About Energy Supply Chain Vulnerabilities Affecting Your Investment Portfolio?
Discovery Alert's proprietary Discovery IQ model delivers real-time alerts on significant ASX mineral discoveries, including critical energy transition metals that could provide portfolio diversification during geopolitical supply disruptions. Understand why historic discoveries can generate substantial returns by exploring how major mineral finds have delivered exceptional outcomes for early investors, then begin your 14-day free trial today to position yourself ahead of market volatility.