May 22, 2026
The Energy Corridor That Could Redraw the Global Economy
Every few decades, a single geographic bottleneck becomes the focal point of the entire global energy system. The English Channel shaped European trade for centuries. The Suez Canal rewired Mediterranean commerce after 1869. Today, a narrow strip of water barely 33 kilometres across at its most navigable point holds more economic leverage than any other physical location on Earth.
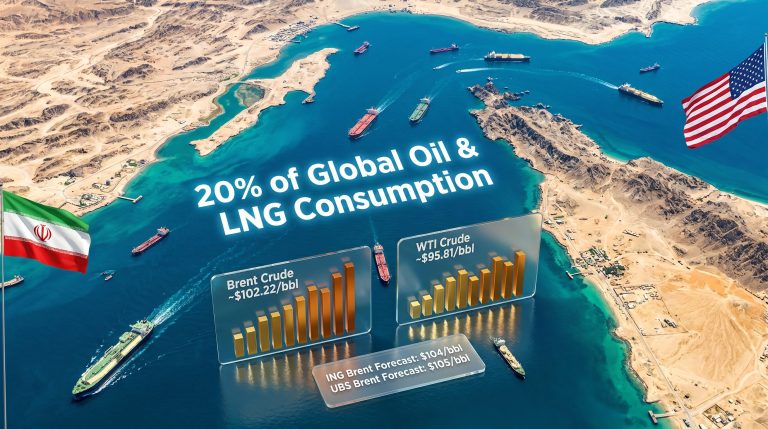
The Strait of Hormuz connects the Persian Gulf to the Gulf of Oman, and through it flows roughly one-fifth of all oil traded globally every single day. When geopolitical conditions are stable, this corridor operates invisibly, an unremarkable passage that keeps the world's industrial machinery running. When stability fractures, Strait of Hormuz closure oil prices become the defining variable in global energy pricing, inflation forecasting, and sovereign fiscal planning across dozens of nations simultaneously.
Understanding how a Strait of Hormuz closure would affect oil prices requires moving beyond simple supply-demand arithmetic. The real analytical challenge is probabilistic: mapping non-linear price outcomes across multiple closure duration scenarios, then weighing those outcomes against current market positioning, spare capacity buffers, and the second-order economic consequences that cascade far beyond the oil barrel itself.
When big ASX news breaks, our subscribers know first
Why No Alternative Can Replace This Corridor at Scale
The Physical and Strategic Architecture of the Strait
The Strait of Hormuz sits between Iran to the north and Oman and the United Arab Emirates to the south. Its navigable shipping lanes are narrower than most people appreciate, with inbound and outbound vessel traffic each confined to corridors of roughly three kilometres in width. This physical constraint means traffic management under normal conditions already operates near capacity.
The volumes transiting this passage are staggering:
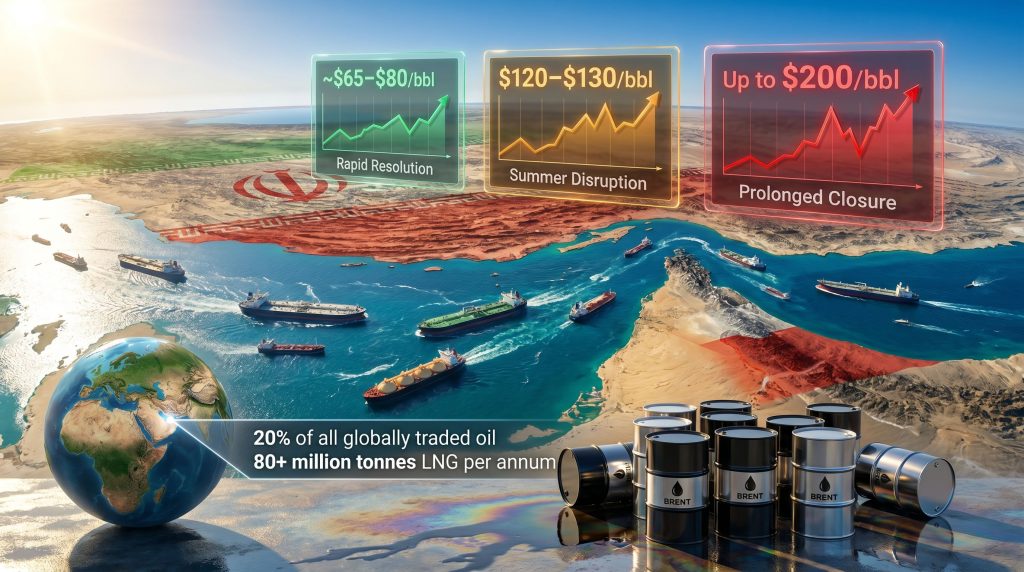
- Approximately 20% of all globally traded oil moves through the Strait daily
- Over 80 million tonnes per annum of liquefied natural gas passes through, representing roughly 20% of total global LNG supply
- More than 11 million barrels per day (mb/d) of Gulf crude and condensate production has been curtailed under active disruption conditions following the outbreak of conflict involving Iran in early 2026
- The corridor services the export infrastructure of Saudi Arabia, Iraq, Kuwait, the UAE, Qatar, and Iran itself
Two partial bypass alternatives exist but fall dramatically short of substituting for Strait-routed volumes:
- Saudi Arabia's East-West Pipeline (Petroline) carries approximately 5 mb/d at full capacity, a fraction of Strait throughput
- The UAE's Abu Dhabi Crude Oil Pipeline offers additional relief but similarly cannot absorb displacement at scale
Structural Reality: The arithmetic is unambiguous. Even combining all available bypass infrastructure, the Strait of Hormuz cannot be substituted for Middle Eastern export volumes at anything approaching current scale. This is not an engineering challenge that can be solved quickly. It is a permanent geographic constraint.
Why LNG Exposure Is Particularly Acute
While crude oil dominates the headline risk narrative, LNG market disruption from a Strait closure may ultimately prove harder to manage. Qatar, the world's largest single LNG exporter, has no viable alternative export route. Unlike crude oil, LNG cannot be transported through pipelines over intercontinental distances. It requires specialised liquefaction terminals, purpose-built tankers operating at cryogenic temperatures, and regasification infrastructure at destination ports.
If Strait-routed LNG is disrupted, Asian spot LNG prices measured by the Japan-Korea Marker (JKM) benchmark would spike sharply. Buyers unable to secure term supply would face a brutal spot market, driving fuel-switching back toward coal and oil in power generation, which ironically compounds the very oil demand pressure the market is simultaneously trying to manage.
Three Scenarios, Three Radically Different Outcomes
Why Scenario Modelling Outperforms Point Forecasting Here
Geopolitical energy disruptions resist single-point price forecasting. The variables are too numerous, the feedback loops too complex, and the political decision-making too unpredictable. Scenario modelling, structured around closure duration as the primary variable, produces probability-weighted outcome ranges that are far more analytically useful than any single Brent crude price forecast.
A critical feature of this type of modelling is the non-linearity of price outcomes. Each additional month of Strait disruption does not add a linear increment to oil prices. Instead, it simultaneously compounds supply deficits, accelerates demand destruction, triggers secondary effects across insurance markets and shipping routes, and forces central banks into increasingly difficult policy trade-offs. Furthermore, understanding broader oil price trends provides essential context for interpreting where prices could settle once disruption risk abates.
Scenario 1: Rapid Resolution by June 2026
Under the most optimistic scenario, diplomatic channels produce a workable resolution and the Strait reopens within weeks of mid-2026. The economic consequences remain meaningful but contained:
- Brent crude eases toward approximately $80 per barrel by the end of 2026
- Prices soften further to around $65 per barrel through 2027 as supply normalises
- Asian LNG spot premiums dissipate as Qatar resumes full export operations
- Global growth disruption remains modest; any inflation spike is treated as transitory by central banks
- Financial markets, which appear to be treating this as the current base case based on futures curve structure, see validation of their relatively sanguine positioning
This scenario is currently embedded in most institutional consensus forecasts, which is precisely why the downside scenarios carry such asymmetric significance for risk-aware investors.
Scenario 2: Summer Disruption Through Q3 2026
If negotiations extend into late summer and the Strait remains largely closed through the third quarter, the economic calculus shifts materially:
- Oil and LNG shortages persist across Q2 and Q3 2026
- Brent crude trades in the $120 to $130 per barrel range, consistent with JP Morgan's regional escalation modelling
- Refinery margins spike in Asia and Europe as competition for available crude intensifies
- A shallow global recession in H2 2026 becomes a plausible base case, particularly for energy-import-dependent economies in South and Southeast Asia
- European buyers aggressively divert US LNG cargoes eastward, tightening Atlantic basin supply and raising gas prices across both markets simultaneously
At this price level, the inflation transmission mechanism becomes self-reinforcing. Every sustained $10 per barrel increase in oil prices historically adds approximately 0.2 to 0.5 percentage points to headline CPI in major oil-importing economies, a relationship that holds across multiple inflationary cycles.
Scenario 3: Prolonged Closure Through End of 2026
The worst-case scenario assumes recurring military escalation prevents any durable reopening through December 2026. The price and macroeconomic consequences enter territory without modern precedent:
- Brent crude could breach $200 per barrel, a level never recorded in the history of modern energy markets
- Even at extreme prices, global oil demand is projected to fall by approximately 6 mb/d in H2 2026 as consumption is rationed by price across discretionary sectors
- Global GDP could contract by as much as 0.4% in 2026, with the most severe impacts concentrated in energy-import-dependent economies
- The supply shock from removing up to 20 mb/d from global markets would represent the largest single oil supply disruption in modern history, exceeding the scale of the 1973 Arab oil embargo
According to Wood Mackenzie's head of economics Peter Martin, the duration of any disruption is the defining variable, with extended closures generating compounding damage across energy prices, industrial production, trade flows, and overall economic output. The Strait is characterised in the firm's analysis as the single most critical chokepoint in global energy markets.
Price Forecast Comparison Across Major Institutions
Scenario-Weighted Brent Crude and Macro Impact Table
| Scenario | Duration | Brent Price Range | Global GDP Impact | Recession Risk |
|---|---|---|---|---|
| Rapid Resolution | Closes by June 2026 | ~$65–$80/bbl by end-2026 | Minimal | Low |
| Summer Disruption | Closes through Q3 2026 | ~$120–$130/bbl | Moderate contraction | Moderate (H2 2026) |
| Prolonged Closure | Closes through end-2026 | Up to $200/bbl | -0.4% GDP | High |
| Tail Risk / Full Blockade | 30+ day full closure | $150–$350/bbl (modelled) | Severe | Very High |
Sources: Wood Mackenzie scenario modelling; JP Morgan regional escalation analysis; ING and OilPrice extreme scenario modelling
Why the $350 Per Barrel Figure Exists and What It Represents
The $350 per barrel tail risk modelled by some analysts deserves careful contextualisation. It does not represent a base case or even a likely outcome. It models a full month-long naval blockade with zero transit permitted, zero OPEC+ spare capacity released, and no coordinated strategic petroleum reserve (SPR) drawdown from IEA member governments.
ING-cited analysis suggests prices would likely surpass the 2008 record high near $150 per barrel in a severe blockade scenario before demand destruction begins to provide a natural ceiling. The distance between $150 and $350 represents the upper bound of a scenario in which supply destruction outpaces even emergency demand rationing.
Current futures market structure suggests institutional traders are assigning very low probability to the prolonged closure scenario. This creates a meaningful asymmetric risk profile for energy-exposed portfolios: limited downside from current pricing if the base case resolves as expected, but potentially catastrophic upside in oil prices if the tail risk scenario materialises.
Second-Order Consequences: Beyond the Price of a Barrel
The Stagflation Trap
An oil price shock of the magnitude described in the Extended Disruption or Prolonged Closure scenarios does not merely raise energy costs. It creates the conditions for stagflation, the simultaneous occurrence of rising inflation and contracting economic output that central banks find almost impossible to address through conventional monetary tools.
The policy dilemma is structural: raising interest rates to combat energy-driven inflation risks deepening the economic contraction already underway from supply destruction. Cutting rates to support growth risks entrenching inflationary expectations and triggering currency depreciation in import-dependent emerging economies.
The inflation transmission pathway is well-documented across previous oil shock cycles:
- Fuel and transport costs rise within days of a supply disruption
- Petrochemical and manufacturing input costs escalate within weeks
- Food production and logistics costs follow within one to two months as fertiliser and freight prices adjust
- Wage pressure builds as workers in inflation-sensitive economies demand compensation adjustments
Regional Vulnerability: Who Bears the Most Risk
| Region | Primary Exposure | Secondary Risk | Mitigation Capacity |
|---|---|---|---|
| Asia-Pacific (Japan, South Korea, India) | LNG and crude import dependency | Industrial slowdown, inflation | Low to Moderate |
| Europe | Oil and LNG supply diversion | Energy cost inflation | Moderate (US LNG alternative) |
| United States | Indirect global price contagion | Inflation, trade flow disruption | High (domestic production buffer) |
| Sub-Saharan Africa | Refined fuel import costs | Food inflation, fiscal stress | Very Low |
| Gulf Cooperation Council | Revenue loss from export curtailment | Fiscal deficit widening | Moderate (sovereign wealth buffers) |
Sectors Facing the Sharpest Earnings Pressure
- Aviation: Jet fuel represents 20 to 30% of airline operating costs; a $200/bbl oil environment would render most long-haul routes economically unsustainable
- Petrochemicals and plastics: Feedstock cost escalation compresses margins across the entire downstream value chain
- Shipping and logistics: War-risk insurance premiums for Gulf-adjacent routes spike, increasing freight costs globally
- Agriculture: Fertiliser production is heavily gas-dependent; disruption cascades rapidly into food price inflation
- Automotive manufacturing: Supply chain disruptions compound with energy input cost increases across assembly and parts logistics
Could a Strait Closure Paradoxically Accelerate the Energy Transition?
Historical Precedent from the 1973 Oil Shock
The 1973 Arab oil embargo, which removed approximately 4 to 5 mb/d from global markets, triggered the first major wave of energy efficiency investment in OECD countries. Japan overhauled its entire industrial energy architecture within a decade. France launched an aggressive nuclear expansion programme that ultimately gave it 75% nuclear electricity generation by the 1990s. The United States introduced fuel economy standards that reshaped the automotive industry.
A disruption removing up to 20 mb/d, five times larger than the 1973 shock, would likely produce structural policy responses of proportionally greater magnitude. Wood Mackenzie's Extended Disruption scenario specifically models a renewed push for alternative energy sources, with Asian and European governments accelerating electrification programmes and reducing hydrocarbon dependency as a direct policy response to supply insecurity. In addition, renewable energy solutions that were once viewed as supplementary are increasingly framed as strategic necessities in this context.
Who Benefits in a Disruption Scenario
Not all market participants face negative outcomes under a Strait closure. Several asset classes and industries are positioned to benefit materially:
- US LNG exporters gain significant pricing power as buyers across Asia and Europe seek non-Strait-dependent supply alternatives, with US Gulf Coast LNG terminals positioned as the primary beneficiary
- Renewable energy developers find their economic case strengthened as extreme fossil fuel price volatility compresses the levelised cost differential between renewables and conventional generation
- Nuclear energy advocates gain political momentum as energy security arguments for baseload non-fossil generation become harder to dismiss
- Strategic petroleum reserve holders gain geopolitical leverage as IEA members coordinate drawdown strategies
- Australian LNG producers benefit from their geographic position outside the Strait exposure zone, potentially commanding supply security premiums from Asian buyers
The next major ASX story will hit our subscribers first
How Markets Are Currently Pricing Strait of Hormuz Risk
The Probability Discount Embedded in Current Futures Pricing
Despite the severity of worst-case scenario modelling, oil futures curves are not currently reflecting $120 to $200 per barrel pricing. Several factors are suppressing geopolitical risk premiums:
- Active diplomatic back-channels are being interpreted by markets as evidence that rapid resolution remains plausible
- Historical precedent: the Strait has remained open despite numerous regional military escalations over the past four decades
- OPEC's market influence suggests the cartel could partially offset supply losses, though not at the scale required under prolonged closure scenarios
- US domestic production provides a partial buffer against global price contagion for the world's largest economy
Key Indicators for Monitoring Escalation Risk
Investors and analysts tracking Strait of Hormuz closure oil prices should monitor the following indicators as leading signals:
- Brent-WTI spread widening, which signals tightening Middle Eastern supply relative to North American benchmarks
- Tanker war-risk insurance premium movements, which serve as an early warning system for shipping market stress before it registers in headline oil prices
- JKM benchmark movements for Asian LNG spot pricing, reflecting real-time supply tightness in the most exposed import markets
- US Strategic Petroleum Reserve release announcements, signalling the scale of government emergency response
- OPEC+ emergency meeting convening, which indicates cartel recognition that a supply shock has exceeded normal market self-correction capacity
- Freight rate movements on Suez Canal alternative routes, measuring the cost and volume of rerouting pressure already occurring in shipping markets
Asymmetric Risk Watch: The current gap between worst-case scenario modelling and actual futures market pricing is unusually wide. This divergence suggests markets are treating a prolonged Strait closure as a tail risk rather than a base case, which creates significant asymmetric exposure for energy portfolios that are not positioned for discontinuous price moves.
Frequently Asked Questions: Strait of Hormuz Closure and Oil Prices
What percentage of global oil supply transits the Strait of Hormuz?
Approximately 20% of all globally traded oil passes through the Strait daily. Combined with over 80 million tonnes per annum of LNG, the corridor handles roughly one-fifth of the world's most critical energy flows, making it the single highest-concentration energy chokepoint on Earth.
How high could oil prices realistically go under a closure scenario?
Outcomes depend almost entirely on closure duration. A resolution by June 2026 could see Brent normalise toward $65 to $80 per barrel by end-2026. A disruption through Q3 2026 could push prices to $120 to $130 per barrel. A worst-case scenario extending through end-2026 could see Brent reach $200 per barrel, with extreme tail-risk modelling suggesting levels up to $350 per barrel in a full sustained blockade.
Which economies face the greatest vulnerability to a prolonged closure?
Asia-Pacific nations carry the highest direct exposure. Japan, South Korea, China, India, and Taiwan together account for the majority of Middle Eastern LNG and crude import demand. Sub-Saharan African nations face acute secondary exposure through refined fuel import cost escalation. European economies have greater mitigation capacity through US LNG diversion but are not insulated from global price contagion.
Are there viable alternatives if the Strait is closed?
Partial bypass infrastructure exists but is insufficient. Saudi Arabia's East-West Pipeline manages approximately 5 mb/d at full capacity. The UAE's Abu Dhabi Crude Oil Pipeline adds further but still inadequate bypass volume. No combination of existing alternatives can absorb full Strait-equivalent throughput. LNG has no pipeline bypass option at all.
The Long-Term Strategic Consequences of a Major Disruption
Three Structural Shifts That Would Follow a Prolonged Closure
A Strait closure of meaningful duration would not simply be a temporary price shock. It would permanently alter the global energy security architecture in at least three structural dimensions:
-
LNG supply chain diversification would accelerate dramatically. US, Australian, and East African LNG projects would gain strategic priority as buyers institutionalise non-Gulf-dependent supply agreements. Long-term contract structures would shift to reflect supply origin diversity as a pricing premium rather than a nice-to-have feature.
-
Strategic petroleum reserve requirements would be ratcheted upward. IEA member governments would face political pressure to expand SPR holdings beyond current mandated minimums, and the geopolitical case for emergency stockpile investment would become difficult to argue against in any legislative environment.
-
Renewable energy deployment timelines would compress. Extreme fossil fuel price volatility is among the most powerful economic arguments for accelerating electrification. A $200 per barrel oil environment would make solar, wind, and battery storage investments economically compelling in markets where the transition has previously been characterised as too costly or premature.
The paradox embedded in an extreme Strait disruption scenario is that the very event most damaging to the global economy in the short term may ultimately accelerate the structural transformation away from fossil fuel dependency. Consequently, broader oil market disruptions of this nature serve as a powerful reminder that Strait of Hormuz closure oil prices are not simply an energy issue — they are a civilisational stress test that reshapes policy, investment, and geopolitical alliances for decades to come. Analysts at Bloomberg have similarly highlighted how the structural aftermath of a prolonged closure would extend far beyond the price of a barrel.
Disclaimer: This article is intended for informational and educational purposes only and does not constitute financial or investment advice. All scenario modelling, price forecasts, and economic projections referenced are sourced from third-party research institutions and carry inherent uncertainty. Readers should conduct independent research and seek qualified professional advice before making any investment decisions. Forward-looking statements involve assumptions and risks that may cause actual outcomes to differ materially from those described.
Want to Know Which ASX Stocks Are Positioned for Major Energy-Related Discoveries?
Discovery Alert's proprietary Discovery IQ model delivers real-time alerts on significant ASX mineral discoveries — including those in commodities most exposed to global energy market disruptions — instantly empowering subscribers to identify actionable opportunities ahead of the broader market. Explore historic discoveries and their exceptional returns, then begin your 14-day free trial to position yourself ahead of the next major market-moving announcement.