July 11, 2026
The Geometry of Global Energy Risk: Understanding the Strait of Hormuz
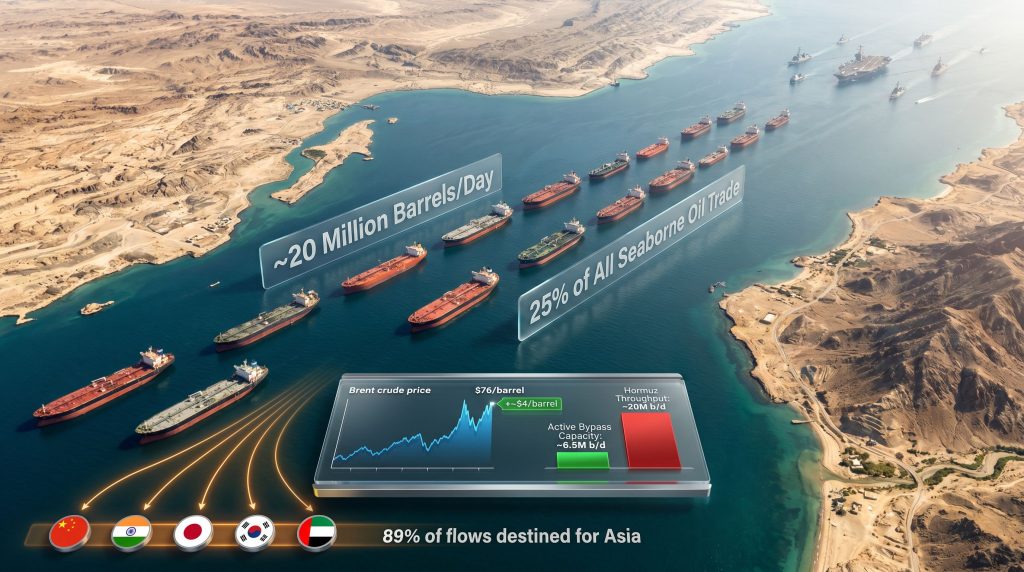
Energy markets have always been shaped by geography as much as by geology. The location of reserves, the accessibility of ports, and the navigability of shipping lanes determine how efficiently supply reaches demand. But few geographic features carry as much systemic weight as the narrow passage separating Iran from the Arabian Peninsula. At its tightest point, the Strait of Hormuz measures just 33 kilometres across its navigable corridor, yet through this constriction flows approximately 20 million barrels of oil per day, accounting for roughly 20% of global daily oil consumption and 25% of all seaborne crude trade worldwide.
For energy market participants, commodity traders, and macroeconomic analysts, understanding how a Strait of Hormuz oil disruption propagates through global systems is not merely an academic exercise. It is a structural risk management imperative.
When big ASX news breaks, our subscribers know first
Why No Other Chokepoint Compares
The Strait of Hormuz is unique in the concentration of supply it channels relative to the absence of viable alternatives. Other maritime chokepoints, including the Suez Canal, the Bab-el-Mandeb, and the Strait of Malacca, carry significant volumes but possess more workable rerouting options. Hormuz does not.
The strategic weight of the strait becomes even more apparent when examining the composition of its flows:
| Metric | Figure |
|---|---|
| Daily oil throughput | ~20 million barrels/day |
| Share of global oil consumption | ~20% |
| Share of global seaborne oil trade | ~25% |
| Share of global LNG supply transiting | ~20% |
| Proportion of flows destined for Asia | ~89% |
| Primary recipients | China, India, Japan, South Korea |
The Asian exposure embedded in these figures is striking. Nearly nine in every ten barrels transiting the strait are bound for Asia-Pacific economies. This structural dependency means that a Strait of Hormuz oil disruption is, in practical terms, an Asian energy crisis first and a global inflation event second. European exposure is more indirect but still material, primarily transmitted through LNG price escalation and diesel crack spread widening rather than direct crude supply interruption.
The LNG Dimension: Often Overlooked, Always Critical
While crude oil dominates the headlines, the strait's role in global LNG supply trade is equally consequential. Approximately 20% of global LNG supply transits through Hormuz, with Qatar functioning as the world's single largest LNG exporter and its entire liquefaction infrastructure at Ras Laffan located squarely within the Persian Gulf. There is no pipeline bypass for LNG. A disruption does not simply add cost, it eliminates supply optionality entirely for buyers dependent on Qatari cargoes.
How Supply Shock Transmission Actually Works
A common misconception is that a Strait of Hormuz disruption operates as a binary event, either open or closed. In practice, disruptions unfold across a spectrum of escalation stages, each with distinct market mechanics and timeframes.
Stage 1: The Immediate Repricing Event
Within hours of any credible escalation signal, the following sequence typically occurs:
- War risk insurance premiums surge, making every barrel transiting the strait more expensive to move
- Tanker operators initiate precautionary holds or anchor vessels outside the waterway pending risk assessment
- Spot freight rates for Very Large Crude Carriers (VLCCs) spike sharply, adding a direct cost layer to delivered crude prices
- Brent crude benchmarks reprice within trading sessions as algorithmic and discretionary traders factor in supply interruption probability
This initial phase is driven less by actual supply loss and more by the market's forward-looking assessment of risk probability. The geopolitical risk premium is not a simple add-on; it reflects the probability-weighted cost of potential supply loss, discounted by the likelihood and speed of resolution. Furthermore, understanding geopolitical oil risks is essential for any analyst modelling these early-stage market responses.
Stage 2: Inventory Drawdown and Refinery Adjustment
If the disruption persists beyond the initial shock window, importing nations begin drawing on strategic petroleum reserves (SPRs). Refinery run rates adjust as feedstock availability tightens, particularly for complex Asian refineries configured specifically to process Persian Gulf sour crude grades. Diesel, jet fuel, and gasoline crack spreads widen as product output falls. LNG spot prices in Asian terminal markets surge as Qatari cargoes stall.
Stage 3: Structural Geopolitical Premium Embedding
A prolonged disruption transitions from an event risk to a structural pricing element. Energy economists broadly estimate this sustained premium at $10 to $20 per barrel above pre-disruption Brent pricing, depending on the severity and duration of the interruption. At this stage, the energy cost transmission into freight, manufacturing input costs, and food supply chains begins to exert measurable inflationary pressure at the macroeconomic level.
The IMF's decision to downgrade its global economic growth forecast to 3% amid the Iran conflict escalation in 2026 reflected precisely this mechanism: energy supply disruption transmitting into broader growth deceleration through the inflation channel.
The 2026 Escalation Cycle: A Detailed Chronology
The mid-2026 Hormuz crisis provided a real-world case study in how these theoretical transmission mechanisms materialise under live conflict conditions. Consequently, the oil market impacts observed during this period offer valuable lessons for forward-looking risk modelling.
| Date / Period | Event | Market Impact |
|---|---|---|
| February 28, 2026 | U.S. and Israeli strikes on Iran trigger initial access restrictions | ~85 large tankers trapped in Persian Gulf carrying ~21 billion litres of crude |
| Feb to March 2026 | Major shipping companies pause Gulf transits | Brent rises from ~$69/b to ~$74/b in a single session |
| Short-lived ceasefire | Fragile diplomatic agreement temporarily reduces tensions | Oil prices partially retreat as traffic cautiously resumes |
| Early July 2026 | Iran attacks three vessels on a newly established southern shipping lane | Ceasefire collapses; tanker U-turns resume |
| Week of July 10, 2026 | Renewed U.S.-Iran strikes; Hormuz traffic approaches near-standstill | Brent settles above $76/barrel; weekly gain of approximately $4/barrel |
A particularly notable aspect of the July 2026 escalation was the behaviour of QatarEnergy's LNG fleet. Three carriers — the Al Ghariya, Duhail, and Al Ruwais — reversed course from the strait following renewed vessel attacks, triggering an immediate secondary spike in insurance costs. Simultaneously, QatarEnergy paused efforts to restart Ras Laffan liquefaction operations after the Al Rekayyat LNG carrier was struck, despite having accumulated eleven empty vessels at port awaiting cargo.
Iran, meanwhile, pursued a counter-strategy: loading as many oil tankers as possible, reportedly placing approximately 11 million barrels of crude aboard vessels in a single day as Tehran sought to maximise export revenues ahead of an anticipated tightening of the blockade on Iranian outflows through the Gulf of Oman.
Why the Shock Stabilised Faster Than the Worst-Case Models Predicted
Several demand-side and reserve deployment mechanisms cushioned the 2026 disruption:
- China reduced oil import volumes by an estimated 40 to 45%, functioning as an unintended demand-side buffer that released supply other nations could source from alternative markets
- IEA member nations coordinated strategic reserve releases to close the immediate supply gap
- U.S. naval presence prevented a complete physical blockade, allowing partial flows to continue under elevated risk conditions
Despite these buffers, the IEA revised its 2026 oil market outlook significantly, reducing demand growth expectations by 1 million barrels per day while simultaneously projecting global supply to contract by 3.7 million barrels per day due to ongoing Middle East disruptions. The agency pushed its previously anticipated supply surplus scenario out to 2027.
The Arithmetic of Bypass Infrastructure: Why Alternatives Fall Short
Energy security planners have long recognised Hormuz dependency as a structural vulnerability. Several bypass routes exist, but their combined capacity is fundamentally inadequate.
| Bypass Route | Operator / Country | Capacity | Operational Status |
|---|---|---|---|
| East-West Pipeline (Petroline) | Saudi Aramco / Saudi Arabia | ~5 million b/d | Active, Red Sea terminus at Yanbu |
| Abu Dhabi Crude Oil Pipeline (ADCOP) | ADNOC / UAE | ~1.5 million b/d | Active, Gulf of Oman terminus at Fujairah |
| Goreh-Jask Pipeline | NIOC / Iran | ~1 million b/d | Rarely utilised |
| Saudi Red Sea Pipeline Expansion | Saudi Arabia | Under evaluation | Planning stage as of 2026 |
Combined active bypass capacity across the Saudi Petroline and UAE ADCOP reaches approximately 6.5 million barrels per day. Against a normal Hormuz throughput of 20 million barrels per day, this covers less than one-third of regular volumes. The remaining 13.5 million barrels per day has no viable alternative routing under current infrastructure.
For LNG, the situation is more severe. There is effectively no pipeline bypass option. All Gulf LNG must either transit Hormuz or be rerouted around the Cape of Good Hope, a diversion that adds approximately 10 to 15 days to voyage times, compresses tanker fleet availability, and adds directly to the delivered cost of every cargo.
The Environmental Dimension: A Risk Rarely Quantified Adequately
During the February to March 2026 disruption, approximately 85 large oil tankers carrying a collective 21 billion litres of crude oil were stranded within the enclosed waters of the Persian Gulf. Maritime risk analysts flagged this concentration of vessels as an acute environmental threat that received significantly less public attention than the price impact.
The structural vulnerability is considerable:
- A single VLCC casualty in the strait could release up to 2 million barrels of crude into one of the world's most ecologically fragile marine environments
- The Persian Gulf's limited tidal exchange rate means spill dispersion is dramatically slower than open-ocean incidents, concentrating damage to coastal fisheries, desalination intakes, and marine ecosystems
- Shallow, confined waters elevate collision and grounding risk for vessels at anchor or executing emergency manoeuvres
This environmental exposure represents a tail risk that energy security analysts and maritime insurers incorporate into their modelling but that rarely features prominently in commodity price discussions. It should.
The next major ASX story will hit our subscribers first
Cascading Effects: From LNG to Diesel to Macroeconomic Slowdown
A Strait of Hormuz oil disruption does not confine its consequences to crude markets. The transmission mechanism extends across multiple commodity and financial markets simultaneously. In addition, oil price movements in adjacent benchmarks tend to amplify these cascading effects considerably.
The Diesel Shock: A Compound Disruption
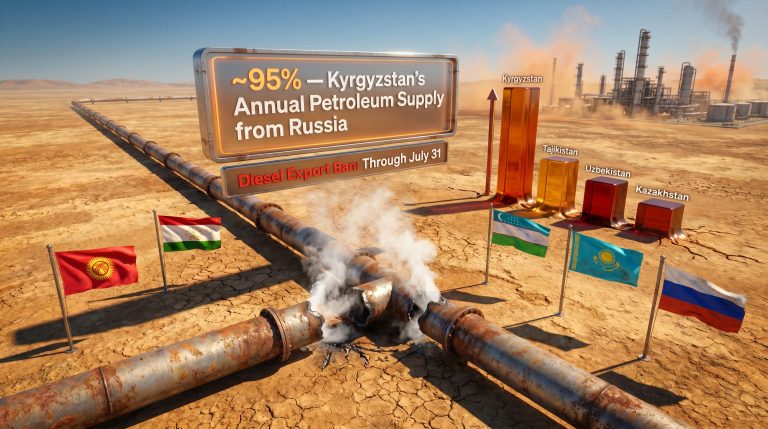
The 2026 escalation coincided with Russia implementing a one-month ban on diesel exports following Ukrainian drone strikes on Russian refinery infrastructure. This removed approximately 0.5 million barrels per day from European diesel supply at precisely the moment when Hormuz-related tightening was already compressing product availability. European diesel crack spreads reached a 15-year high of $60 per barrel, placing severe pressure on road transport and heating fuel costs across the continent.
Freeport LNG: An Unrelated Outage With Compounding Timing
The Freeport LNG terminal in Texas, operating at 16.5 million tonnes per annum of liquefaction capacity, began an unplanned major maintenance turnaround on July 10, 2026, scheduled to run until late August. Feedgas supply to the facility had already fallen from 2.5 Bcf per day to 1.5 Bcf per day ahead of the outage. With Qatari LNG simultaneously paused and Hormuz transit risk elevated, Atlantic Basin LNG supply faced a tightening from multiple simultaneous directions rather than a single point of disruption. According to EIA analysis, such compounding supply shocks significantly amplify price volatility beyond what single-source disruptions typically produce.
Strategic Responses: How Major Players Are Repositioning
The 2026 crisis accelerated strategic repositioning among both producers and importers.
India: Building Emergency Buffer Capacity
India's state-controlled oil firm ONGC committed to constructing a 13-million-barrel crude reserve facility in Mangalore following the disruption's exposure of India's structurally limited emergency stockpile capacity. India is simultaneously evaluating a potential return to Iranian crude imports, contingent on U.S. sanctions waiver extensions that would allow Delhi to access discounted Persian Gulf supply through alternative payment mechanisms.
Saudi Arabia and the UAE: Expanding Bypass Infrastructure
Saudi Arabia is evaluating a major expansion of its Red Sea pipeline corridor to increase bypass capacity beyond the current Petroline limit. The UAE's Fujairah terminal, which sits outside the strait on the Gulf of Oman coast, has been progressively positioned as an alternative crude loading hub. ADNOC has further demonstrated its strategic intent through a commitment to expand its LNG carrier fleet, ordering approximately $900 million in new vessels as of mid-2026.
Turkey and Iraq: Preserving Non-Hormuz Export Routes
Turkey and Iraq finalised a 12-month extension of the Kirkuk-Ceyhan pipeline operating agreement ahead of the original contract expiry date of July 27, 2026. This pipeline provides Iraqi crude producers with a non-Hormuz export route terminating at the Turkish Mediterranean port of Ceyhan, offering partial insulation from Persian Gulf transit risk.
Scenario Analysis: Mapping the Risk Spectrum
| Scenario | Probability Assessment | Estimated Price Impact | Duration Expectation |
|---|---|---|---|
| Continued vessel harassment and attacks | High | +$4 to $8/barrel geopolitical premium | Weeks to months |
| Partial flow reduction, 30 to 50% of normal | Moderate | +$10 to $15/barrel | Days to weeks |
| Near-complete halt as seen Feb to Mar 2026 | Low-moderate | +$15 to $25/barrel | Days to weeks before partial resumption |
| Full physical blockade | Very low | +$20 to $40/barrel | Short, U.S. naval response expected rapidly |
Energy security analysts broadly consider a complete, sustained closure of the Strait of Hormuz to be structurally improbable given the permanent U.S. naval presence in the region. However, the U.S. Navy has explicitly stated it cannot guarantee the safety of merchant vessels transiting the Gulf of Oman and the strait itself, a position that acknowledges the live reality of partial disruption, vessel harassment, and insurance cost escalation as ongoing baseline conditions rather than exceptional events.
Goldman Sachs flagged this risk environment in mid-2026, noting that energy markets had previously underestimated the potential for a sustained Iran-related supply disruption to challenge its existing supply surplus thesis. The Federal Reserve's concurrent assessment that an oil price rally may ultimately cool, despite renewed hostilities, rested on the expectation that demand destruction from economic slowdown would offset supply tightening, not on any assumption of supply normalisation in the near term. Furthermore, CNBC's expert scenario analysis reinforced this view, highlighting that demand-side deterioration remains the principal moderating force on prices during prolonged disruptions.
The Hormuz Paradox: Irreplaceable Yet Perpetually Threatened
For investors, commodity traders, and energy policy analysts, the Strait of Hormuz presents a structural paradox. It is simultaneously too important to close, given the economic devastation a complete blockade would inflict on both importing and exporting nations, and too exposed to treat as a reliable constant in supply chain planning.
The key conclusions for market participants are worth distilling clearly:
- The strait functions as the load-bearing column of global energy architecture, and stress to it transmits immediately into crude prices, LNG spot markets, diesel crack spreads, and consumer inflation
- Bypass infrastructure covers less than one-third of normal throughput, confirming that no credible full-replacement option exists within current planning horizons
- Demand-side buffers, including China's import reduction and coordinated SPR releases, demonstrated in 2026 that markets can partially absorb disruption shocks, but these mechanisms are buffers, not structural solutions
- Strategic reserve expansion and pipeline bypass planning reflect growing institutional recognition that Hormuz dependency is a systemic vulnerability requiring long-term structural mitigation, not just crisis management protocols
- The geopolitical risk premium embedded in Brent crude is likely to remain structurally elevated as long as U.S.-Iran tensions persist, fragile ceasefire arrangements remain reversible, and bypass capacity remains insufficient
Disclaimer: This article is for informational and educational purposes only and does not constitute financial, investment, or trading advice. Forecasts, price projections, and scenario analyses referenced herein involve inherent uncertainty and should not be relied upon as predictions of future market outcomes. Readers should conduct their own independent research before making any investment decisions.
For ongoing coverage of Strait of Hormuz developments, tanker traffic data, and geopolitical risk assessments for global energy markets, OilPrice.com provides continuously updated reporting and analysis from energy market specialists.
Want to Stay Ahead of the Next Major Commodity Discovery Triggered by Energy Market Disruptions?
When geopolitical shocks like Strait of Hormuz disruptions ripple through global commodity markets, the downstream effects on mineral exploration and ASX-listed resource companies can be swift and significant — Discovery Alert's proprietary Discovery IQ model delivers real-time alerts on significant ASX mineral discoveries, transforming complex market signals into actionable investment opportunities for traders and long-term investors alike. Explore historic examples of exceptional discovery returns and begin your 14-day free trial today to position yourself ahead of the broader market.