June 3, 2026
When Markets Defy Logic: Decoding the 2026 Commodity Paradox
There is a persistent belief embedded in mainstream financial thinking that when geopolitical tension escalates, precious metals rise. Investors flee to safety, gold surges, silver follows, and the world resets once the crisis fades. It is a clean narrative. It is also, increasingly, an incomplete one.
The events unfolding across global commodity markets in 2026 have shattered this assumption with unusual force. As the Strait of Hormuz oil spike and gold silver plunge have demonstrated simultaneously, these are not two sides of the same coin. They are separate phenomena, driven by distinct mechanics, operating in parallel rather than in concert. Understanding why requires moving past headlines and into the structural architecture of how modern commodity markets actually function.
When big ASX news breaks, our subscribers know first
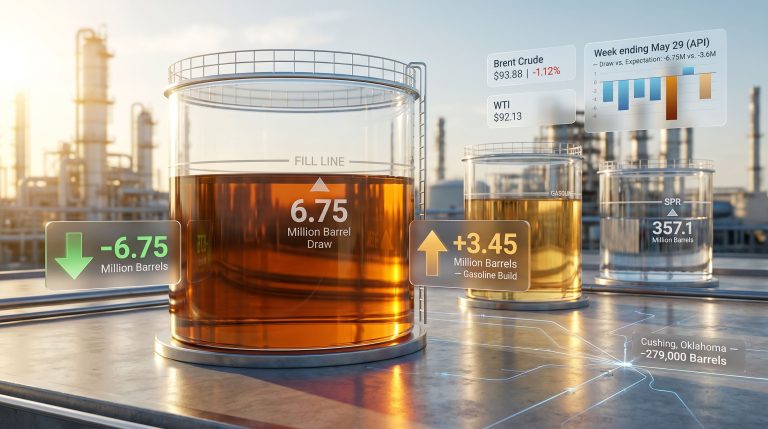
The World's Most Consequential Shipping Lane
At its narrowest navigable point, the Strait of Hormuz measures approximately 34 kilometres across. That distance is shorter than many urban commutes, yet it serves as the physical gateway through which approximately 20 million barrels of crude oil and condensate pass every single day. That volume represents roughly one-fifth of total global petroleum liquids consumption, making it by far the most consequential maritime chokepoint on Earth.
The significance extends beyond crude oil. Approximately one-fifth of global liquefied natural gas trade also transits this corridor, with Qatar and Saudi Arabia collectively accounting for around 38% of crude flows. Unlike disruptions to pipelines or overland transport routes, where partial rerouting is possible, no commercially viable alternative exists capable of absorbing the full volume that transits the Strait under normal conditions.
This structural reality is what gives the Strait its pricing power. Any restriction, even a partial one, transmits directly and almost instantaneously into global oil futures markets. The economics are not regional. They are systemic.
"The Strait of Hormuz functions less like a shipping lane and more like a pressure valve for the entire global energy system. Its restriction does not merely inconvenience regional exporters; it reprices energy for every nation on Earth that depends on seaborne oil."
How the 2026 Oil Shock Compares to History
The current disruption did not emerge from a single event. A sequence of U.S.-Iran vessel seizure incidents escalated diplomatic friction progressively through early 2026. Negotiated talks broke down, partial shipping restrictions were imposed, and what stopped short of a formal naval blockade produced near-blockade economic conditions. Estimated disruptions exceeded 90% of normal shipment volumes through certain corridors, equivalent to approximately 10 million barrels per day being effectively removed from the market.
Furthermore, the price response has been severe by any historical measure, as illustrated by the crude oil price trends observed across recent crisis cycles:
| Crisis Event | Brent Crude Peak | Approximate Change | Duration |
|---|---|---|---|
| 1973 Arab Oil Embargo | ~$12/bbl (nominal) | +300% | ~6 months |
| 1990 Gulf War | ~$46/bbl | +130% | ~7 months |
| 2022 Russia-Ukraine Conflict | ~$139/bbl | +80% | ~3 months |
| 2026 Hormuz Disruption | ~$126/bbl | +48% from onset | Ongoing |
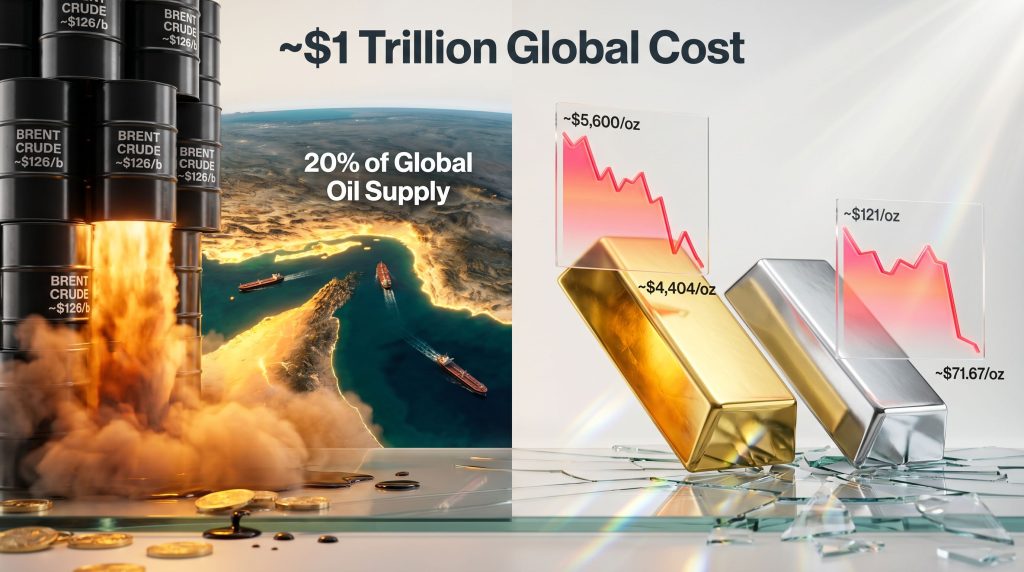
Brent crude surged past $100 per barrel early in the disruption cycle, peaked at approximately $126 per barrel, and has since consolidated into a $107 to $111 per barrel trading range as of late April 2026. March 2026 recorded the largest single-month oil price increase of the current cycle. War risk insurance premiums on individual tanker voyages climbed to as high as $250,000 per trip, a figure that alone illustrates the severity of perceived transit risk.
What the percentage comparison in the table above obscures is the absolute economic scale. A 48% oil price shock from a much higher baseline creates a different order of economic damage than historical crises of greater percentage magnitude. The global economy is larger, more integrated, and more energy-dependent across a wider range of supply chains than it was in 1973 or even 1990.
The Economic Damage Running Through Every Supply Chain
The upstream beneficiaries of the oil price surge have been straightforward to identify. Major integrated oil companies with export infrastructure independent of Hormuz transit have captured substantial pricing leverage. BP's Q1 2026 net profit approximately doubled to $3.2 billion, directly attributable to elevated crude realisation prices, in a quarter that would otherwise have been unremarkable.
The downstream damage is far harder to contain. Analysts estimate the aggregate global cost impact at up to $1 trillion when accounting for fuel price increases, food supply chain disruption, and embedded inflation. Even in a scenario where the disruption resolves in the near term, residual economic drag is estimated at approximately $600 billion, a figure reflecting how difficult it is to reverse inflationary dynamics once they have been transmitted through supply chains.
The transmission mechanisms are multiple and reinforcing:
- Retail fuel prices rise directly and immediately as refinery input costs increase
- Agricultural input costs climb as fertiliser production and transport both depend heavily on energy
- Manufacturing energy costs rise across industrial sectors, compressing margins or inflating output prices
- Freight cost pass-through elevates consumer goods pricing across virtually every category
"This is not a contained energy market event. A sustained Hormuz disruption of this magnitude reaches food security, central bank policy frameworks, and sovereign debt servicing capacity in import-dependent economies. The downstream effects operate on a longer timeline than the headline oil price."
According to Gulf Countries Facing Energy Market Disruption, the broader regional fallout from this disruption extends well beyond headline crude pricing, reshaping sovereign revenue projections and regional economic stability frameworks.
The Precious Metals Paradox: Why Gold and Silver Are Falling
At the same time that oil markets are absorbing one of their most significant supply shocks in decades, gold and silver have been experiencing sharp corrections from historic highs. For investors conditioned by decades of market commentary to treat precious metals as the default safe-haven during geopolitical crisis, this has been genuinely disorienting.
The reality is that the Strait of Hormuz oil spike and gold silver plunge are not causally connected. They are concurrent but independent market events. Understanding each requires its own analytical framework.
Gold's 2026 price trajectory in context:
- Peak price recorded: approximately $5,600 per ounce
- Post-peak low reached: approximately $4,404 per ounce
- Correction magnitude: approximately 21% from peak
- Single-day decline: the steepest recorded since the 1980s
- Year-to-date performance: still approximately +9% positive as of early 2026
The year-to-date figure is critical. It confirms that the correction occurred within a broader structural uptrend, not as a trend reversal. Gold had appreciated approximately 96% over the prior 12-month period. That scale of advance, regardless of its fundamental justification, creates extreme positioning vulnerability. The market was crowded, leveraged, and priced for continued perfection.
Five distinct mechanisms drove the correction:
- Overbought technical conditions produced by a near-doubling in price over twelve months, creating extreme speculative positioning
- Leveraged long liquidation as futures margin calls triggered cascading sell orders from funds that had borrowed to amplify exposure
- Institutional profit-taking at price levels that represented generational highs, locking in returns from the extended rally
- Futures contract rollover mechanics amplifying selling pressure as contracts neared expiration
- U.S. dollar strengthening, which reduces the relative attractiveness of dollar-denominated commodities to international buyers priced in other currencies
Silver's More Extreme Correction: Understanding the Structural Reasons
Silver's decline was proportionally more severe than gold's, and understanding why reveals important structural characteristics of the silver market that investors frequently underestimate. In addition, the gold-silver ratio shifted dramatically during this period, reflecting just how much more aggressively silver corrected relative to its precious metals counterpart.
| Metric | Gold | Silver |
|---|---|---|
| 12-Month Pre-Correction Rally | ~96% | ~278% |
| 2026 Peak Price | ~$5,600/oz | ~$121/oz |
| Post-Peak Low | ~$4,404/oz | ~$71.67/oz |
| Peak-to-Trough Decline | ~21% | ~41% |
Silver had rallied approximately 278% over the prior 12 months, almost three times the percentage advance recorded by gold. A market that rises that aggressively accumulates proportionally greater downside vulnerability. When sentiment shifts, the unwind is correspondingly violent.
Several structural features make silver inherently more volatile than gold during correction phases:
- Higher speculative participation relative to overall market depth, meaning that a smaller shift in institutional positioning creates larger price moves
- Dual demand profile that creates mixed pricing signals during inflationary shocks, since industrial demand headwinds and monetary safe-haven demand can pull in opposite directions simultaneously
- Inverse correlation with the U.S. dollar measured at approximately 93% during this period, amplifying dollar-driven selling pressure
- Thinner liquidity relative to gold futures markets, which magnifies price swings in both directions without requiring large absolute position changes
- Exchange margin increases during volatility events, which force additional liquidation from traders unable to meet elevated collateral requirements
"Silver's correction is not evidence of a broken structural case. It reflects the mathematics of a highly leveraged, thinly traded market correcting from a historically extreme overbought position. The underlying demand drivers related to energy transition and industrial applications have not been fundamentally altered by price action alone."
As BullionVault notes in their analysis of silver and gold around the Hormuz situation, the interplay between geopolitical disruption and precious metals pricing is far more nuanced than conventional safe-haven narratives suggest.
The next major ASX story will hit our subscribers first
Separating the Oil Shock from the Metals Decline
A careful analysis of the timing reveals that the precious metals correction traces back to events in late January and early February 2026, aligning more closely with Federal Reserve policy recalibration signals than with the escalation of Middle East tensions. The Hormuz situation intensified somewhat later in the timeline, meaning the metals decline was already underway before the Strait became the dominant geopolitical narrative.
Federal Reserve forward guidance has a direct and well-established impact on precious metals. When the trajectory of interest rates shifts even marginally toward less accommodation, the opportunity cost of holding non-yielding assets like gold and silver increases relative to yield-bearing instruments. This dynamic, combined with dollar strengthening associated with any hawkish Fed pivot, compresses the relative attractiveness of metals priced in USD.
The result is a commodity landscape in which:
- Oil is rising because of a genuine physical supply shock with no short-term resolution pathway
- The impact on gold and silver prices reflects speculative positioning mechanics, Fed policy signals, and dollar dynamics rather than geopolitical sentiment
- These two narratives are operating simultaneously but through entirely different causal channels
Long-Term Structural Outlook: Three Scenarios Forward
Despite the current correction, the long-term fundamental case for gold has not deteriorated. Central bank gold demand, particularly from BRICS-aligned nations, continues alongside sovereign debt levels in major economies remaining at historically elevated ratios. De-dollarisation trends sustain demand for non-sovereign stores of value, while persistent U.S. fiscal deficits maintain structural currency debasement pressure over medium and long timeframes.
Silver's position is supported by a demand floor that gold does not possess: growing industrial consumption from solar photovoltaic manufacturing, electric vehicle components, and grid infrastructure expansion. Industrial demand does not disappear because futures markets are volatile.
Consequently, three scenario pathways describe the most plausible forward trajectories:
Scenario 1: Hormuz Resolution and Fed Pivot
Oil prices normalise toward $80 to $90 per barrel. Dollar weakens as rate cut expectations return. Gold recovers toward the $5,000 to $5,200 per ounce range. Silver rebounds toward $90 to $100 per ounce as speculative positioning rebuilds.
Scenario 2: Prolonged Disruption and Stagflation
Oil remains above $110 per barrel. Inflation re-accelerates while growth slows. The Federal Reserve faces genuine policy paralysis, unable to cut without worsening inflation or hike without destroying growth. Gold re-tests highs as stagflation hedge demand intensifies. Silver lags due to industrial demand headwinds in a weakening growth environment.
Scenario 3: Escalation to Full Blockade
Brent crude tests $150 per barrel or beyond. Global recession risk rises sharply. An initial liquidation event in precious metals is followed by a sharp recovery as monetary system stress intensifies and physical demand accelerates.
Frequently Asked Questions
Does an oil price spike always push gold lower?
No. The relationship between oil prices and gold is not fixed across all market environments. During inflationary periods when both energy and monetary concerns are elevated simultaneously, gold and oil can rise together as investors seek real asset protection. The 2026 dynamic reflects a specific combination of overbought precious metals positioning meeting an independent geopolitical supply shock, not a reliable recurring pattern applicable to all future cycles.
Why did gold fall when geopolitical risk clearly increased?
Gold had already priced in substantial geopolitical risk premium during its 96% advance over the prior 12 months. When a market becomes this extended, even genuine risk events can trigger profit-taking and liquidation rather than incremental buying. The market had effectively bought forward much of the uncertainty well before the Hormuz situation reached its current intensity.
Is the gold bull market over after a 21% decline?
Historical precedent strongly suggests not. Major commodity bull markets regularly experience corrections of 20 to 30% before resuming structural upward trends. The fact that gold remained approximately 9% positive year-to-date even at the post-correction low supports the interpretation of a correction within an ongoing trend rather than a fundamental trend reversal. The underlying drivers that produced the multi-year bull market have not been removed by the correction itself.
What is the estimated total economic cost of the Hormuz disruption?
Analysts estimate aggregate global economic costs at up to $1 trillion, incorporating fuel price increases, food supply chain disruption, and embedded inflation transmission. Even in a resolution scenario, residual economic drag is estimated at approximately $600 billion, reflecting the difficulty of reversing inflationary dynamics once they have propagated through global supply chains. The full scale of the Strait of Hormuz oil spike and gold silver plunge consequences, therefore, extends well beyond what commodity price charts alone can convey.
This article contains forward-looking statements, price projections, and scenario analyses that are speculative in nature and should not be interpreted as financial advice. Commodity markets involve significant risk, and past performance of any asset class is not indicative of future results. Readers should conduct independent research and consult qualified financial professionals before making investment decisions.
Want to Stay Ahead of the Next Major Commodity Discovery?
While macro forces like the Hormuz oil shock reshape global markets, Discovery Alert's proprietary Discovery IQ model cuts through the complexity by delivering real-time alerts on significant ASX mineral discoveries — turning volatile commodity conditions into actionable investment opportunities. Explore how major mineral discoveries have historically generated extraordinary returns on Discovery Alert's dedicated discoveries page, and begin your 14-day free trial today to position yourself ahead of the market.