
July 24, 2026
When Inventory Numbers Tell Conflicting Stories
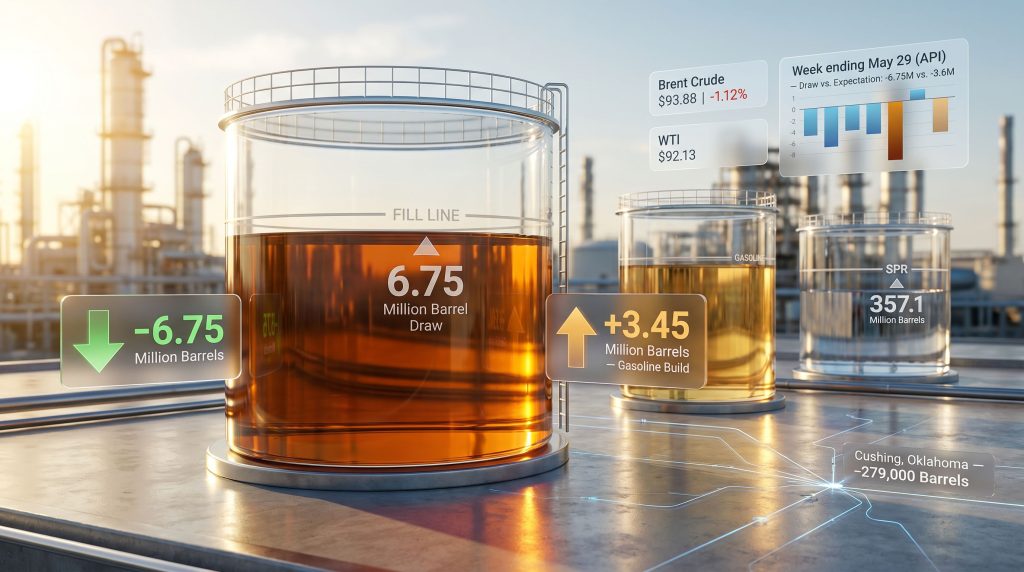
Every week, petroleum markets hold their breath waiting for two numbers: how much crude oil is sitting in storage, and whether that figure beat or missed analyst expectations. But the raw draw or build figure rarely tells the whole story. The week ending May 29, 2026 offered a textbook example of why reading US crude oil inventories and gasoline build data in isolation can mislead even experienced traders. A crude draw of 6.75 million barrels — nearly double what analysts anticipated — coexisted with a gasoline inventory build of 3.45 million barrels, creating one of those structurally contradictory setups that forces market participants to think harder about what the data actually implies.
Understanding why that divergence matters requires stepping back from the headline numbers and examining how the US petroleum inventory reporting system functions, what each data point reveals about supply and demand dynamics, and how figures like Strategic Petroleum Reserve (SPR) releases and Cushing hub stocks quietly shape the picture behind the scenes. For broader context, the crude oil market overview helps frame these weekly movements within longer-term supply and demand cycles.
When big ASX news breaks, our subscribers know first
How Are US Crude Oil Inventory Reports Structured and Why Do They Matter?
The Two-Report System: API vs. EIA
The US petroleum market operates on a two-report weekly cadence that gives traders advance signals before official data arrives. The American Petroleum Institute (API) releases its private-sector estimate each Tuesday afternoon, drawing on voluntary industry reporting. The Energy Information Administration (EIA) then publishes its government-verified Weekly Petroleum Status Report each Wednesday morning, using a combination of surveys and statistical modelling.
| Feature | API Report | EIA Weekly Petroleum Status |
|---|---|---|
| Release Timing | Tuesday afternoon | Wednesday morning |
| Data Source | Industry self-reporting | Survey plus modelling |
| Official Status | Private estimate | Government official |
| Market Impact | Pre-market signal | Confirmed market mover |
Because the API data arrives roughly 18 hours ahead of the EIA's official figures, it functions as a leading indicator. When the two reports diverge significantly, it creates short-term volatility as traders reassess their positions ahead of Wednesday's confirmation.
What the Reports Actually Measure
Both reports track inventory changes across four critical categories:
- Commercial crude oil stocks held at refineries and tank farms
- Gasoline inventories covering both finished product and blending components
- Distillate stocks encompassing diesel fuel and heating oil
- Cushing hub storage representing the physical delivery point for WTI futures contracts
A draw in commercial crude stocks larger than analyst consensus is typically interpreted as bullish for crude prices, while an unexpected build tends to suppress them. However, as the week ending May 29 demonstrated, the relationship between crude draws and gasoline builds can complicate this straightforward interpretation significantly.
What Did the Latest Crude Draw Data Actually Show?
The API estimated that commercial crude inventories declined by 6.75 million barrels in the week ending May 29. This compares with a draw of 2.8 million barrels in each of the two prior weeks and dramatically exceeded analyst expectations of a 3.6 million barrel draw, making the actual result nearly double the consensus forecast.
| Reporting Period | Crude Inventory Change | Analyst Expectation |
|---|---|---|
| Week ending May 15 (API) | -2.8 million barrels | Not specified |
| Week ending May 22 (API) | -2.8 million barrels | Not specified |
| Week ending May 29 (API) | -6.75 million barrels | -3.6 million barrels |
| Year-to-date 2026 | +16 million barrels | Not specified |
The year-to-date figure is critical context that the headline draw number alone obscures. Despite three consecutive weeks of draws, US crude inventories remain 16 million barrels higher than they were at the start of 2026, according to API data. This accumulated surplus creates a buffer that moderates the bullish price impulse that a single week's large draw might otherwise generate. Furthermore, crude oil price trends throughout the year reflect how this kind of inventory overhang can cap upside price momentum even during bullish draw cycles.
This is a subtle but important dynamic: a multi-week draw trend can coexist with a structural inventory overhang, meaning the market is tightening from a position of relative abundance rather than genuine scarcity. The pace and duration of draws matter as much as any individual week's figure.
Why Did Gasoline Inventories Build While Crude Stocks Were Falling?
The 3.45 Million Barrel Build and Its Implications
Gasoline inventories posted a build of 3.45 million barrels in the week ending May 29, reversing the prior week's draw of 3.199 million barrels. This swing of more than 6.6 million barrels across consecutive weeks illustrates how volatile finished-product inventories can be on a week-to-week basis.
The simultaneous occurrence of a large crude draw and a gasoline build is structurally unusual and points toward one primary explanation: refinery throughput increased substantially, converting raw crude into finished gasoline faster than pump-level consumer demand could absorb the output. This is a refinery-driven phenomenon rather than a demand signal.
The Seasonal Context That Changes the Interpretation
Despite the week's build, gasoline inventories were already running 6% below the five-year seasonal average heading into the reporting period, according to EIA data. This matters enormously for interpretation. A gasoline build occurring from a position of below-average seasonal stocks is fundamentally different from a build occurring when inventories are already elevated.
A gasoline inventory build does not automatically signal weak consumer demand. If refineries rapidly increase throughput, processing more crude into finished fuel, output can temporarily exceed retail consumption, creating a short-term stock build even when underlying demand remains healthy relative to seasonal norms.
What Divergence Means for Crack Spreads
When crude draws and gasoline builds occur together, the immediate effect on refining margins — measured through crack spreads — is worth monitoring closely. Crack spreads represent the difference between crude input costs and refined product prices. A gasoline build can compress gasoline crack spreads in the short term while a crude draw simultaneously supports raw material pricing, creating a squeeze on refining profitability. Goldman Sachs has noted expectations for strong refining profits through 2026, suggesting that broader structural tightness in fuel supply is expected to sustain margins despite short-term inventory fluctuations.
How Does the Strategic Petroleum Reserve Factor Into This Equation?
SPR Drawdown and Its Effect on the Inventory Picture
The Strategic Petroleum Reserve recorded a release of 8 million barrels in the week ending May 29, bringing the total SPR volume to 357.1 million barrels — the lowest level recorded since January 2024. At maximum capacity, the SPR can hold approximately 725 million barrels, meaning current holdings sit roughly 368 million barrels below capacity.
| SPR Metric | Current Figure |
|---|---|
| Current SPR Volume | 357.1 million barrels |
| Maximum Capacity | ~725 million barrels |
| Shortfall From Capacity | ~368 million barrels |
| Lowest Level Since | January 2024 |
A Critical Distinction Most Traders Overlook
SPR releases flow directly into the commercial supply chain, which means they can artificially offset or mask demand-driven draws in weekly commercial inventory data. When the government releases 8 million barrels from the SPR in a single week, that volume enters the pipeline system and can appear as crude supply to refineries, effectively reducing the apparent severity of market tightness.
This distinction is one of the least understood aspects of weekly inventory analysis. Commercial crude draws that occur alongside large SPR releases may understate the degree of underlying tightness, because the SPR barrels are filling some of the gap that market demand would otherwise expose. Stripping out SPR activity to examine pure commercial supply and demand dynamics is essential for accurate interpretation.
What Is Happening With US Domestic Crude Production?
US output reached 13.715 million barrels per day for the week ending May 22, a marginal increase from 13.702 million bpd in the prior week. Year-over-year, domestic production has expanded by 314,000 bpd, according to EIA data.
When domestic production climbs alongside falling commercial inventories, it typically signals that consumption or export demand is outpacing supply additions — a structurally tighter market condition than headline inventory numbers alone might suggest. However, the US shale slowdown narrative adds an important caveat here: if drilling activity continues to moderate, future production growth may not keep pace with the current draw trajectory.
Export volumes are an often-overlooked variable in this equation. Rising US crude exports, which have reached historically elevated levels in recent periods, can drain domestic stocks even when production is expanding, creating the somewhat counterintuitive scenario where record output coexists with inventory draws.
The next major ASX story will hit our subscribers first
How Are Distillate and Cushing Hub Inventories Performing?
Distillates: A More Concerning Picture
Distillate inventories fell by 214,000 barrels in the week ending May 29, following a larger decline of 1.1 million barrels in the prior week. More significantly, distillate stocks were already running 11% below the five-year seasonal average as of the week ending May 22, according to EIA data. This is a meaningfully larger deficit relative to seasonal norms than what the gasoline market is experiencing.
Distillates, which include diesel fuel and heating oil, serve as the backbone of industrial and freight transportation demand. A structural deficit of this magnitude heading into peak summer logistics season carries implications for both fuel pricing and broader industrial activity costs.
Cushing Hub: The WTI Pricing Bellwether
Cushing hub inventory declined by 279,000 barrels over the reporting period, following a more substantial draw of 2.875 million barrels in the prior week. Cushing, Oklahoma functions as the designated delivery point for West Texas Intermediate crude futures contracts traded on the NYMEX, which makes its inventory level a direct input into WTI pricing mechanics.
| Product | Weekly Change | Five-Year Average Deviation |
|---|---|---|
| Crude Oil (commercial) | -6.75 million barrels | Above average (YTD +16M bbls) |
| Gasoline | +3.45 million barrels | -6% below seasonal average |
| Distillates | -214,000 barrels | -11% below seasonal average |
| Cushing Hub (WTI delivery) | -279,000 barrels | Not specified |
| Strategic Petroleum Reserve | -8 million barrels | Lowest since Jan 2024 |
When Cushing stocks decline over multiple consecutive weeks, it tightens the physical supply available for contract settlement, which tends to support WTI front-month pricing. Two consecutive weeks of Cushing draws, even if the most recent week's draw was smaller, sustain that directional pressure.
How Did Oil Prices React to the Inventory Data?
In the hours before the EIA report's release on Wednesday morning, Brent crude was trading at $93.88, down 1.12% on the session. WTI was similarly pressured, trading at $92.13, representing a decline of approximately $1.50 from the prior Tuesday's level.
The pre-release price weakness reflected two concurrent bearish forces operating independently of the inventory data itself:
- Market optimism about supply rebalancing — Traders were pricing in expectations that the current supply imbalance would self-correct relatively quickly, reducing the urgency premium embedded in crude prices.
- China demand pessimism — Softening Chinese crude demand was functioning as a structural bearish weight on global benchmarks. Indeed, China demand prospects remain uncertain enough to suppress the demand-growth premium that typically supports Brent and WTI prices during periods of tight supply.
This dynamic illustrates a fundamental principle of commodity markets: inventory data does not trade in isolation. Global macro factors, geopolitical risk premiums, and demand-side narratives simultaneously shape price action, sometimes overriding what the weekly numbers would otherwise suggest.
What the Gasoline Build Signals About Consumer Demand Heading Into Summer
The timing of this gasoline build carries particular significance given that the week ending May 29 falls directly on the cusp of peak US summer driving demand. Memorial Day weekend traditionally marks the unofficial start of the summer gasoline consumption season, during which weekly demand typically reaches its highest levels of the year.
A gasoline inventory build in this precise window can be interpreted in multiple ways:
- Refinery preparation: Operators may have increased throughput aggressively in anticipation of peak demand, front-loading inventory before the seasonal surge
- Demand softness: Consumer spending pressure from elevated prices may have dampened driving activity more than seasonal patterns would predict
- Timing distortion: Holiday-week data can be distorted by scheduling anomalies in both production and retail delivery patterns
The fact that gasoline stocks remain 6% below seasonal averages despite the build suggests the market is not oversupplied at the structural level, even if a single week's refinery output temporarily exceeded retail absorption. The refinery utilisation rate — a figure not always prominently featured in weekly inventory discussions — is the missing variable that would clarify which explanation is most accurate.
The Broader Market Implications of Sustained Crude Inventory Draws
The three-week draw sequence heading into June raises a legitimate question about trajectory. If commercial crude stocks continue drawing down at rates exceeding analyst expectations, the year-to-date surplus of 16 million barrels could be eliminated within weeks, fundamentally shifting the supply narrative from one of relative abundance to genuine tightness.
Rystad Energy has noted that geopolitical escalation scenarios involving major producing regions could drive oil prices to levels significantly above current benchmarks within months. While such scenarios involve meaningful uncertainty and should be treated as tail risks rather than base cases, they illustrate how quickly the inventory picture can shift when supply disruptions layer on top of an already-tightening trend.
OPEC+ production decisions add another critical variable to this equation. If the alliance responds to tightening US inventories and elevated prices by increasing output, it could offset the bullish inventory signal. Conversely, production discipline from OPEC+ combined with continued US crude oil inventories and gasoline build dynamics would amplify upward price pressure considerably. Reuters has reported on similar inventory divergence patterns in preceding weeks, providing useful comparative context for understanding the current data cycle.
Disclaimer: This article is for informational and educational purposes only. Nothing contained here should be construed as investment advice, a recommendation to buy or sell any security, or a solicitation of any kind. Commodity markets involve significant risk, and past price behaviour is not indicative of future results. Readers should conduct their own research and consult qualified financial advisors before making investment decisions.
Frequently Asked Questions: US Crude Oil Inventories and Gasoline Builds
What Does a Crude Oil Inventory Draw Mean for Prices?
A crude oil inventory draw — where stored volumes decline week-over-week — generally signals that demand is outpacing supply, which tends to be bullish for crude prices. However, the magnitude of the draw relative to analyst expectations matters significantly. A draw that substantially exceeds consensus forecasts typically generates a stronger upward price response than one that falls short or merely matches expectations.
Why Can Gasoline Inventories Build While Crude Stocks Are Falling?
This occurs when refineries increase their crude processing rates, converting more raw oil into finished gasoline faster than consumer demand absorbs the output. The result is a temporary accumulation of gasoline stocks even as crude oil volumes decline at the commercial storage level. This is a throughput phenomenon, not necessarily a demand weakness signal.
What Is the Strategic Petroleum Reserve and How Does It Affect Commercial Inventories?
The SPR is a federally managed emergency oil stockpile maintained in underground salt caverns along the US Gulf Coast. When volumes are released from the SPR, those barrels enter the commercial supply chain, which can offset or partially mask underlying demand-driven inventory draws in the weekly commercial data. Analysts who do not account for SPR releases risk misreading the true tightness of the physical market.
What Is Cushing, Oklahoma, and Why Does It Matter for WTI Pricing?
Cushing is the designated delivery point for West Texas Intermediate crude oil futures contracts traded on the NYMEX. Inventory levels at Cushing directly influence WTI pricing because they represent the physical supply available for futures contract settlement. Declining Cushing stocks tend to support WTI prices, while inventory builds at the hub can weigh on the front-month contract.
What Does It Mean When Distillate Stocks Are 11% Below the Five-Year Average?
Distillates — covering diesel and heating oil — running significantly below seasonal averages indicate a tighter supply cushion heading into periods of peak demand. A deficit of this magnitude can support distillate prices and refining margins independently of what is happening in the crude or gasoline markets, and may signal broader tightness across the wider petroleum complex.
Want to Catch the Next Big Resource Discovery Before the Market Does?
Discovery Alert's proprietary Discovery IQ model delivers real-time alerts on significant ASX mineral discoveries — cutting through complex data to surface actionable opportunities the moment they hit the exchange, much like how savvy energy investors analyse divergent inventory signals before the broader market catches on. Explore how historic mineral discoveries have generated extraordinary returns and begin your 14-day free trial today to position yourself ahead of the market.