
June 4, 2026
The Hidden Anatomy of a Global Energy Crisis in Plain Sight
Most market participants think about oil price risk through the lens of OPEC's influence on oil production decisions, U.S. shale output, or Chinese demand cycles. Rarely does the conversation focus on the single geographic feature that sits beneath all of these variables like a fault line: a narrow, 33-kilometre-wide waterway at the mouth of the Persian Gulf. The Strait of Hormuz oil supply risk is not a hypothetical tail event reserved for geopolitical textbooks. It is an active, compounding vulnerability that the market has systematically underpriced, obscured by inventory buffers, narrative distractions, and a cognitive bias that assumes tomorrow will resemble yesterday.
Understanding why that assumption is increasingly dangerous requires moving beyond headline statistics and into the structural mechanics of global energy flow, supply chain interdependency, and the investment consequences of a world where molecular scarcity is no longer theoretical.
When big ASX news breaks, our subscribers know first
Why the Strait of Hormuz Is the World's Most Critical Energy Chokepoint
Geography, Volume, and the Architecture of Vulnerability
The Strait of Hormuz occupies a unique position in global energy infrastructure that no other maritime corridor can replicate. Sitting between the Omani coastline and the Iranian shore, the navigable channel used by laden tankers is only a few kilometres wide in each direction, threading through waters that are geopolitically contested, militarily monitored, and physically constrained. Unlike broader sea lanes such as the Malacca Strait or the Cape of Good Hope routing, Hormuz has no natural geographic alternative. You either pass through it or you do not pass at all.
What makes Hormuz categorically different from other maritime chokepoints is the sheer concentration of producing nations that depend on it as their only viable export corridor. Saudi Arabia, Iraq, Kuwait, the UAE, Qatar, Bahrain, and Iran all rely on Hormuz to varying degrees for their petroleum exports. There is no realistic scenario in which these nations simultaneously reroute meaningful volumes through alternative land or maritime passages in a short timeframe.
20 Million Barrels Per Day: The Scale of Exposure
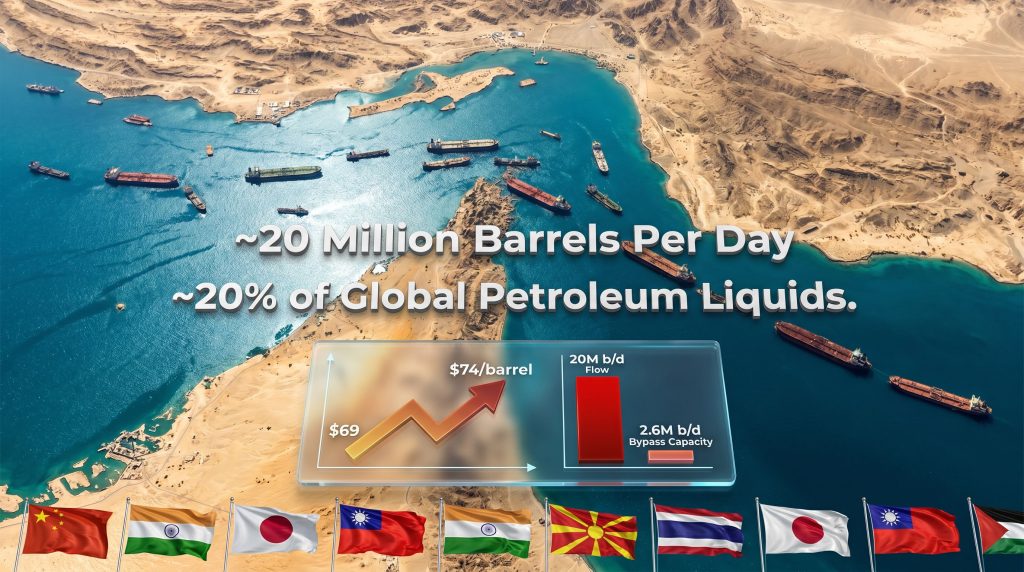
The volumes transiting Hormuz daily place this strait in an entirely different risk category from every other energy chokepoint on the planet. Approximately 20 million barrels per day of petroleum liquids moved through the strait in 2024, representing roughly 20% of all globally traded petroleum liquids. To contextualise that figure: removing Hormuz from the equation would be the equivalent of eliminating the combined daily oil consumption of the United States and the European Union simultaneously.
The market registered a preview of how price-sensitive this corridor is when elevated regional tensions in 2024 pushed Brent crude from approximately $69 to $74 per barrel in a single session, a roughly 7% move on sentiment alone, with no actual disruption to physical flow. Furthermore, according to Oxford Economics, the risks to global energy prices from a sustained closure extend well beyond crude oil benchmarks.
| Metric | Figure |
|---|---|
| Daily oil flow through Hormuz (2024) | ~20 million barrels/day |
| Share of global petroleum liquids | ~20% |
| Available pipeline bypass capacity | ~2.6 million b/d |
| Gap between flow and bypass capacity | ~17.4 million b/d |
| Brent crude one-day price move (recent tensions) | $69 to $74/barrel |
How Much Oil Actually Flows Through the Strait of Hormuz?
Beyond Crude: The Commodities the Market Forgets
The narrow focus on crude oil in Hormuz disruption analysis obscures a much broader set of commodity vulnerabilities that rarely feature in mainstream financial commentary. The Strait of Hormuz corridor is a critical transit route for ammonia precursors used in nitrogen fertilizer production, the global helium supply crisis sourced primarily from Qatari natural gas processing, and aluminium smelting inputs. Approximately 12% of globally traded aluminium smelting activity has direct exposure to this region, a figure that rarely appears in energy disruption scenario models.
This multi-commodity exposure means that a sustained disruption to Hormuz transit does not simply create an oil price shock. It simultaneously compresses the availability of industrial feedstocks across agriculture, aerospace, electronics manufacturing, and metals production. The second and third-order effects cascade through supply chains in ways that are structurally underappreciated by generalist investors whose risk models are calibrated primarily to crude oil benchmarks.
Is Bypass Infrastructure Enough to Offset a Hormuz Disruption?
The 2.6 Million Barrel Problem
The most important number in any honest analysis of Hormuz bypass capacity is not how much pipeline infrastructure exists, but how large the gap is between that capacity and actual transit volumes. The two principal bypass routes, Saudi Arabia's East-West Pipeline (Petroline) and the UAE's Habshan-Fujairah line, together provide a combined theoretical throughput capacity of approximately 2.6 million barrels per day. That figure represents less than 15% of normal Hormuz transit volumes, leaving a structural deficit of more than 17 million barrels per day with no viable alternative routing.
Can pipelines replace Hormuz oil flows? No. Existing pipeline bypass capacity totals approximately 2.6 million barrels per day. This represents less than 15% of the 20 million barrels per day that normally transit the strait, leaving a structural gap of more than 17 million barrels per day with no viable alternative route.
Announced pipeline bypass projects, while directionally logical as long-term infrastructure investments, cannot address a near-term crisis. Engineering timelines, financing structures, land rights, and construction logistics mean that new capacity is measured in years to decades, not weeks to months. For investors and policymakers assessing Hormuz risk on a 6-to-24-month horizon, bypass infrastructure is largely irrelevant as a mitigation tool.
Which Countries Face the Greatest Risk If the Strait of Hormuz Is Disrupted?
Asia's Structural Import Dependency
The geographic distribution of Hormuz exposure is heavily skewed toward Asian importing nations, whose refinery infrastructure and long-term supply contracts are deeply integrated with Gulf crude grades. China, India, Japan, and Taiwan collectively represent the most concentrated vulnerability surface in any Hormuz disruption scenario.
China's position is complicated by the opacity of its Strategic Petroleum Reserve drawdown data, making it genuinely difficult for market participants to assess how much of China's reduced import activity in recent periods reflects genuine demand softness versus accelerated buffer depletion. The trade war oil impact adds a further layer of complexity to modelling China's true import requirements.
| Country | Hormuz Dependency | Key Vulnerability |
|---|---|---|
| China | Very High | Crude imports and SPR opacity |
| India | Very High | Refinery feedstock concentration |
| Japan | High | Near-total import reliance |
| Taiwan | High | Limited domestic energy production |
| Germany | Moderate | Refined product and LNG indirect exposure |
| United States | Low to Moderate | Domestic production buffer; SPR drawdown risk |
Europe's Indirect Exposure and LNG Competition
European nations face a different but still significant vulnerability profile. During the 2022 to 2023 natural gas crisis following the disruption of Russian pipeline supply, European buyers demonstrated their capacity to rapidly outbid developing-world LNG consumers by deploying printing capacity to secure cargoes.
That same dynamic would reassert itself in a Hormuz disruption scenario, with the critical difference that LNG from Qatar, which transits Hormuz, represents a meaningful component of global LNG supply. Nations in South Asia and Southeast Asia that depend on Qatari LNG imports would face severe displacement, with political and social consequences that extend well beyond energy markets.
Are Strategic Petroleum Reserves Actually Masking the True Supply Situation?
The Buffer Illusion
Strategic petroleum reserves were designed as emergency buffers against temporary supply disruptions. Their current role in moderating market perceptions of Hormuz risk is something qualitatively different: a structural substitute for supply that is not actually flowing. When SPR drawdowns become a routine component of daily supply balances rather than an exceptional emergency tool, they effectively mask the deterioration of the underlying supply-demand equilibrium.
Monitoring EIA and API inventory data over recent weeks has revealed what some energy analysts describe as unusually large crude draws, a consistent directional signal that the buffer capacity sustaining market stability is being consumed rather than replenished. The situation is further complicated by China's opaque reserve management. China holds over one billion barrels in strategic reserve capacity, but reports nothing about drawdown activity, leaving market participants to infer its consumption of stored oil through the gap between observable import volumes and estimated domestic demand.
Reading the Leading Indicators
Several converging data streams can help investors identify when buffer capacity is approaching exhaustion. No single indicator provides a precise timeline, but consistent deterioration across multiple signals historically precedes supply-driven price dislocations.
The indicators worth monitoring include:
- EIA crude draw data: consecutive large weekly draws signal accelerating buffer consumption
- Crack spread compression: narrowing refinery margins indicate downstream product stress
- Diesel and jet fuel inventory levels: product stocks consistently below five-year seasonal averages signal tightening
- Chinese import volumes: deviations from normal seasonal patterns may indicate SPR utilisation
Product inventories across diesel, jet fuel, and gasoline are currently tracking well below five-year averages in multiple regions. Crack spreads, which measure the profitability of converting crude oil into refined products, serve as a leading indicator of downstream stress that often moves ahead of headline crude price signals. The convergence of these indicators does not predict a precise crisis date, but the directional signal is consistent and deteriorating.
As one independent energy commentator has framed the situation, the dynamic resembles a ship sailing west: the destination is knowable even if the arrival date is not. Supply constraints are building, buffers are being drawn down, and at some point the accumulation of these pressures will manifest in market pricing that the current narrative environment has not yet incorporated.
The next major ASX story will hit our subscribers first
What Happens to Oil Prices If the Strait of Hormuz Is Disrupted?
Three Scenario Pathways
The range of possible oil price outcomes under different disruption scenarios spans from manageable to economically catastrophic. The scenarios below are analytical constructs for risk-framing purposes and should not be interpreted as price forecasts. Actual outcomes would depend on the duration, severity, and geopolitical context of any disruption. The EIA's energy data provides useful historical context for understanding how supply shocks have translated into price outcomes in previous disruption events.
| Scenario | Description | Estimated Oil Price Impact |
|---|---|---|
| Elevated Tension (No Blockage) | Continued conflict risk premium without physical disruption | $75 to $95/barrel range |
| Partial Disruption | Reduced tanker transit, insurance cost surge | $100 to $130/barrel |
| Extended Closure | Full or near-full transit halt | $150+/barrel; rationing risk |
Disclaimer: These scenarios are illustrative frameworks for risk analysis only. They do not constitute investment advice or price forecasts. Energy markets involve complex, dynamic variables that cannot be reliably predicted.
The Barnacle Problem: Why Recovery Is Not Instant
A broadly underappreciated feature of any Hormuz disruption recovery scenario is the logistical condition of the tanker fleet itself. Ships that have been stationary or operating under constrained conditions in 32 to 33 degree Celsius Persian Gulf waters accumulate significant hull fouling from barnacle growth, sea chest deterioration, and general vessel degradation.
Even in a scenario where geopolitical resolution occurred rapidly, the tanker fleet servicing Gulf export routes would require extensive dry-docking or dive servicing across potentially hundreds of vessels before they could safely and efficiently resume normal operations. This logistical bottleneck would delay any meaningful supply recovery by weeks to months beyond the political resolution date, creating a lag between diplomatic normalisation and physical market restoration that pricing models consistently underestimate.
A Structural Risk Premium Is Now Embedded
Regardless of how specific disruption scenarios resolve, the case for a permanently higher geopolitical risk premium in oil pricing has strengthened materially. The combination of sustained regional instability, demonstrated vulnerability of maritime energy transit, and the erosion of confidence in rapid restoration of normal operations creates a structural floor beneath oil prices that did not exist with the same intensity a decade ago.
How Are Global Food Systems Connected to the Strait of Hormuz Risk?
The Hydrocarbon Foundation of Modern Agriculture
The connection between Persian Gulf energy flows and global food security is not intuitive to most investors, but it is mechanistically direct. Modern industrial agriculture is deeply dependent on hydrocarbon inputs, not merely for fuel to power farm equipment, but as the fundamental chemical feedstock for nitrogen fertilizer production.
The Haber-Bosch process, which synthesises ammonia from nitrogen and hydrogen, requires substantial natural gas inputs. Ammonia is the precursor to urea, the most widely used nitrogen fertilizer globally. The energy intensity of this production chain means that any sustained disruption to Gulf natural gas flows compresses fertilizer availability, which in turn suppresses achievable crop yields per hectare.
Farmer Behaviour Signals Forward Stress
Field-level data already shows meaningful behavioural shifts in response to fertilizer cost pressures. In the United States, more than 50% of farmers reportedly failed to apply sufficient input volumes to their crops in the current growing cycle. The economic response to elevated nitrogen fertilizer costs has been a structural rotation away from corn, which is a heavy nitrogen user, toward soybeans, which fix atmospheric nitrogen through root biology and require less synthetic fertilizer input.
This planting shift creates a bifurcated commodity price outcome: corn and wheat facing upward price pressure from both reduced acreage and lower per-acre yields, while soybeans face potential oversupply from the rotation. Investors tracking agricultural commodity exposure need to model this asymmetry rather than assuming uniform food inflation across all crop categories.
From Price Shock to Political Instability
The political transmission mechanism of food price inflation differs fundamentally across income levels. In high-income economies, a 20 to 40% increase in food prices creates electoral discontent and voting behaviour changes, but does not threaten social stability. In lower-income economies with thin household financial buffers, the same price increase can trigger the kind of civil unrest and political instability that historically has preceded government collapses and regional contagion effects. The agricultural consequences of sustained Hormuz disruption therefore carry geopolitical risk implications that extend well beyond the energy sector itself.
What Does Structural Energy Supply Constraint Mean for Long-Term Investors?
The Molecule Shortage Thesis
The investment opportunity embedded in this analysis does not rest on predicting the specific timing or severity of a Hormuz disruption. It rests on a more fundamental observation: the global economy is entering a period of structural molecular scarcity across energy and critical minerals, a condition created not by geological depletion but by more than a decade of systematic underinvestment in extraction, processing, and infrastructure.
The copper supply crunch exemplifies this dynamic with particular clarity. The volume of copper that must be mined over the next 20 years to satisfy electrification and infrastructure demand exceeds the total quantity of copper extracted throughout all of recorded human history up to this point. The copper exists geologically, but it is increasingly located in lower-grade deposits, in more challenging jurisdictions, and at greater depth, requiring more capital, more time, and more technical expertise to bring into production. The era of abundant, cheap copper is structurally over.
The Critical Minerals Map as an Investment Framework
The U.S. Geological Survey's critical minerals list functions as a forward-looking capital allocation map for investors willing to look beyond the dominant technology sector narrative. The critical minerals demand story includes tungsten, antimony, rare earth elements, uranium, nickel, and a range of other materials where supply deficits are widening against demand curves driven by energy transition infrastructure, defence applications, and advanced manufacturing.
The investment logic does not depend on government spending programmes succeeding in resolving these deficits. It depends on the near-certainty that trillions of dollars will be deployed in the attempt. The spending itself creates the opportunity, irrespective of whether the underlying supply problems are ultimately solved within the investment horizon.
The S&P 500 Valuation Gap
The structural energy and resource opportunity is thrown into sharper relief by the current composition of major equity indices. Technology stocks now represent approximately 40% of the S&P 500 by market weight, while the entire energy sector accounts for roughly 3 to 4% of index weight. For investors with a ten-year horizon, this valuation disparity, combined with structural supply constraints across energy and critical minerals and the compounding of geopolitical risk premiums, creates a potentially asymmetric positioning opportunity in resource equities relative to the concentration risk embedded in technology sector exposure.
This represents an analytical observation about relative valuations and should not be construed as investment advice. Past sector performance does not predict future outcomes.
Is the AI Infrastructure Boom Actually Bullish for Energy Demand?
Data Centres and the Second-Order Energy Demand Story
The artificial intelligence infrastructure buildout is universally discussed as a technology and semiconductor story. It is more accurately understood as an energy demand story. Large-scale AI training and inference operations require massive, continuous power draw serviced by gas turbines, grid connections, and in some cases dedicated generation assets.
The companies building this infrastructure are transitioning from asset-light software businesses with near-zero marginal costs to capital-intensive infrastructure businesses with ongoing fuel and maintenance requirements. This transition has direct implications for margin structures, as a software business that adds an additional subscriber at effectively zero marginal cost operates at fundamentally different economics than one building power plants, purchasing gas turbines, and managing substation infrastructure.
Owning the Molecules, Not the Models
The more durable investment insight from the AI infrastructure buildout is positional: regardless of which AI platform ultimately wins market share, and regardless of which chip architecture dominates the next generation of model training, all of these systems require molecules. Natural gas for power generation. Copper for electrical infrastructure. Uranium for the nuclear power plants that several technology companies are now pursuing as baseload solutions.
The investor who owns the distribution and transportation infrastructure for natural gas, or the miners producing the copper and uranium that power these data centres, captures value from the AI buildout without taking concentrated exposure to the winner-takes-all dynamics of model competition or the margin compression risk of asset-heavy technology businesses.
Are Technology and Chip Stocks the Most Dangerously Overowned Asset Class?
The Internet Bubble Parallel
The behavioural characteristics of the current technology and semiconductor investment cycle share structural similarities with the 1998 to 2000 internet bubble that are worth examining carefully. Specifically: the FOMO-driven price expansion detached from fundamental earnings support, the concentration of capital into a narrow cohort of high-profile names, and the narrative insistence that traditional valuation frameworks do not apply to transformational technology.
Individual semiconductor stocks have recorded multi-year price appreciation cycles that, while producing extraordinary short-term returns for holders, embed increasingly fragile earnings multiple assumptions about future growth trajectories. History suggests that commodity-grade chip manufacturers are not immune to valuation mean reversion during periods of broader risk repricing.
Margin Compression and the Capital Expenditure Arms Race
The declared posture of leading technology companies, that AI infrastructure spending represents an existential competitive necessity rather than a discretionary investment, has a specific financial consequence. Once asset-light software businesses begin building power generation assets, constructing undersea cables, and purchasing nuclear reactors, their capital expenditure profiles begin to resemble utilities and industrials rather than software companies. The market's willingness to price these businesses on software-style multiples while they operate with infrastructure-style balance sheets represents a valuation framework inconsistency that will eventually require resolution.
How Should Investors Position for a Prolonged Hormuz Risk Environment?
Portfolio Construction Under Geopolitical Supply Uncertainty
The risk framework emerging from this analysis suggests a set of positioning principles rather than specific investment recommendations. The core thesis is directional: favour exposure to physical molecules and the infrastructure that moves them, reduce concentration in high-multiple technology assets where margin compression risk is underappreciated, and build positions in critical minerals producers across multiple commodity classes.
Strategic Positioning Checklist:
- Energy producers with production exposure outside the Gulf corridor
- LNG infrastructure and transportation assets
- Critical minerals producers across copper, uranium, and rare earth elements
- Agricultural commodity exposure and fertilizer supply chain positioning
- Frontier markets with compounding GDP growth trajectories and low correlation to Western risk events
- Reduce concentration in technology and semiconductor names carrying elevated valuation multiples
- Monitor SPR drawdown data, crack spreads, and product inventory levels relative to five-year seasonal averages as leading indicators of supply stress
Frontier Markets as Diversification Anchors
Beyond the resource and energy thesis, frontier markets with strong demographic profiles, low debt levels, and accelerating institutional development offer a structural diversification opportunity for investors seeking exposure to compounding GDP growth with low correlation to the geopolitical and valuation risks concentrated in Western equity markets. Central Asian economies undergoing institutional reform, Southeast Asian manufacturing hubs absorbing supply chain diversification flows, and Latin American resource economies approaching political inflection points all warrant active monitoring within this framework.
FAQ: Strait of Hormuz Oil Supply Risk
What percentage of global oil supply passes through the Strait of Hormuz?
Approximately 20% of globally traded petroleum liquids transited the Strait of Hormuz in 2024, equating to roughly 20 million barrels per day.
What is the bypass pipeline capacity if the strait is disrupted?
Existing bypass capacity through Saudi Arabia's East-West Pipeline and the UAE's Habshan-Fujairah line totals approximately 2.6 million barrels per day, less than 15% of normal transit volumes.
Which countries are most vulnerable to a Hormuz closure?
China, India, Japan, and Taiwan face the highest direct exposure due to their dependence on Gulf crude imports. European nations carry indirect exposure primarily through LNG and refined product markets.
How quickly could oil prices rise if the strait were blocked?
Recent market history shows that elevated geopolitical tension alone, without any physical disruption, produced a single-session Brent crude move from approximately $69 to $74 per barrel. A partial or extended physical disruption could produce price outcomes ranging from $100 to $130 per barrel in a partial scenario to $150 or above in an extended closure scenario, based on analytical frameworks. These figures are illustrative, not forecasts.
What other commodities beyond oil are at risk from a Hormuz disruption?
Helium, ammonia fertilizer precursors, and aluminium smelting inputs all carry material Hormuz corridor exposure. Approximately 12% of globally traded aluminium smelting activity is linked to this region.
How do strategic petroleum reserves affect the market's response to a Hormuz crisis?
SPR drawdowns can temporarily offset reduced physical supply by releasing stored crude into the market. However, when drawdowns become structural rather than emergency measures, they mask deteriorating supply-demand fundamentals rather than resolving them. China's opaque reserve management adds additional uncertainty to assessments of true buffer capacity.
What is the geopolitical risk premium and how is it priced into oil markets?
The geopolitical risk premium represents the additional price that oil markets embed to compensate for the probability of supply disruption from political instability or conflict. Following sustained regional tensions in the Persian Gulf, independent analysts broadly expect this premium to become structurally embedded in oil pricing rather than reverting to pre-conflict baseline levels.
Repricing Risk in a World Where the Strait of Hormuz Is No Longer Guaranteed
From Complacency to Structural Repricing
The market's current posture toward Strait of Hormuz oil supply risk reflects a cognitive asymmetry: the consequences of disruption are enormous, but the probability has been systematically discounted by investors and analysts whose frameworks are calibrated to historical normalcy rather than the changed geopolitical environment. This is not a fringe analytical position. It is a straightforward observation about how risk premiums behave when geopolitical conditions shift structurally rather than cyclically.
The indicators converging across crude inventory draws, product inventory levels, SPR utilisation, fertilizer input volumes, and refinery crack spreads paint a picture of a system moving toward stress, not away from it. The precise timing of when that stress becomes visible in headline prices remains uncertain, but the directional signal across multiple independent data streams is consistent.
The Asymmetric Opportunity
For investors willing to engage with the analysis rather than defer to dominant narratives, the structural repricing of molecule scarcity across energy and critical minerals represents a potentially generational opportunity. The underweighting of energy in major indices, the multi-decade underinvestment in extraction infrastructure, and the compounding demand pressures from electrification, AI infrastructure buildout, and emerging market development all converge on the same conclusion: physical supply of critical resources is constrained, underinvested, and mispriced relative to paper claims on future technology earnings.
The path to capturing that opportunity runs through understanding the mechanics of what actually flows through the strait, what happens when it does not, and which assets benefit from both the disruption scenario and the structural supply constraint thesis regardless of how geopolitical events ultimately resolve.
Readers seeking additional perspectives on global energy supply risk, critical minerals investing, and frontier market dynamics can explore further commentary through the Triangle Investor Interviews podcast series on YouTube, featuring independent investor and newsletter writer John Palamy discussing actionable intelligence across energy, resource, and frontier market themes.
Want to Position Ahead of the Next Major Mineral Discovery?
Discovery Alert's proprietary Discovery IQ model delivers real-time alerts on significant ASX mineral discoveries — cutting through complex data to surface actionable investment opportunities across energy, critical minerals, and resources the moment they are announced. Explore historic examples of major discoveries and their market returns, then start your 14-day free trial to gain a market-leading edge before the broader market catches on.