May 15, 2026
The Trump ultimatum on Strait of Hormuz has intensified global energy market volatility as geopolitical tensions reshape fundamental supply chain architectures. The complex interplay between strategic chokepoints, military escalation, and economic interdependence creates cascading effects that extend far beyond immediate price fluctuations. Understanding these dynamics requires analysing multiple scenario pathways and their potential outcomes across different timeframes.
Understanding the Critical Energy Transit Chokepoint
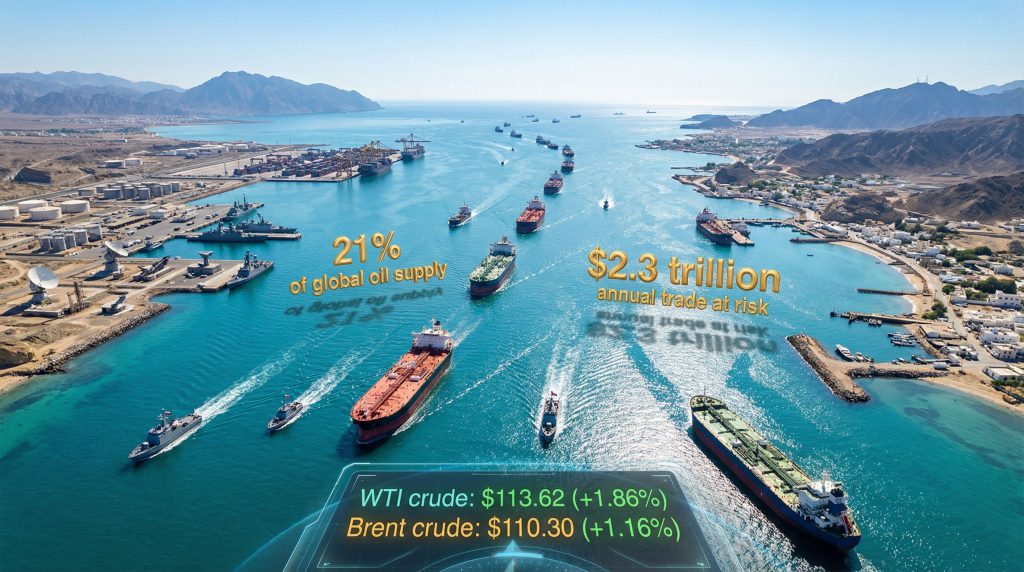
The Strait of Hormuz represents the world's most strategically significant maritime passage, handling approximately 21% of globally traded petroleum and 18% of liquefied natural gas exports. This narrow waterway, measuring just 34 nautical miles at its widest point with navigable channels of only 2-3 nautical miles per direction, processes roughly 35-40 million barrels per day during normal operations.
Key Transit Statistics:
| Metric | Normal Volume | Current Impact | Economic Significance |
|---|---|---|---|
| Daily Oil Flow | 35-40 million barrels | Severely restricted | $700 billion-$1 trillion annually |
| LNG Exports | 18% of global trade | Alternative routes required | Critical for European energy security |
| Shipping Frequency | 21,000 transits annually | Emergency protocols activated | 400% insurance premium increases |
The economic implications extend beyond immediate commodity pricing. Regional economies dependent on energy exports face fundamental disruptions to revenue streams, while importing nations confront supply chain reconfiguration costs estimated at $2-4 billion industry-wide for permanent route diversification.
Furthermore, alternative routing through the Cape of Good Hope adds approximately 4,000 nautical miles and 10-14 additional days to shipping schedules. This geographical reality creates sustained cost pressures including:
- Transportation costs: 15-25% premium over standard routing
- Fleet expansion requirements: 8-12% increase in global tanker capacity
- Infrastructure investments: $15-25 billion in refining and storage capacity
When big ASX news breaks, our subscribers know first
Strategic Scenario Analysis Framework
How Will Diplomatic Resolution Unfold?
Historical precedents suggest diplomatic resolutions typically require 6-18 months of negotiations with third-party mediation. The 1987-1988 Tanker War resolution provides relevant context, where UN-brokered agreements restored normal operations after approximately 18 months of disruption.
Market stabilisation during diplomatic scenarios follows predictable patterns. For instance, the current oil price rally demonstrates similar volatility patterns seen in previous crises:
- Price normalisation timeline: 6-12 months for gradual decline
- Supply confidence threshold: 90%+ of pre-disruption levels required
- Oil price stabilisation range: Historical precedent suggests $85-90/barrel following resolution
Key requirements for successful diplomatic outcomes include international monitoring mechanisms through naval patrols, economic concessions addressing underlying sanctions concerns, and multilateral institutional agreements extending beyond immediate crisis resolution.
What Are the Military Escalation Risks?
Military intervention scenarios carry significantly higher economic and geopolitical risks. The 1990-1991 Gulf War provides instructive precedent, where complete supply disruption affected 4.3 million barrels per day for 6-7 months.
Historical Military Crisis Impacts:
| Conflict | Duration | Peak Price (Nominal) | 2024 USD Equivalent | Recovery Period |
|---|---|---|---|---|
| Gulf War (1990) | 6-7 months | $40/barrel | ~$100/barrel | 12 months |
| Iran Revolution (1980) | 12-18 months | $40/barrel | ~$120/barrel | 18 months |
| Arab Oil Embargo (1973) | 5 months | $12/barrel | ~$65/barrel | 24 months |
Complete strait closure scenarios project potential escalation to $150+/barrel with sustained military action lasting 30-90 days. However, this would likely trigger significant changes in US drilling activity as producers rush to increase output.
Prolonged Standoff Configuration
Extended confrontation without full military engagement creates sustained market volatility. The 2010-2012 Iran sanctions period demonstrated oil price ranges of $85-125/barrel during prolonged uncertainty.
Structural market adaptations during extended crises include fleet expansion requirements of 50-70 additional tankers at $80-120 million each, route diversification, and regional refining capacity investments.
Energy Market Response Mechanisms
Real-Time Price Dynamics
Current market conditions reflect extreme volatility patterns. West Texas Intermediate reached $113.62 while Brent crude approached $110.30, representing significant increases from pre-crisis baselines. These levels approach historical peaks established during the 2008 financial crisis when oil reached $147/barrel.
In addition to oil markets, natural gas trends show correlated volatility as energy markets move in tandem during geopolitical crises.
Volatility Index Comparisons:
- Energy sector VIX: Currently at decade highs
- 2010-2012 sanctions period: VIX range of 15-40
- 2022 Ukraine conflict: Similar price shock patterns with rapid escalation
Supply Chain Emergency Protocols
US Shale Production Response:
American unconventional oil producers demonstrated rapid response capabilities during previous crises. Current capacity parameters include:
- Baseline production: 13.4 million barrels/day as of 2023
- Emergency surge capacity: 1-2 million barrels/day within 4-6 weeks
- Sustainability factors: Accelerated production schedules reduce long-term field productivity
Strategic Reserve Deployments:
Historical Strategic Petroleum Reserve releases demonstrate governmental response capabilities:
- Gulf War (1990-1991): 33.75 million barrels over 6 months
- Hurricane Katrina (2005): 30 million barrel emergency release
- Ukraine Crisis (2022): 180 million barrels (largest historical programme)
- Current US capacity: Approximately 714 million barrels available
OPEC+ Strategic Positioning and Market Influence
The Organisation of Petroleum Exporting Countries announced a 206,000 barrel/day production adjustment effective May 2026, following an April 5 virtual meeting of eight member nations including Saudi Arabia, Russia, Iraq, UAE, Kuwait, Kazakhstan, Algeria, and Oman.
Saudi Arabia's Balancing Strategy
Saudi Arabia maintains complex strategic calculations balancing multiple competing interests. Moreover, OPEC's market influence becomes crucial during such geopolitical tensions:
- Production capacity: Approximately 9-10 million barrels/day representing 30% of OPEC output
- Revenue sensitivity: Each $1/barrel price increase generates $10-12 billion additional annual revenue
- US security relationship: Strategic partnership valued at $40-60 billion annually in military cooperation
- Regional stability concerns: Avoiding isolation while supporting price floors
Russia's Market Leverage Tactics
Russian strategic positioning during crisis periods demonstrates consistent patterns including production baseline of 10-11 million barrels/day capacity and successful export redirection to Asian markets during sanctions periods.
Long-Term Geopolitical Restructuring
Regional Power Balance Transformation
Iran's strategic calculations centre on maintaining leverage through chokepoint control. Since the 1979 Islamic Revolution, Iranian leadership has repeatedly threatened strait closure during periods of international pressure, including significant incidents in 2011-2012, 2019, and 2020.
The Trump ultimatum on Strait of Hormuz represents the latest escalation in this pattern. Iran's response highlights the complex trade war impacts that ripple through global energy markets when major powers clash over strategic assets.
Iranian Leverage Mechanisms:
- Naval asymmetric capabilities: Small fast-attack craft and anti-ship missile systems
- Geographic advantages: Proximity providing tactical reaction time benefits
- Economic pressure responses: Oil export revenues reduced 60-80% under sanctions (2018-2024)
- Regional proxy networks: Multiple pressure points without direct attribution
Gulf Cooperation Council Repositioning
Gulf states face fundamental reassessment of security architectures. Consequently, the UAE strategic positioning balances US alliance with regional stability requirements, while Qatar's energy security involves LNG export infrastructure vulnerability assessments.
Investment Strategy Framework During Crisis
Short-Term Tactical Positioning
Energy futures markets demonstrate extreme backwardation conditions, where near-term contracts trade at significant premiums to longer-dated deliveries. This structure indicates market expectations of near-term supply shortages with eventual normalisation.
Tactical Investment Considerations:
- Energy futures exposure: Backwardation provides potential arbitrage opportunities
- Shipping sector positioning: Tanker companies benefiting from route diversification premiums
- Defence contractor allocation: Regional military spending acceleration anticipated
- Currency hedging strategies: Dollar strengthening on safe-haven demand
Long-Term Structural Investment Themes
Crisis periods accelerate fundamental energy infrastructure transformation through alternative energy systems acceleration, pipeline network expansion, and regional refining capacity development.
Risk Assessment Matrix:
| Risk Factor | Probability Assessment | Potential Impact | Mitigation Strategies |
|---|---|---|---|
| Complete strait closure | 35% likelihood | Extreme market disruption | Diversified supply agreements |
| Regional conflict expansion | 45% probability | Sustained high prices | Alternative energy acceleration |
| Diplomatic resolution | 60% baseline scenario | Gradual normalisation | Strategic reserve coordination |
| Military escalation | 25% worst-case | Global recession risk | International intervention |
The next major ASX story will hit our subscribers first
Historical Precedent Analysis
Tanker War Resolution Framework (1980s)
The Iran-Iraq conflict provided extensive precedent for maritime disruption management with 2.5 million barrels/day peak impact during an 18-month sustained interference period. International convoy protection systems demonstrated effective interim solutions, enabling continued reduced-capacity transit during conflict periods.
Gulf War Strategic Outcomes
The 1990-1991 conflict established frameworks for rapid military intervention with a 6-month buildup to decisive action. Strategic reserve deployments maintained market stability whilst establishing permanent US military presence in the region.
Market Psychology and Investor Behaviour
Energy crisis periods demonstrate predictable psychological patterns affecting market dynamics. Risk premium calculations during geopolitical uncertainty typically add 15-25% to baseline commodity pricing through fear-based trading behaviours.
Behavioural Finance Considerations:
- Herding effects: Momentum trading amplifying price movements during crisis periods
- Availability bias: Recent conflict memories influencing probability assessments
- Loss aversion: Disproportionate fear of supply disruption versus normalisation scenarios
- Confirmation bias: Selective interpretation of information supporting existing positions
Professional investors employ systematic approaches including scenario-based portfolio allocation, correlation analysis, volatility trading strategies, and geographic diversification to navigate crisis volatility effectively.
Furthermore, the Trump ultimatum on Strait of Hormuz demonstrates how geopolitical tensions can rapidly escalate, creating sustained uncertainty in global energy markets. Understanding these psychological and structural factors enables more effective navigation during periods of significant geopolitical uncertainty.
The Trump ultimatum on Strait of Hormuz represents a critical inflection point for global energy security. However, historical precedents suggest that whilst short-term volatility remains extreme, markets typically adapt through diversification strategies and emergency protocols. Ultimately, the resolution pathway will determine whether current tensions evolve into sustained conflict or diplomatic normalisation.
Disclaimer: This analysis involves forecasts and speculation regarding complex geopolitical and economic scenarios. Market conditions can change rapidly based on diplomatic developments, military actions, or other unforeseen circumstances. Investment decisions should incorporate comprehensive risk assessment and professional financial consultation.
Ready to Navigate Energy Market Volatility During Geopolitical Crises?
Discovery Alert's proprietary Discovery IQ model delivers real-time alerts on significant ASX mineral discoveries, instantly empowering subscribers to identify actionable opportunities as energy sector volatility creates new investment landscapes. With major geopolitical events reshaping global markets, explore Discovery Alert's dedicated discoveries page to understand why historic mineral discoveries have generated substantial returns during periods of market uncertainty, and begin your 14-day free trial today to position yourself ahead of the market.