June 6, 2026
The Debt Wall That Changes Everything for Hard Asset Investors
There is a structural tension building beneath the surface of global financial markets that most mainstream commentary continues to underestimate. It is not simply about inflation, nor is it purely about interest rates. It is about the intersection of both forces within a debt architecture that fundamentally limits the options available to central banks. Understanding this constraint is the starting point for the Tavi Costa silver and gold mining sector bullish thesis.
The Tavi Costa silver and gold mining sector bullish thesis is not a short-term trade call. It is a multi-year structural argument rooted in sovereign debt dynamics, constrained monetary policy, and the repricing of hard assets as financial repression becomes the path of least resistance for overstretched governments. This article breaks down that thesis in full, examining the macro architecture, the metal-specific supply and demand dynamics, and the often-overlooked opportunity in mining equities.
When big ASX news breaks, our subscribers know first
Why Central Banks Are Running Out of Room to Tighten
The Refinancing Problem Most Investors Are Ignoring
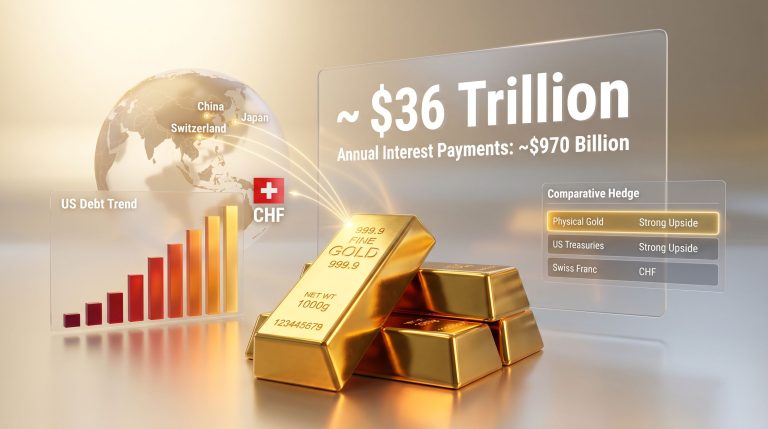
The conventional narrative holds that central banks will tighten aggressively whenever inflation resurfaces. However, this view overlooks a critical structural variable: approximately one quarter of outstanding government debt in major economies is approaching maturity and will need to be refinanced at prevailing interest rates. When that refinancing wall is priced at yields that are structurally elevated, the cost of servicing the overall debt burden becomes mathematically unsustainable for governments already operating with large fiscal deficits.
This is the core of the constraint. It is not that central banks want to ease into inflation. It is that the alternative — rolling over enormous quantities of sovereign debt at high rates — risks a fiscal spiral that is arguably more dangerous than allowing inflation to run slightly above target. The tightening cycles of the early 1980s, when Paul Volcker famously crushed inflation with rates above 15 percent, were executed in an environment of far lower debt-to-GDP ratios. That playbook is no longer available in the same form.
Costa has been explicit about this dynamic, noting that the cost of debt rising at current levels is simply not something economies can sustain when a significant portion of outstanding obligations must be rolled over into whatever rate environment exists at the time of refinancing. Consequently, the probability of a return to aggressive tightening is far lower than markets may currently be pricing, and the probability of easing — even in an environment of sticky inflation — is underappreciated.
The Two-Year Yield as a Market Stress Indicator
One of the more nuanced observations in the current macro debate is the role of the two-year U.S. Treasury yield as a psychological threshold. When two-year yields breach the 4 percent level, broader financial market stress tends to materialise. This is not a rigid rule but rather an empirical pattern from the current tightening cycle: yields moving above that level coincide with rising concern about the sustainability of borrowing costs across the public and private sectors.
The critical implication is that if and when the Federal Reserve or other major central banks pivot toward yield suppression — whether through explicit yield curve control, treasury buybacks, or sustained forward guidance toward lower rates — the adjustment in yield levels will not be a modest 30 basis point drift. Costa's analysis suggests the adjustment could be on the order of 200 basis points, a move that would have profound implications for the gold price forecast and would represent one of the most significant macro repricing events in recent decades.
How Does Gold Fit Into This Macro Framework?
Central Bank Buying as a Non-Speculative Demand Anchor
What distinguishes the current gold bull market from prior cycles is the composition of the demand base. The role of gold and silver central banks play in accumulating physical reserves has been significant, with sovereign buying across emerging markets and several developed economies proceeding at a pace not seen in decades. Unlike retail or hedge fund demand, this buying is policy-driven. Reserve managers are not responding to price momentum or momentum signals.
This creates a structurally different demand profile. Policy-driven buyers are considerably less price-sensitive than speculative participants. They do not panic-sell on a 10 percent correction. The presence of this demand base acts as a structural floor beneath gold prices and reduces the risk of the catastrophic drawdowns that have characterised previous precious metals cycles. According to data from the World Gold Council, central banks purchased more than 1,000 tonnes of gold in both 2022 and 2023, a sustained pace that represents a meaningful shift in reserve management philosophy globally.
Valuation Relative to Financial Assets and Prior Bull Cycles
The 2000 to 2011 gold bull market saw prices rise from below $300 per ounce to approximately $1,920 at the peak, a move driven by a combination of dollar weakness, low real yields, and rising emerging market demand. The current macro environment shares several features with that period but introduces additional structural pressures — particularly the sovereign debt constraint — that were not present to the same degree in the prior cycle.
Furthermore, analysts who share Costa's framework argue that gold has not yet reached historically comparable valuation peaks relative to broad financial assets. Equity markets remain at stretched valuations, and the relative price of gold to equities has room to expand further if the macro environment continues to deteriorate in the direction of financial repression and monetary disorder.
Silver's Unique Position: Industrial Demand Meets Monetary Premium
A Supply Pipeline That Cannot Easily Respond to Price Signals
Silver's investment case is distinct from gold's in several important ways. Persistent silver supply deficits have been compounded by a decade of underinvestment in exploration, leaving the silver development pipeline structurally thin. New silver deposits are increasingly difficult to discover at economically viable grades, and the lead time from discovery to production typically spans seven to ten years even under favourable permitting conditions.
Compounding this is the rapid growth of industrial demand. Silver is a critical input in solar photovoltaic panels, where its unique electrical conductivity properties make substitution difficult. It is also used extensively in electric vehicle components, semiconductor manufacturing, and medical applications. The Silver Institute has projected that solar panel manufacturing alone could absorb an increasingly significant share of annual silver supply through the remainder of this decade, creating direct competition between industrial users and investment buyers for a limited pool of available metal.
The Long-Duration Technical Setup
Technical analysts following silver's multi-decade price chart have identified what is described as a cup and handle pattern — a formation in which a prolonged rounded price base, the cup, is followed by a brief consolidation period, the handle, before a potential breakout to substantially higher levels. This is a long-duration structure, spanning years or even decades on the chart, and it is cited by some market participants as a potential precursor to a sustained move well above prior all-time highs.
Whether this pattern plays out as projected depends on the intersection of the macro drivers described above with silver's specific supply and demand fundamentals. However, the technical structure provides an additional analytical lens that complements the fundamental and macro arguments.
Understanding Silver's Volatility Through the Lens of Market Structure
Silver's total above-ground investable supply is a fraction of gold's. The silver market is, by financial market standards, extremely small. This means that capital flows that would barely register in the equity or bond markets can produce outsized price movements in both directions.
The recent price trajectory illustrates this vividly:
| Silver Price Level | Market Phase | Key Driver |
|---|---|---|
| ~$30/oz | Early bull phase base | Macro recognition begins |
| ~$120/oz | Acceleration peak | Institutional and retail demand surge |
| ~$70–$74/oz | Correction/consolidation | Profit-taking and sentiment reset |
| ~$90/oz | Recovery leg | Structural buyers re-entering |
Costa's assessment of this price action is instructive. The speed and magnitude of these moves — from $30 to $120 and then back toward $70 before recovering toward $90 — is not behaviour typically associated with normal commodity cycles. It is more consistent with monetary disorder, where uncertainty about the real value of fiat currency drives extreme volatility in monetary metals. He explicitly connects this volatility profile to historical hyperinflationary episodes, where precious metal prices moved in similarly non-linear patterns as confidence in paper currency eroded.
The probability of a U.S. hyperinflationary scenario should not be dismissed as zero, nor should it be treated as a base case. It occupies a non-trivial probability in a responsible scenario analysis framework, and the asymmetric upside for precious metals in such an environment justifies meaningful allocation even at modest probability weightings.
The investor psychology challenge here is real. When silver falls 8 to 10 percent in a short period, retail investors who are unaccustomed to the market's structural volatility tend to interpret the move as a fundamental signal rather than as noise within a larger structural trend. Costa's observation is pointed: many investors in the precious metals space would benefit more from psychological discipline than from additional fundamental analysis. Volatility is not evidence of a broken thesis in a market this small.
Is the Mining Sector Lagging the Metal Price Rally?
The Valuation Disconnect and Its Origins
Mining equities have broadly underperformed the underlying metals they produce during the current bull phase. This divergence is not accidental. It reflects a deeply entrenched investor scepticism forged during a decade of capital destruction, balance sheet dilution, cost blowouts, and management credibility failures across the sector. Between roughly 2012 and 2020, major mining companies destroyed enormous amounts of shareholder value through overpriced acquisitions, ill-timed expansions, and aggressive share issuances at low prices.
That institutional memory has proven remarkably persistent. Even as metal prices have moved dramatically higher and operating margins have expanded substantially, the market continues to apply valuation multiples calibrated to a fundamentally different margin and cost environment. This is the core of the opportunity that informed macro investors are currently exploiting, and it underpins the broader Tavi Costa silver and gold mining sector bullish thesis.
The Margin Story: What the Numbers Actually Reveal
The numbers here are striking and deserve direct examination:
| Metric | Approximately 10 Years Ago | Current Environment |
|---|---|---|
| Silver spot price | ~$15–$18/oz | ~$70–$90+/oz |
| All-in sustaining cost (sector avg.) | ~$12–$15/oz | ~$15–$18/oz |
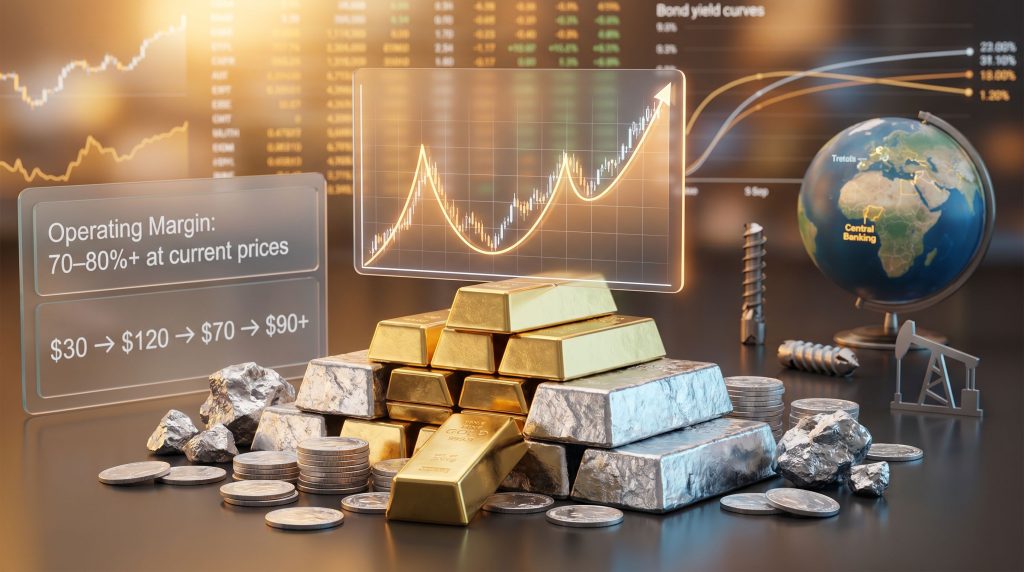
| Operating margin (illustrative) | Near breakeven | 70–80%+ at current prices |
| Valuation multiples | Compressed | Still near historical lows |
Costa uses his own operation at Cinco de Mayo as a concrete illustration. At a silver price of $70 per ounce, that represents a margin of roughly $55 per ounce. Even in a scenario where silver declines to $50 per ounce, the operation remains highly profitable. The diesel and energy cost increases that critics frequently cite as margin risks represent, in his analysis, a relatively trivial increment relative to the revenue base at these price levels.
The comparison to technology and financial sector margins is analytically sharp. The sectors that currently attract the highest equity valuations are operating at margins that are in many cases lower than what well-run silver producers are generating today. Yet the precious metals mining sector trades at valuations that are, in many cases, close to historical lows. This is precisely the kind of mispricing that characterises major sector rotation opportunities, making undervalued mining stocks particularly compelling at this juncture.
Smart Money Positioning Ahead of Broad Recognition
Costa's observation about institutional positioning is worth examining carefully. Sophisticated investors who have done the work to understand the margin sustainability thesis are quietly accumulating mining equities while the broader retail and institutional market remains anchored to a decade-old mental model of the sector as a capital-destroying, dilution-prone industry.
Historical commodity cycles provide a useful reference. In the early 2000s bull market, mining equities were similarly out of favour, trading at depressed valuations relative to the metals they produced. Investors who recognised the structural shift early — driven by Chinese industrialisation demand and a weakening dollar — and held through the subsequent re-rating cycle captured returns that were multiples of those available in other sectors.
The Commodity Supercycle Argument and the Broader Hard Asset Rotation
Key Structural Drivers of a Potential Supercycle
Several conditions that have historically characterised commodity supercycles are present to varying degrees today:
- Extended underinvestment in supply across multiple commodity categories, creating structural deficits
- Rising geopolitical demand for resource security, as countries seek to onshore or ally-shore critical mineral supply chains
- Monetary debasement dynamics that elevate the nominal price of tangible assets relative to financial assets
- Demand growth from energy transition technologies, particularly for silver, copper, lithium, and other materials-intensive inputs
- Decade-long suppression of mining sector valuations creating a wide gap between intrinsic value and market price
None of these individually constitutes a supercycle. However, their simultaneous presence, combined with the monetary policy constraints outlined earlier, creates a macro backdrop that several experienced commodity analysts are characterising as the early stages of a sustained multi-year upcycle.
The next major ASX story will hit our subscribers first
Practical Portfolio Considerations for Hard Asset Investors
Building Positions Through Volatility
The investment approach most consistent with the structural thesis described here is disciplined accumulation across the duration of the bull cycle. Specific tactical approaches worth considering include:
- Dollar-cost averaging into precious metals and mining equities during drawdown periods rather than chasing momentum at price peaks
- Treasury call options as a specific hedge against a sudden large-scale policy pivot, positioned to benefit from a 150 to 200 basis point decline in yields
- Liquidity management as an active discipline, maintaining dry powder to deploy during sharp corrections rather than being fully invested at cyclical peaks
- Distinguishing between normal volatility and genuine fundamental deterioration when deciding whether to hold or exit positions during periods of market stress
Key Risk Factors to Monitor
Intellectual honesty requires acknowledging the conditions under which the thesis would weaken:
- An unexpected and sustained return to aggressive monetary tightening, however structurally unlikely, remains the primary bear case for hard assets
- An extended consolidation phase following sharp price appreciation can test the patience of even disciplined long-term investors
- Metal price declines of 20 percent or more, combined with rising input costs, would compress margins enough to challenge the profitability thesis for higher-cost producers
- Macro policy surprises, including unexpected fiscal consolidation or a genuine resolution of sovereign debt dynamics, could reduce the structural tailwind for precious metals
Disclaimer: This article presents macro analysis and investment perspectives for informational and educational purposes only. It does not constitute financial advice. Readers should conduct their own due diligence and consult qualified financial professionals before making investment decisions. Forward-looking statements and price projections involve inherent uncertainty and may not be realised.
FAQ: The Gold, Silver, and Mining Sector Bull Thesis
Why is aggressive Fed tightening considered structurally unlikely in the current cycle?
Approximately one quarter of outstanding government debt requires near-term refinancing. At elevated rates, the cost of rolling over this debt becomes fiscally unsustainable. This constraint limits the central bank's effective tightening capacity in ways that did not exist to the same degree in prior cycles.
Why have mining stocks lagged the rise in precious metal prices?
Investor scepticism about margin sustainability, rooted in a decade of capital destruction and dilution in the sector, has caused the market to apply outdated valuation frameworks to companies now operating with dramatically improved economics. This represents the core of the current mispricing opportunity.
What makes silver so much more volatile than gold?
Silver's total investable market is a fraction of gold's. This structural characteristic means that relatively modest capital inflows or outflows produce disproportionately large price movements. This volatility is not a sign of weakness — it is a defining feature of a small, thinly traded market.
What is yield curve control and why does it matter for gold?
Yield curve control refers to a central bank policy of actively capping interest rates at specific maturities by committing to purchase whatever quantity of bonds is necessary to hold yields at or below a target level. If major central banks implement or signal yield curve control in response to unsustainable debt service costs, real yields could fall dramatically, which historically has been among the most powerful catalysts for gold price appreciation.
Is hyperinflation a realistic risk for Western economies?
It is treated by most analysts as a tail risk rather than a base case. However, given current fiscal and monetary dynamics, the probability is meaningfully above zero. Precious metals offer asymmetric protection in such a scenario. The non-linear price behaviour seen in silver — moving from $30 to $120 and then back toward $70 before recovering toward $90 — bears resemblance to price dynamics observed in past monetary disorder episodes.
What investment horizon applies to this thesis?
The structural argument behind the Tavi Costa silver and gold mining sector bullish thesis is explicitly framed around a 5 to 10 year horizon. Metal prices are expected to remain structurally elevated over that period, not merely sporadically so, and mining companies are expected to undergo a fundamental re-rating as the market recognises the durability of current margin structures.
Want to Identify the Next Major Mineral Discovery Before the Broader Market?
Discovery Alert's proprietary Discovery IQ model delivers real-time alerts on significant ASX mineral discoveries, instantly translating complex geological and commodity data into actionable investment insights — precisely the kind of edge that matters when structural shifts in hard assets accelerate. Explore historic examples of major mineral discoveries and their market returns, then begin your 14-day free trial at Discovery Alert to position yourself ahead of the next significant opportunity.