May 19, 2026
When Volume Shrinks But Profits Grow: The New Economics of African Gold Mining
There is a quiet revolution underway in how investors and analysts should measure the financial health of mid-tier gold producers. For decades, the industry defaulted to ounces sold as the primary yardstick of operational success. A producer that sold more gold was, by definition, doing better than one that sold less. That logic is being systematically dismantled in 2025 and 2026 as spot gold prices have reached levels that fundamentally alter the profit calculus, creating scenarios where selling fewer ounces generates more revenue, wider margins, and stronger free cash flow than before.
This is not a theoretical observation. It is precisely what Thor Explorations Q1 profit growth data reveals when examined carefully. The numbers behind the company's January to March 2026 quarter tell a story that goes well beyond a simple earnings beat. They illustrate how gold price leverage, when combined with a structurally low cost base, can compress years of financial transformation into a matter of quarters.
When big ASX news breaks, our subscribers know first
Understanding Gold Price Leverage and Why It Reshapes Earnings Analysis
Gold price leverage is a term that describes the amplified earnings sensitivity that low-cost producers experience when the gold price rises. Unlike higher-cost operations, where margin expansion is partially absorbed by bloated cost structures, low all-in sustaining cost producers retain an outsized share of every incremental dollar added to the spot price. Furthermore, understanding the broader gold price outlook provides essential context for evaluating how these dynamics play out across the sector.
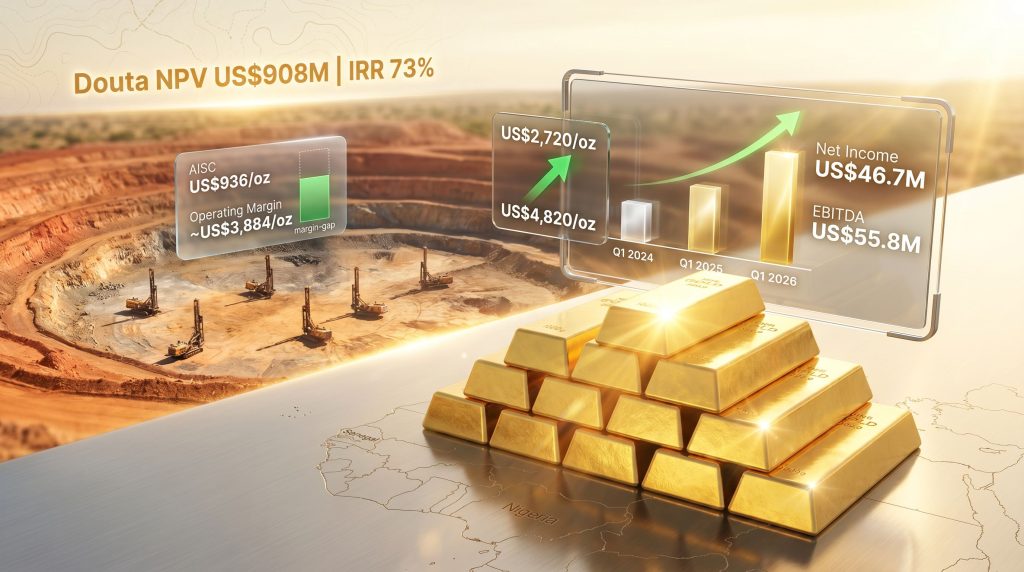
West African gold producers operating below US$1,000 per ounce in cash costs sit at one of the most advantageous points on the global cost curve. When realised prices move from approximately US$2,720 per ounce in early 2025 to US$4,820 per ounce by Q1 2026, the profit per ounce does not merely improve proportionally. It expands exponentially relative to the cost base, because fixed and semi-fixed costs remain largely constant regardless of the gold price.
This dynamic creates what mining analysts describe as an earnings convexity effect: a non-linear relationship between price appreciation and margin growth. For producers with already-lean cost structures, the consequence is rapid balance sheet strengthening, cash accumulation, and strategic optionality that would take years to achieve in a flat-price environment.
Gold price leverage is most powerful when AISC sits well below the prevailing spot price. At a spread of nearly US$3,884 per ounce, the operating margin available to a low-cost African producer in Q1 2026 was historically exceptional by any global benchmark.
Thor Explorations Q1 2026: Dissecting the Revenue and Profit Expansion
Revenue Growth Despite Fewer Ounces Sold
The core paradox of Thor's Q1 2026 financial results is also their most instructive feature. The company sold 15,417 ounces of gold during the quarter, a reduction of approximately 32% compared to the 22,750 ounces sold in Q1 2025. Under conventional analysis, this would signal a weaker quarter. However, the financial results suggest precisely the opposite.
Revenue for the period reached US$74.3 million, compared to US$64.0 million in Q1 2025, representing a 16% year-over-year increase achieved on meaningfully lower physical volumes. The driver is straightforward: the average realised price per ounce climbed from US$2,720 to US$4,820, a 77% increase that overwhelmed the volume reduction with considerable margin to spare. The relationship between gold price and mining equities has rarely been more starkly demonstrated than in these figures.
The earnings expansion downstream of revenue was even more striking. EBITDA grew from US$43.6 million to US$55.8 million, a gain of approximately 28%, while net income increased from US$34.4 million to US$46.7 million, representing 36% year-over-year profit growth. These are not incremental improvements. They reflect a structural shift in profitability driven by price, not production.
Three Years of Financial Transformation at a Glance
Placing the Q1 2026 results within a multi-year context reveals an earnings trajectory that has accelerated with each successive period.
| Metric | Q1 2024 | Q1 2025 | Q1 2026 |
|---|---|---|---|
| Revenue (US$M) | n/a | 64.0 | 74.3 |
| EBITDA (US$M) | 23.2 | 43.6 | 55.8 |
| Net Income (US$M) | 12.4 | 34.4 | 46.7 |
| Ounces Sold | n/a | 22,750 | 15,417 |
| Realised Price (US$/oz) | n/a | 2,720 | 4,820 |
| Net Cash (US$M) | (14.3) net debt | 24.7 | 177.9 |
The progression from Q1 2024 to Q1 2025 alone was remarkable, with net income nearly tripling from US$12.4 million to US$34.4 million, an increase of approximately 177%. By Q1 2026, net income had compounded again by a further 36%, with the additional twist of fewer ounces sold. What these numbers collectively illustrate is a company that has passed through a financial inflection point and is now generating returns that bear little resemblance to its 2024 operating profile.
Perhaps the most strategically significant data point in this table is the net cash transformation. The company moved from a net debt position of US$14.3 million in Q1 2024 to net cash of US$177.9 million by Q1 2026. That is a balance sheet swing of more than US$192 million in approximately 24 months, achieved entirely through operating cash flow rather than dilutive equity issuance or asset sales. Full details are available in Thor's official Q1 2025 financial results.
Segilola Mine Operations: Cost Discipline and the Per-Ounce Margin Story
Operating Metrics That Define Competitive Positioning
The Segilola gold mine in Nigeria produced 20,256 ounces of gold during Q1 2026, processing 239,644 tonnes of ore at a head grade of 2.54 grams per tonne (g/t). For context, the global average open-pit gold mine head grade has been declining for decades, with many operations now processing material below 1.0 g/t. A consistent head grade above 2.5 g/t positions Segilola meaningfully above the global median in terms of ore quality, which directly supports the operation's low cost structure.
The cost metrics are where Segilola's competitive advantage becomes most apparent:
- Cash operating costs: US$672 per ounce sold
- All-in sustaining costs (AISC): US$936 per ounce sold
- Realised gold price: US$4,820 per ounce
- Implied operating margin: approximately US$3,884 per ounce sold
To contextualise the AISC of US$936 per ounce, the World Gold Council's industry data consistently places the global average AISC for gold producers in the range of US$1,300 to US$1,400 per ounce in recent years. Segilola operating at sub-US$1,000 per ounce AISC places it firmly in the lowest cost quartile globally, a distinction that becomes exponentially valuable as spot prices remain elevated.
The Mechanics of Grade Management and Its Impact on Costs
An often-underappreciated driver of Segilola's cost efficiency is the relationship between ore grade, mill throughput, and unit cost. In gold processing, higher head grades mean more gold is recovered per tonne of material processed. This allows fixed processing costs — energy, reagents, labour, maintenance — to be distributed across a larger gold output, reducing the cost per ounce produced.
At 2.54 g/t, Segilola is extracting sufficient gold per tonne to keep its processing cost denominator strong. The practical implication is that cost control at Segilola is not purely a function of operational efficiency. It is also a reflection of the geological quality of the ore body being mined, making resource quality a foundational competitive advantage rather than simply an operational metric.
Mine Life Extension: The Depth Drilling Campaign
One of the most consequential near-term development activities at Segilola is the ongoing depth extension drilling programme. Six diamond drill rigs are currently active, targeting mineralisation below the existing resource envelope. Diamond drilling is the gold standard for resource delineation because drill cores provide continuous, physically intact samples that allow geologists to characterise grade, structure, and mineralogy with precision. In addition, interpreting gold drill results from depth extension programmes requires careful analysis to understand how findings translate into resource upgrades.
Initial results from this depth extension programme are expected in Q2 2026. Separately, independent technical studies have commenced examining the potential for open-pit cutback scenarios and the economic pathway toward underground mining. This two-track investigation is significant because it signals that management is evaluating multiple pathways to extend productive mine life rather than relying on a single geological or engineering solution.
For a single-asset producer, mine life extension is arguably the most critical value-creation lever available. Every additional year of productive life at current gold prices and cost structures adds substantial present-value to the enterprise.
The Douta Gold Project: Senegal's Role as Thor's Primary Growth Catalyst
Pre-Feasibility Study Economics: What the Numbers Actually Mean
The Douta gold project in Senegal represents the most significant pipeline asset in Thor's multi-country portfolio. The pre-feasibility study outlines a 12.6-year mine life with total production of 1.0 million ounces of gold, a pre-tax net present value of US$908 million, and a pre-tax internal rate of return of 73% at a long-term gold price assumption of US$3,500 per ounce.
To understand why these metrics are notable, consider that an IRR of 73% is exceptionally high for a capital-intensive mining project. Most commercially viable gold projects attract FID at IRRs in the 15% to 25% range. An IRR of 73% reflects either a very low capital intensity relative to earnings potential, a very high gold price assumption, or both.
Critically, the PFS was constructed using a long-term gold price of US$3,500 per ounce, a figure that is now below the current spot price. If gold prices were to remain anywhere near current levels through construction and early production, the NPV and IRR metrics would be materially higher than the headline PFS figures suggest. Consequently, the publicly disclosed project economics may significantly understate the opportunity at prevailing market prices.
Disclaimer: Project economics derived from pre-feasibility studies involve significant assumptions, estimates, and forward-looking information. Actual outcomes may differ materially from study projections. Investors should conduct their own due diligence.
The Path to Final Investment Decision
The primary regulatory precondition for advancing Douta to a Final Investment Decision is the receipt of the Douta mining permit from Senegalese authorities. Permitting timelines in West Africa vary considerably by jurisdiction and project type, and represent one of the key execution risks for the project's development schedule. Furthermore, completing a definitive feasibility study will be a critical milestone once permitting is secured, providing the rigorous technical and financial basis required for FID.
What has changed materially in Thor's favour is the balance sheet. With net cash of US$177.9 million, the company now has a financial foundation that could support meaningful self-funding of early-stage development capital without necessarily requiring external project finance. This is a strategic position that would have been unimaginable two years ago when the company carried net debt.
The exploration programme in Côte d'Ivoire adds a third dimension to the portfolio, functioning as an optionality play with potential to surface additional resource value independent of Segilola's operating performance or Douta's development progress. The broader sector context of gold M&A activity also suggests that well-capitalised projects with strong economics attract significant strategic interest in elevated price environments.
Scenario Modelling: How Does the Investment Case Hold Up If Gold Prices Correct?
One of the most important questions for investors considering mid-tier gold producers at elevated spot prices is downside resilience. The table below models implied annual revenue across a range of gold price scenarios against Thor's 2026 production guidance midpoint of 80,000 ounces:
| Gold Price Scenario | Implied Annual Revenue (80,000 oz midpoint) | AISC Buffer vs. Spot |
|---|---|---|
| US$2,500/oz | US$200.0M | US$1,564/oz positive margin |
| US$3,000/oz | US$240.0M | US$2,064/oz positive margin |
| US$3,500/oz (PFS assumption) | US$280.0M | US$2,564/oz positive margin |
| US$4,820/oz (Q1 2026 realised) | US$385.6M | US$3,884/oz positive margin |
Even at US$2,500 per ounce, a level that would represent a significant correction from current prices, Segilola's AISC of approximately US$936 to US$1,200 per ounce (within the 2026 guidance range) still generates substantial positive margins. The operation would need gold to fall below approximately US$1,200 per ounce before approaching a breakeven scenario under current cost guidance, which represents a buffer of more than 75% below current spot prices.
This downside resilience is a function of the same structural advantage that drives the upside performance: a low-cost operating base that performs across a wide range of price environments. As Mining Review reported, Thor's record-breaking production and profit figures underscore the robustness of this cost positioning.
The next major ASX story will hit our subscribers first
Capital Allocation and the Strategic Choices Ahead
2026 Production Guidance and Free Cash Flow Potential
Thor's 2026 production guidance of 75,000 to 85,000 ounces at an AISC range of US$1,000 to US$1,200 per ounce provides a framework for estimating free cash flow generation under different price assumptions. At current prices, the implied free cash flow available after sustaining capital is substantial, creating genuine optionality around how management deploys capital.
The stated priorities for capital allocation include:
- Segilola mine life extension through the depth drilling and feasibility studies
- Advancing Douta toward Final Investment Decision, pending mining permit receipt
- Exploration programmes across Nigeria, Senegal, and Côte d'Ivoire
- Maintaining balance sheet strength for strategic flexibility
The strategic tension here is real. Mine life extension at Segilola requires capital investment now to preserve future production. Douta development will require substantial upfront capital when FID is reached. And multi-country exploration spending, while lower in absolute terms, is ongoing. Managing these competing capital demands while maintaining the fortress balance sheet achieved through gold price leverage is likely to define management execution through 2026 and into 2027.
Frequently Asked Questions: Thor Explorations Q1 Profit Growth
What drove Thor Explorations' Q1 2026 profit growth?
The primary driver of Thor Explorations Q1 profit growth was the sharp increase in the average realised gold price, which rose from US$2,720 per ounce in Q1 2025 to US$4,820 per ounce in Q1 2026. This price appreciation more than offset a reduction in ounces sold, expanding EBITDA to US$55.8 million and net income to US$46.7 million.
How much did Thor Explorations earn in Q1 2026?
Revenue reached US$74.3 million, EBITDA was US$55.8 million, and net income was US$46.7 million for the three months ended 31 March 2026.
What is Thor Explorations' AISC at Segilola?
Cash operating costs were US$672 per ounce sold and all-in sustaining costs were US$936 per ounce sold in Q1 2026, placing Segilola in the lowest cost quartile globally.
What is the Douta gold project's NPV?
The Douta pre-feasibility study outlines a pre-tax NPV of US$908 million and a pre-tax IRR of 73% at a long-term gold price of US$3,500 per ounce, over a 12.6-year mine life producing 1.0 million ounces.
What is Thor Explorations' 2026 production guidance?
The company is guiding for 75,000 to 85,000 ounces of gold production in 2026 at an AISC of US$1,000 to US$1,200 per ounce.
How has Thor's net cash position changed?
From a net debt position of US$14.3 million in Q1 2024, the company has accumulated net cash of US$177.9 million by Q1 2026, a balance sheet transformation of more than US$192 million in approximately 24 months.
Key Takeaways: What the Q1 2026 Results Signal for Thor's Strategic Trajectory
The five most important signals from Thor Explorations' Q1 2026 results are:
- Gold price leverage is the dominant earnings driver, not volume growth. Investors should weight realised price per ounce above ounces sold when evaluating quarterly performance.
- The balance sheet transformation is strategically decisive, giving management genuine flexibility to pursue mine life extension and pipeline development simultaneously without external financing pressure.
- Segilola's sub-US$1,000 cash operating cost structure provides exceptional downside protection and amplified upside exposure, making it a structurally advantaged operation across a wide gold price range.
- The Douta PFS economics are likely understated relative to current gold prices, with the project's NPV and IRR potentially materially higher than the headline US$3,500 per ounce assumption suggests.
- The Douta mining permit remains the single most important near-term catalyst to monitor, as its receipt would clear the path to FID and transition Thor from a single-asset operator to a multi-mine producer.
The convergence of disciplined cost management at Segilola, a transformational growth project in Senegal, and a balance sheet built entirely from operating cash flow positions Thor Explorations at an interesting strategic juncture. Whether the company can convert its current financial strength into durable long-term value creation will depend on execution across all three fronts, with the Douta permitting timeline functioning as the pivotal variable in the near term.
This article contains forward-looking statements and financial projections that involve assumptions and uncertainties. Actual results may differ materially from projections. This content is for informational purposes only and does not constitute financial or investment advice. Readers should conduct independent due diligence before making any investment decisions.
Want To Be First When The Next Major ASX Gold Discovery Hits The Market?
Discovery Alert's proprietary Discovery IQ model scans ASX announcements in real time, instantly converting complex mineral data into actionable investment insights — so subscribers are positioned ahead of the broader market the moment a significant discovery is made. Explore historic examples of exceptional discovery returns and begin your 14-day free trial at Discovery Alert today.