July 14, 2026
When Oil Routes Become Financial Weapons: Understanding the Hormuz Shock
Every few years, a single geographic bottleneck reasserts its dominance over global energy markets with startling speed. The Strait of Hormuz occupies a category of its own in this regard. Stretching barely 33 kilometres at its narrowest navigable point between Iran and Oman, this sliver of water handles approximately 20% of the world's daily oil supply — a concentration of energy flow with no comparable alternative route capable of absorbing equivalent volume at comparable cost or speed. When anything threatens that corridor, markets do not wait for facts. They price in fear first, a pattern that echoes decades of crude oil geopolitics.
That dynamic explains much of what unfolded when President Trump announced a 20% transit fee on all cargo vessels passing through the strait, combined with a reimposed naval blockade targeting Iranian-affiliated shipping. Oil moved immediately. Equities followed in the opposite direction. And a debate ignited across trading desks about whether this was a genuine structural shift in maritime commerce or an announcement with limited enforceability that would ultimately fade.
Understanding the Trump Hormuz toll oil stocks winners and losers equation requires moving beyond the headline price move and interrogating the legal architecture, market mechanics, and scenario probabilities underneath it.
When big ASX news breaks, our subscribers know first
Why Hormuz Moves Markets Faster Than Any Other Chokepoint
The geography alone explains the reflexive market response. Unlike the Suez Canal or the Malacca Strait, which carry diverse cargo categories, Hormuz is overwhelmingly an oil corridor. Major Gulf exporters including Saudi Arabia, Iraq, the UAE, Kuwait, and Iran depend on it as their primary maritime exit for crude exports. The numbers are striking:
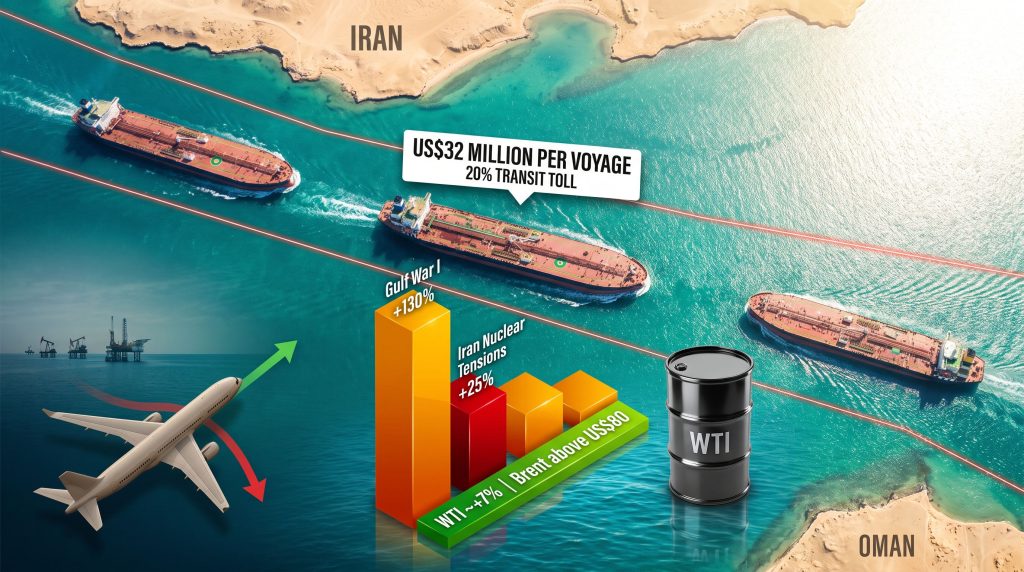
| Geopolitical Event | Approximate Oil Price Response | Response Duration |
|---|---|---|
| Iran-Iraq Tanker War (1984-88) | +30 to 40% across the conflict | Multi-year |
| Gulf War I (1990-91) | +130% peak from pre-war levels | Approximately 6 months |
| Iran nuclear escalation (2011-12) | +25% over roughly 6 months | Sustained |
| Houthi Red Sea disruptions (2023-24) | +8 to 12% episodic | Intermittent and recurring |
| Trump Hormuz toll announcement (2026) | Approximately +7% WTI; Brent above US$80 | Outcome unresolved |
The pattern across this history is consistent. An initial fear-driven spike tends to overshoot the eventual fundamental reality, particularly when the threat involves policy announcements rather than verified physical disruption. Traders and algorithms respond to the possibility of supply reduction, not the confirmed reality of it. That behavioural tendency is central to interpreting the current situation correctly.
Breaking Down the Policy: What the 20% Toll Actually Means in Dollar Terms
The policy contains two distinct components that generate separate risk vectors for investors. The first is a selective naval blockade directed at Iranian-flagged vessels and their commercial partners. The second is the universal 20% transit charge applied to all other cargo passing through the strait. Furthermore, the trade war oil impact of these combined measures compounds the difficulty of modelling long-term outcomes.
The cost arithmetic is significant. At prevailing crude prices, a fully laden Very Large Crude Carrier (VLCC) or supertanker carries cargo worth hundreds of millions of dollars. A 20% charge on that cargo would translate to approximately US$32 million per voyage in additional costs. For context, fees previously associated with Iranian transit arrangements reached up to US$2 million per vessel — meaning the proposed US toll represents roughly a 16-fold cost escalation over prior precedents.
That scale of cost would not merely add a transit charge; it would structurally reprice Gulf energy exports and reverberate through global supply chains. As Forbes reports, Trump himself acknowledged the complexity of codifying such arrangements, stating "you can't cover everything in a document" — a remark that underscores the inherent ambiguity in enforcement.
What International Maritime Law Says About Strait Tolls
The legal challenge to the toll is not a peripheral concern — it sits at the centre of whether this policy can generate lasting market impact or will dissolve under institutional pressure.
The United Nations Convention on the Law of the Sea (UNCLOS), specifically Part III Articles 37 through 44, enshrines the principle of transit passage through international straits. Under this framework, coastal nations cannot impose fees or charges solely for the right of transit passage through internationally recognised straits. The legal architecture was designed precisely to prevent strategic chokepoints from becoming toll roads for national revenue generation.
| Institution | Position on Toll Legality |
|---|---|
| International Maritime Organization (IMO) | Stated no legal basis exists for mandatory transit tolls through international straits |
| IMO Governing Council | Reaffirmed toll-free passage under international maritime law |
| US Secretary of State Marco Rubio | Publicly stated that no nation supports mandatory payment obligations for Hormuz transit |
| Nordic American Tankers CEO | Characterised the 20% fee as operationally unrealistic |
The IMO's rapid response — delivered within hours of the announcement — is itself a signal. International bodies rarely move this quickly. The speed suggests institutional confidence that the policy has no legitimate legal footing under existing maritime frameworks.
For the toll to be enforced, the United States would need either broad multilateral agreement from allied shipping nations or the willingness to physically interdict vessels that decline to pay. Neither option is straightforward. Secretary of State Marco Rubio's own prior statement that no nation on Earth supports mandatory Hormuz payment obligations suggests the diplomatic pathway faces immediate blockage.
Market Reaction: Decomposing the Oil Spike and Equity Selloff
The immediate price response unfolded along predictable geopolitical shock lines. WTI crude surged approximately 7% to nearly US$77 per barrel, representing its strongest level in roughly a month. Brent crossed above US$80 per barrel. Simultaneously, the Nasdaq Composite declined more sharply than the broader S&P 500, a divergence that reflects a specific transmission mechanism worth understanding. This pattern of tariff-driven market volatility has become increasingly familiar to investors navigating the current geopolitical environment.
The Fear Trade vs. Fundamental Trade Distinction
Not all oil price spikes carry equal durability. Market professionals distinguish between two types:
-
A fear trade spike originates in announcement risk, geopolitical posturing, or threat perception rather than actual verified supply reduction. These moves tend to be sharper, faster, and more prone to reversal once enforcement realities clarify.
-
A fundamental trade spike occurs when physical supply is genuinely disrupted, production volumes decline, or transit routes are demonstrably blocked. These moves tend to embed more durably into pricing and carry longer-lasting portfolio consequences.
The Hormuz toll announcement exhibits the characteristics of a fear trade. No cargo has been physically blocked. No collection mechanism has been established or demonstrated. Institutional opposition from the IMO, allied governments, and even senior US officials arrived within hours. Investors who conflate the two types of price moves risk buying into a spike that partially reverses as enforcement realities become clear.
Three Scenarios: Where Oil Prices and Portfolios Go From Here
Scenario A: Toll Collapses Under Legal and Diplomatic Pressure
This represents the base case probability given the immediate and broad-based institutional opposition. Under this path:
-
IMO legal challenges, allied nation resistance, and internal US political friction prevent any practical enforcement mechanism from emerging.
-
The approximately 7% oil price spike partially retraces over two to four weeks as market participants reassess the announcement as primarily rhetorical.
-
Energy stocks that rallied on the announcement give back a portion of gains. Airlines and consumer discretionary stocks recover lost ground.
Scenario B: Selective Enforcement Embeds a Sustained Risk Premium
Under this elevated-risk pathway, the US Navy enforces the toll against non-allied vessels while major trading partners negotiate exemptions or workarounds. The practical result would be a US$5 to US$10 per barrel geopolitical risk premium embedded in oil pricing indefinitely. Energy producers sustain margin expansion. Airlines face structural cost headwinds regardless of hedging positions. Inflation expectations shift upward, complicating Federal Reserve rate decisions.
Scenario C: Full Escalation Drives Crude Toward and Beyond US$100
The tail risk scenario involves Iranian retaliation, a ceasefire breakdown, or a physical disruption to strait transit capacity. Goldman Sachs has previously modelled that crude oil sustained above US$100 per barrel materially elevates the probability of a US economic recession, with downstream consequences for corporate earnings, credit markets, and equity valuations across sectors. According to Yahoo Finance, even a ceasefire arrangement only keeps the strait toll-free for 60 days, meaning structural uncertainty persists well beyond any short-term diplomatic resolution.
Trump Hormuz Toll Oil Stocks: Winners, Losers, and the Nuances Between
Energy Producers: Structural Beneficiaries With Entry Point Risk
Upstream oil producers and integrated energy majors occupy the clearest beneficiary position when crude prices rise. Their production cost bases are largely fixed in the short term, meaning price increases flow disproportionately through to operating margins. US domestic producers carry an additional dimension of advantage: their supply chains are geographically insulated from Hormuz physical risk, making them perceived as comparatively safe beneficiaries of Middle East supply anxiety.
| Company | Ticker | Primary Exposure | Scenario A | Scenario B | Scenario C |
|---|---|---|---|---|---|
| ExxonMobil | NYSE: XOM | US domestic + global integrated | Neutral to mild pullback | Strong gain | Strong gain |
| Chevron | NYSE: CVX | US domestic + Gulf exposure | Neutral to mild pullback | Strong gain | Strong gain |
| ConocoPhillips | NYSE: COP | Upstream producer | Pullback | Gain | Strong gain |
| Occidental Petroleum | NYSE: OXY | Upstream producer | Pullback | Gain | Strong gain |
| Shell | NYSE: SHEL | Global integrated | Mixed | Gain | Gain |
| BP | NYSE: BP | Global integrated | Mixed | Gain | Gain |
The critical caution here is entry timing. Buying into a 7% oil spike driven by an announcement with no established enforcement mechanism is a structurally high-risk entry point. Historical precedent for fear trade reversals is strong.
Tanker and Shipping Firms: War-Risk Premium Beneficiaries
When strategic maritime corridors face elevated threat perception, two forces simultaneously lift tanker operator economics: higher spot freight day rates driven by route uncertainty and elevated demand, and rising war-risk insurance premiums that charterers absorb. Tracking the Baltic Dirty Tanker Index over coming weeks will signal whether this dynamic is embedding at a fundamental level or remaining episodic.
Airlines: The Most Directly Exposed Losers
Aviation faces the most operationally direct impact. Jet fuel typically represents 20 to 30% of total airline operating costs, a concentration that makes carriers uniquely sensitive to crude price movements. Delta Air Lines absorbed its highest quarterly fuel expenditure on record in a recent reporting period — meaning any further oil price elevation arrives at a structurally vulnerable cost moment for major carriers.
| Carrier | Ticker | Fuel Cost Sensitivity | Hedging Position |
|---|---|---|---|
| Delta Air Lines | NYSE: DAL | Very High | Partial hedging only |
| United Airlines | NASDAQ: UAL | Very High | Partial hedging only |
| American Airlines | NASDAQ: AAL | High | Limited hedging capacity |
Technology and Growth Stocks: The Indirect but Meaningful Casualty
The transmission mechanism from Hormuz to technology stocks is macroeconomic rather than operational. Higher crude prices lift inflation expectations, which reduce the probability and timing of Federal Reserve rate cuts. Growth and technology equities are particularly sensitive to rate expectations because their valuations rest heavily on discounted future cash flows — higher discount rates compress those valuations mathematically. This is precisely why the Nasdaq declined more sharply than the broader S&P 500 on the announcement session.
Consumer Discretionary: The Demand Destruction Channel
Elevated petrol prices function as an effective consumption tax on household budgets. The impact falls most heavily on lower-income consumer segments with minimal savings buffers, reducing discretionary spending on retail, dining, and entertainment. Retailers and consumer-facing businesses face both cost-side pressure through logistics and supply chain expenses and demand-side pressure through reduced household spending capacity.
The next major ASX story will hit our subscribers first
The Macro Overlay: Inflation Data, the Fed, and the US$100 Threshold
The Hormuz announcement coincided with a particularly dense macro calendar. US CPI data landing the following day created a compounding risk event: an oil spike arriving simultaneously with fresh inflation readings. Higher crude prices feed directly into headline CPI through petrol and transportation cost components. If inflation prints above expectations in an environment of elevated oil, the Federal Reserve faces a genuine stagflationary dilemma — inflation too persistent to justify rate cuts, growth too fragile to absorb rate increases.
Adding another layer of uncertainty, the inaugural congressional testimony of new Fed Chair Kevin Warsh coincided with the post-announcement period. Markets were parsing his language for signals on rate trajectory at precisely the moment when oil-driven inflation risk had reasserted itself. Any hawkish lean in his communication would compound the pressure on growth and rate-sensitive equities considerably. In such an environment, gold safe haven demand tends to intensify as investors seek protection from both inflationary pressure and equity volatility.
Goldman Sachs has modelled that crude oil sustained above US$100 per barrel meaningfully increases the probability of a US recession. Under the full escalation scenario, this threshold becomes plausible. The downstream implications for corporate earnings and credit markets would extend well beyond the energy sector.
Furthermore, the interplay between gold and bond volatility in this environment adds a critical dimension for portfolio construction. When oil-driven inflation collides with rate uncertainty, traditional hedging relationships between equities and bonds can break down in ways that catch underprepared investors off guard.
A Structured Portfolio Response to the Hormuz Toll Risk
Rather than reacting to the headline, a disciplined approach involves monitoring specific signals that distinguish the fear trade scenario from a genuine fundamental repricing:
| Portfolio Action | Rationale | Risk Level |
|---|---|---|
| Hold existing energy positions | Benefit from upside without chasing the spike entry | Low |
| Avoid new airline position initiations | Fuel cost headwinds are real regardless of toll outcome | Moderate |
| Monitor CPI data before repositioning | Macro trajectory determines durability of oil elevation | Low |
| Reduce growth equity overweight if oil sustains above US$80 | Rate cut timeline compression is a structural valuation headwind | Moderate |
| Track tanker freight rate data | Baltic Dirty Tanker Index confirms whether repricing is fundamental | Moderate |
Key indicators worth monitoring closely over the weeks ahead include:
-
WTI and Brent price trajectory: Sustained levels above US$80 indicate Scenario B signals are materialising; levels approaching US$90 suggest Scenario C risk is rising
-
IMO enforcement response: Whether any formal legal mechanism is activated against the toll
-
Allied nation reactions: G7 shipping nation positions on toll compliance or non-compliance
-
US CPI prints: Whether oil-driven cost increases are compounding existing inflation pressure
-
Federal Reserve communications: Rate cut timeline signals from the new Fed Chair
-
Baltic Dirty Tanker Index movements: The most direct real-time indicator of whether maritime market repricing is genuine
FAQ: Trump Hormuz Toll, Oil Prices, and Stock Market Impact
What is the Trump Hormuz toll?
President Trump announced a 20% fee applied to all cargo transiting the Strait of Hormuz, positioning the United States as the waterway's designated guardian. The policy also includes a reimposed naval blockade targeting Iranian-affiliated vessels.
How much would the Hormuz toll cost per ship?
At prevailing crude prices, the 20% charge would generate an estimated per-voyage cost of approximately US$32 million for a fully laden supertanker — roughly 16 times higher than fees previously associated with Iranian transit arrangements of up to US$2 million.
Is the Hormuz toll legal under international law?
The IMO has determined that no legal basis exists under international maritime law for imposing mandatory tolls through international straits. UNCLOS Part III, Articles 37 through 44, explicitly protects the right of unimpeded transit passage.
Why did oil prices jump sharply on the Hormuz announcement?
The Strait carries approximately 20% of global daily oil supply. Any credible threat to that volume — even one of uncertain enforceability — triggers immediate fear-based pricing. Markets price risk ahead of verification, not after it.
Which stocks benefit most from higher oil prices?
Upstream producers and integrated energy majors benefit most directly through margin expansion with minimal cost increases. Tanker and shipping operators benefit from elevated freight rates and war-risk insurance premiums.
Which stocks face the most significant downside from an oil spike?
Airlines face the most operationally direct impact through jet fuel cost increases. Technology and growth stocks face indirect pressure through the inflation-to-rate-cut compression channel. Consumer discretionary companies face both cost and demand-side headwinds simultaneously.
Could crude oil reach US$100 because of the Hormuz toll?
Under a full escalation scenario involving physical strait disruption or material Iranian retaliation, US$100 crude becomes a plausible outcome. Goldman Sachs modelling indicates that oil sustained at this level materially increases US recession probability, which would have broad consequences across asset classes.
This article is intended for informational purposes only and does not constitute financial advice. All investment decisions should be made based on individual circumstances, risk tolerance, and independent research. Forward-looking statements and scenario analyses involve inherent uncertainty and should not be interpreted as predictions of actual market outcomes.
Want to Stay Ahead of the Next Major Market-Moving Discovery?
While geopolitical shocks like the Hormuz toll dominate headlines and reshape energy markets overnight, Discovery Alert's proprietary Discovery IQ model delivers real-time alerts on significant ASX mineral discoveries — turning complex data across more than 30 commodities into clear, actionable insights before the broader market reacts. Explore how historic mineral discoveries have generated substantial returns and begin your 14-day free trial today to position yourself ahead of the next major opportunity.