
August 13, 2026
Why the Uranium Market Operates on Two Separate Pricing Tracks
Most commodity markets function on a relatively unified price signal. Traders, producers, and consumers broadly reference the same benchmark. Uranium is structurally different. It operates across two distinct pricing mechanisms that can diverge significantly over time, and understanding the uranium long-term contract price and spot price disparity is essential for anyone seriously following the sector.
The uranium long-term contract price and spot price disparity is not a temporary anomaly or market inefficiency. It is a structural feature of how nuclear fuel procurement works, and it has profound implications for how investors, utilities, and mine developers interpret market conditions. Conflating the two pricing signals, or worse, treating spot as the dominant indicator, leads to a fundamentally distorted picture of the uranium market's health. Understanding uranium supply and demand volatility is therefore a critical first step for any informed market participant.
When big ASX news breaks, our subscribers know first
The Two-Price Architecture of Uranium: How It Actually Works
Spot vs. Long-Term Contract Pricing: Different Markets, Different Buyers
The spot uranium price represents the cost of near-term physical delivery, typically within 30 to 90 days. It is traded in a relatively thin market, with volumes that are small compared to annual global consumption. Because so few participants are active in the spot market at any given time, it is highly sensitive to sentiment shifts, speculative positioning, and short-term supply disruptions.
Long-term contract pricing operates on an entirely different logic. It reflects multi-year agreements, typically spanning three to fifteen years, negotiated directly between uranium producers and nuclear utilities. These contracts prioritise supply security and delivery certainty over price optimisation. Utilities accept a structural premium on contract pricing precisely because the alternative — sourcing fuel from a thin spot market for a reactor requiring uninterrupted operation — is operationally untenable.
The UxC and TradeTech Benchmarks
The two primary pricing indicators used as industry benchmarks are published by UxC and TradeTech. These are independent research and data firms that aggregate transaction data and survey market participants to produce both spot and long-term price indicators. Their figures are not exchange prices. They are indicative assessments based on deal flow, and they carry significant weight in contract negotiations and producer valuations.
It is worth noting that long-term contract prices are not publicly traded. They are negotiated confidentially between counterparties, which means the published indicators represent estimated ranges rather than precise transactional prices.
Current Pricing Snapshot: Where Spot and Long-Term Contracts Stand
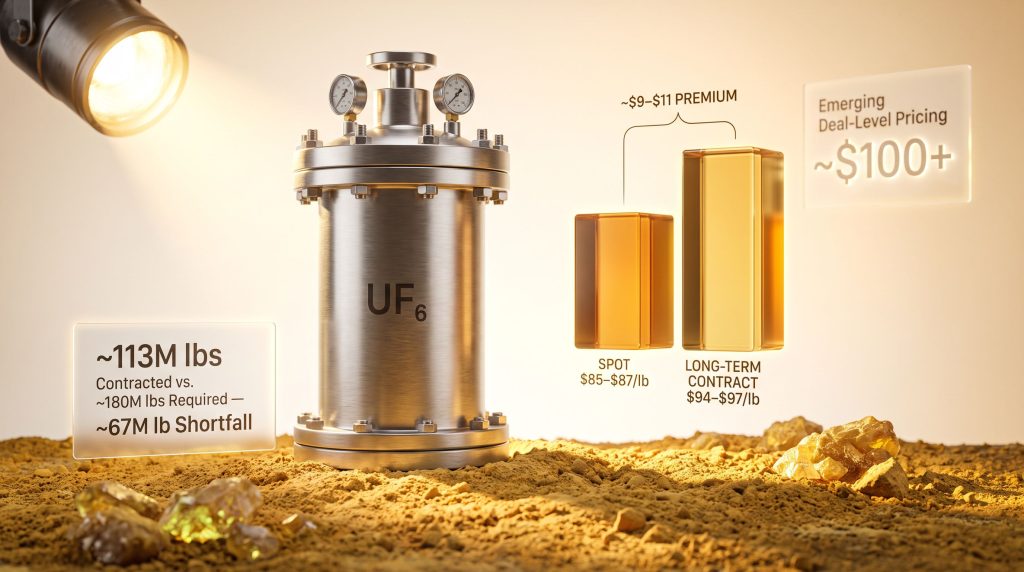
As of mid-2026, the uranium long-term contract price and spot price disparity has become one of the defining features of the current market cycle. Spot prices are trading in the range of $85 to $87 per pound, while long-term contract price indicators are tracking between $94 and $97 per pound, representing a structural premium of approximately $9 to $11 per pound. This spot and term price divergence is a key signal that market participants should monitor closely.
Significantly, anecdotal evidence from major producers including Paladin Energy suggests that discussions at the producer level are occurring at prices exceeding $100 per pound for contracts extending through 2030. This places the actual deal-level pricing meaningfully above the published indicator range.
| Pricing Metric | Price Range (USD/lb) | Market Function |
|---|---|---|
| Spot Uranium Price | $85 – $87 | Near-term cargo delivery |
| Long-Term Contract Indicator | $94 – $97 | Multi-year utility supply agreements |
| Structural Premium Gap | ~$9 – $11 | Supply security pricing differential |
| Reported Deal-Level Pricing | ~$100+ | Forward contracts through 2030 |
| European Spot Contracts (Euratom 2025) | $70.33 | Regional European market |
| European Multiannual Contracts (Euratom 2025) | $54.70 | Structured European utility contracts |
The European Euratom data illustrates how regional regulatory frameworks, counterparty structures, and import dependency profiles can produce significantly different contract pricing outcomes compared to global benchmarks. Investors interpreting conflicting price reports need to account for these structural regional differences.
Why $100 per Pound Is Psychologically and Structurally Significant
The $100 per pound threshold carries weight beyond its numerical value. It represents a level at which new mine development economics begin to shift materially toward viability. It is also a level that has historically attracted renewed utility contracting activity, as procurement teams justify accelerated deal-making to boards using round-number thresholds as internal benchmarks.
Long-term contract pricing moving from $80 to $94 to $97 within a compressed timeframe, with producer-level discussions reportedly above $100, signals a market that is tightening faster than public spot price charts suggest. Furthermore, current uranium market trends indicate that this tightening dynamic may persist well into the latter part of the decade.
The 13-Year Contracting Deficit: A Structural Overhang Entering the Market
One of the most consequential and least widely understood dynamics driving long-term contract price strength is the cumulative impact of more than a decade of systematic undercontracting by utilities. Nuclear operators, burned by the post-Fukushima price collapse and operating in an environment of low spot prices, consistently delayed long-term contracting well below replacement requirements.
The scale of this deficit is striking:
| Metric | Estimated Volume |
|---|---|
| Reported Contracted Volume (Recent Year) | ~113 million lbs |
| Estimated Global Replacement Requirement | ~180 million lbs |
| Annual Structural Shortfall | ~67 million lbs |
This 67 million pound annual gap means that utilities were collectively failing to replace even a fraction of the uranium they were consuming each year through forward contracts. Over thirteen years, this has created a deferred demand overhang that is now entering the market simultaneously, compressing contract availability and pushing pricing higher.
Utilities that delayed contracting the longest are now facing the tightest pricing and the most limited counterparty options. This dynamic — where procrastination compounds into structural disadvantage — is a key reason why contract price indicators have moved so aggressively even as spot prices remained range-bound for extended periods.
Why Uranium Supply Cannot Quickly Respond to Price Signals
The Mine Development Timeline: A Decade-Long Process
Unlike most commodity markets where higher prices can stimulate meaningful new supply within two to four years, uranium production operates on timelines that make rapid supply response structurally impossible. The sequence from exploration decision to nameplate production capacity is extraordinarily lengthy:
- Regulatory and permitting phase — approximately 7 to 10 years for approvals alone, across multiple jurisdictions with complex environmental and radiological assessment requirements.
- Construction phase — a minimum of 3 to 4 years post-approval for the physical build-out of processing and extraction infrastructure.
- Commissioning and ramp-up — an additional 1 to 2 years to move from first production to nameplate capacity, with significant operational tuning required.
- Remediation provisioning — financial obligations that accumulate from the moment production begins, requiring upfront financial assurance that constrains capital deployment.
The demand side of the equation operates on similarly extended timelines:
| Region | Average Reactor Construction Time |
|---|---|
| South Korea / China | ~7 years |
| United States | ~15 years |
| Global Average | ~10–12 years |
The convergence of decade-long supply lead times and decade-long demand lead times creates what analysts describe as a structurally tight market window. Consequently, pricing imbalances can persist far longer than in other commodity markets. In addition, the uranium supply deficit compounds these structural pressures further.
Why Final Investment Decisions Require Long-Term Contract Visibility
This is perhaps the most practically important insight for investors assessing uranium equities. Mine developers cannot make final investment decisions based on spot price confidence alone. A spot price of $87 per pound means relatively little to a project finance team evaluating whether a capital-intensive mine construction programme can be de-risked sufficiently to attract debt financing.
What lenders and project sponsors require is long-term contract offtake at pricing levels that cover all-in sustaining costs plus a sufficient margin to service debt and generate equity returns. This is why Deep Yellow's decision to delay its final investment decision, despite elevated spot prices, was rational rather than puzzling.
When a major uranium developer defers a final investment decision even as spot prices remain elevated, it is not a sign of project weakness. It is a signal that long-term contract pricing has not yet closed the gap to bankable levels. This distinction is critical for investors assessing development-stage uranium equities.
The Sulphur Supply Chain: An Underappreciated Production Constraint
Why Sulphuric Acid Is Critical to Uranium Production
Among the lesser-known structural constraints on global uranium supply is the availability and cost of sulphuric acid, the primary processing input for both in-situ recovery operations and heap leaching. In-situ recovery, which accounts for a substantial share of global uranium production, requires the continuous injection of acidic leach solution into ore-bearing formations. Without reliable sulphuric acid supply, production cannot proceed regardless of uranium price levels.
Sulphur itself is a byproduct of refined crude and diesel production. A significant portion of globally traded sulphur originates from refining operations in regions linked to the Strait of Hormuz. This creates a geopolitical exposure that is almost entirely absent from mainstream uranium market commentary.
The Kazakh Production Constraint Case Study
Kazakhstan is the world's dominant uranium producer, responsible for a substantial share of global output. Its major operations have faced well-documented sulphuric acid availability challenges of sufficient severity that investment in dedicated sulphur processing infrastructure became necessary. This is a capital-intensive response to an input supply problem, not a uranium price problem.
Similar dynamics have affected African uranium operations. Some processing facilities that rely on heap leaching have experienced significant disruption and financial penalties specifically because sulphuric acid availability was constrained. Sulphur price movements have surged dramatically in recent years, reportedly increasing several hundred percent over a five-year period, making it one of the standout performing commodity inputs of the current cycle.
For investors monitoring uranium production risk, sulphur price trajectory and Strait of Hormuz stability have become meaningful leading indicators for production cost pressures that do not appear in standard uranium supply analysis.
The next major ASX story will hit our subscribers first
Demand Drivers: What Is Fuelling Long-Term Contract Appetite
Several converging forces are accelerating utility demand for long-term uranium contracts, each operating on timelines that extend well into the 2030s:
- Data centre power demand — hyperscale computing facilities require reliable, carbon-free baseload power that intermittent renewables cannot consistently provide. Nuclear power has emerged as the preferred solution for major technology operators seeking to decarbonise large-scale energy consumption.
- Small Modular Reactors (SMRs) — while still in early deployment phases, SMR commercialisation is creating forward demand expectations for the 2027 to 2030 window that utilities and fuel cycle companies are beginning to factor into procurement planning.
- Chinese economic stimulus — China's nuclear build programme represents a counter-cyclical demand variable. A Chinese economic stimulus cycle that accelerates reactor commissioning timelines could create a demand surge that arrives ahead of available contracted supply, creating upward contract price pressure beyond current baseline expectations.
The scenario spectrum for long-term contract pricing reflects these variables:
- Base case: Global nuclear capacity expansion continues at the current pace, with long-term contract prices breaching $100 per pound in the near term as utility contracting volumes accelerate.
- Accelerated case: Chinese stimulus triggers faster reactor commissioning, driving a surge in contract demand that outpaces available supply and pushes pricing significantly above $100 per pound.
- Delayed case: Permitting backlogs and financing constraints extend new reactor timelines, keeping spot prices range-bound while term prices continue their structural climb.
What the Spot-to-Contract Disparity Means for Investors
The key analytical error made by many investors approaching uranium equities is treating the spot price as the primary valuation input. For uranium producers that have contracted a significant portion of their output at long-term prices, the contract price indicator — not the spot rate — determines forward revenue, margin structure, and balance sheet sustainability. Broader uranium market dynamics confirm that long-term pricing is consistently the more reliable valuation signal.
From a technical market perspective, uranium spot prices have historically lagged contract price movements during structural bull phases. When spot begins to close the gap with term pricing, it has tended to signal that utilities are returning to market in volume, creating a self-reinforcing demand cycle. The current period is consistent with historical patterns that have preceded sustained bull phases. According to world nuclear market data, this kind of cyclical utility re-engagement has historically been a reliable precursor to extended price strength.
Investors tracking only the spot price in the uranium market are reading approximately half the relevant information. Long-term contract pricing is where mine economics are decided, where capital is deployed, and where the real structural story of supply and demand is told.
For ASX-listed uranium exposure specifically, the trajectory of long-term contract pricing — particularly whether it can sustain levels above $100 per pound — is the key variable determining when delayed final investment decisions will be reinstated. The convergence of an accelerating uranium long-term contract price and spot price disparity, a 13-year contracting deficit, mine development timelines measured in decades, and underappreciated input supply constraints creates a structural setup that is difficult to replicate in most other commodity markets.
FAQ: Uranium Spot Price vs. Long-Term Contract Price
What is the current uranium spot price?
As of mid-2026, the uranium spot price is trading in the range of approximately $85 to $87 per pound, reflecting near-term cargo delivery market conditions rather than multi-year supply agreement dynamics.
What is the uranium long-term contract price in 2026?
Long-term contract price indicators are currently tracking between $94 and $97 per pound, with anecdotal producer-level evidence suggesting active discussions at above $100 per pound for contracts extending through 2030.
Why is the long-term contract price higher than the spot price?
Utilities pay a premium on long-term contracts because they require guaranteed delivery certainty and volume commitment across multi-year periods. The spot market cannot reliably provide the supply continuity that reactor operations require, making the premium a rational cost of supply security rather than a speculative phenomenon.
How long do uranium supply contracts typically last?
Uranium supply contracts typically run for three to fifteen years. Utilities with the longest contracting horizons tend to secure the most competitive pricing and the greatest supply certainty.
What price level triggers new uranium mine development?
This varies by project, jurisdiction, and cost structure. However, the general principle is that long-term contract pricing — not spot pricing — must reach and sustain levels sufficient to support project finance and generate acceptable equity returns before final investment decisions are made.
How does the uranium market differ from copper or gold pricing structures?
Uranium is unique in that the spot market is extremely thin, with volumes that represent a small fraction of annual consumption. The long-term contract market is where the majority of uranium is physically transacted, making it the structurally dominant pricing mechanism rather than a secondary reference point.
What is the UxC long-term uranium price indicator?
UxC is an independent uranium market research and data firm whose long-term price indicator is one of two primary industry benchmarks used in contract negotiations and producer valuations. It represents an estimated market price based on surveyed transaction data rather than an exchange-traded price.
Can utilities substitute long-term contracts with spot market purchases?
In theory, utilities can purchase on the spot market. In practice, the thin and volatile nature of the spot market makes it operationally unsuitable as a primary supply mechanism for facilities that require uninterrupted fuel supply. Spot purchases are typically used to supplement contracted volumes rather than replace them.
This article is intended for informational and educational purposes only. It does not constitute financial advice. All price figures, timelines, and market estimates referenced represent conditions as understood at the time of writing and are subject to change. Investors should conduct their own due diligence and consult a licensed financial adviser before making investment decisions. Forward-looking statements and scenario projections involve inherent uncertainty and should not be treated as predictions of future outcomes.
Want to Track the Next Major Uranium Discovery Before the Broader Market Does?
Discovery Alert's proprietary Discovery IQ model delivers real-time alerts on significant ASX mineral discoveries — cutting through complex data to surface actionable opportunities the moment they're announced. Explore historic discoveries and the returns they generated, then begin your 14-day free trial to position yourself ahead of the market.