July 23, 2026
Why the Nuclear Fuel Cycle Creates Its Own Forecasting Trap
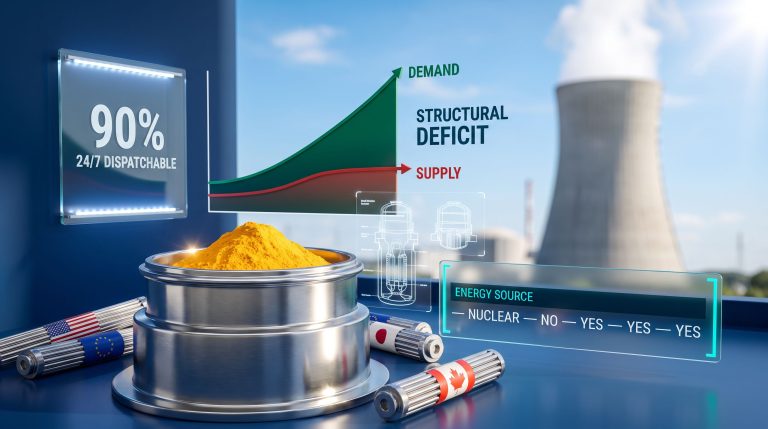
The most persistent challenge in uranium investing is not geological scarcity, geopolitical disruption, or even capital availability. It is the gap between what the industry measures and what investors actually need to know. Uranium market analysis operates within an information architecture that was never designed for price discovery or investment timing. It was designed for planning, procurement, and policy. When retail and institutional investors attempt to extract market timing signals from documents built for entirely different purposes, they consistently arrive at the wrong conclusions, not because the underlying data is fabricated, but because they are using the wrong instrument to solve the wrong problem.
Understanding the uranium supply demand pinch timing requires stepping outside the conventional analytical framework and recognising why every standard report on the subject systematically overstates supply while presenting demand as straightforward. The result is a structural blind spot embedded at the foundation of most uranium investment theses. Furthermore, the uranium supply-demand volatility that characterises the current market makes this blind spot particularly costly for investors operating without a precise analytical framework.
When big ASX news breaks, our subscribers know first
Why Standard Industry Reports Cannot Tell You When Uranium Prices Will Move
Capacity Versus Production: The Central Measurement Error
The World Nuclear Association's Red Book, the primary reference document for uranium supply and demand analysis, reports data that is technically accurate but functionally misleading for market participants. The core issue is that the Red Book reports nameplate capacity for known, currently producing mines rather than actual production output. These are not interchangeable figures, and treating them as equivalent produces supply projections that are chronically optimistic relative to real-world deliverability.
A mine's nameplate capacity represents its engineered maximum output under ideal operating conditions. Actual production is invariably lower due to maintenance cycles, input supply constraints, weather events, workforce limitations, and operational variability. When analysts aggregate nameplate figures across all producing mines, they construct a supply ceiling that the industry as a whole cannot realistically achieve in any given year.
This is not a minor discrepancy. The pattern of restarts and development projects that the industry has announced over the past decade provides a clear historical record: projects have consistently underdelivered relative to reported timelines and capacity expectations. As analysis conducted by Purepoint Uranium's research team has concluded, the WNA's figures were not wrong in their own context. They were simply built for policymakers and utilities engaged in long-range planning, not for investors trying to identify when physical shortages will translate into price movements.
The Fabrication Lag: Why U₃O₈ Production Is Not the Same as Fuel Delivery
Even if mine production figures were perfectly accurate, they would still misrepresent the actual availability of usable nuclear fuel. Mined uranium ore must pass through a multi-stage process before it can enter a reactor:
- Mining and milling converts ore to uranium oxide concentrate (U₃O₈), commonly called yellowcake
- Conversion transforms U₃O₈ into uranium hexafluoride (UF₆) for enrichment
- Enrichment increases the concentration of fissile U-235 isotopes to reactor-grade levels
- Fuel fabrication forms enriched uranium into ceramic pellets loaded into fuel assemblies
Each of these steps introduces time delays. From mine output to fabricated fuel ready for reactor loading, the total elapsed time typically spans one to two years. A supply forecast that lines up annual mine production against annual reactor consumption is comparing two points in a supply chain separated by a twelve-to-twenty-four-month lag. This structural timing mismatch means that a production increase in the current year does not translate into additional available fuel for perhaps two years, a factor that standard capacity-based forecasting consistently ignores.
The Operable vs. Operating Reactor Distinction on the Demand Side
The demand side of standard forecasts carries its own distortion, though it is less severe than the supply-side problem. Official forecasts frequently cite operable reactor capacity rather than operating reactor consumption. An operable reactor is one with a valid licence and the physical capability to run. An operating reactor is one actually generating power and consuming fuel.
The distinction matters because policy changes, regulatory approvals, and political decisions to restart or extend reactor operations are counted as demand contributors before a single kilogram of additional uranium fuel has been purchased or consumed. The result is a demand figure that includes theoretical future consumption from reactors that may not actually run for years, inflating the apparent demand trajectory and producing falsely urgent supply-demand crossover projections.
"The WNA and similar bodies produce documents that serve their institutional audiences well. The problem arises when investors treat policy planning tools as market timing instruments. That mismatch between purpose and application is the root cause of most analytical errors in uranium market forecasting."
What the Uranium Supply-Demand Pinch Actually Means
A Precise Definition for a Frequently Misused Concept
The uranium supply demand pinch timing debate is frequently muddied by imprecise language. The pinch is not simply a period when mine output falls below reactor count growth. It is the structural crossover point at which fabricated fuel deliveries can no longer satisfy active reactor consumption requirements. This distinction separates raw commodity analysis from operational nuclear fuel cycle analysis, and the difference has significant implications for timing and price.
Comparing raw mine output against theoretical reactor capacity, which is the approach most commonly used in market commentary, produces overly optimistic supply forecasts precisely because it conflates two very different measurements. The pinch, correctly defined, occurs downstream in the fuel cycle, at the point where actual fuel assemblies fail to meet actual reactor demand. Consequently, understanding the uranium market deficit as it currently stands is essential to interpreting when this crossover point will become visible to the broader market.
The Inventory Masking Effect
Complicating any precise timing estimate is the near-total opacity of uranium inventory data. Utilities hold strategic fuel reserves measured in years of forward consumption, and these inventories are not publicly disclosed in any standardised format. The industry has been consuming more uranium than it mines for an extended period, with the shortfall covered by drawdowns from inventories accumulated during the extended uranium market downturn following 2011.
As Purepoint Uranium's analytical work has described, this inventory drawdown does not eliminate the structural deficit. It merely masks the timing of when that deficit becomes visibly apparent in market behaviour. The physical imbalance may already exist. The market's recognition of that imbalance is a separate event, contingent on inventory visibility, producer signalling, and utility procurement behaviour changing in ways the market can observe.
Current Supply-Demand Snapshot: The Numbers Behind the Imbalance
2025 Adjusted Estimates
When the standard WNA capacity figures are adjusted for the capacity-versus-production gap, the fabrication lag, and the operable-versus-operating distinction on the demand side, a materially different picture emerges:
| Metric | 2025 Adjusted Estimate |
|---|---|
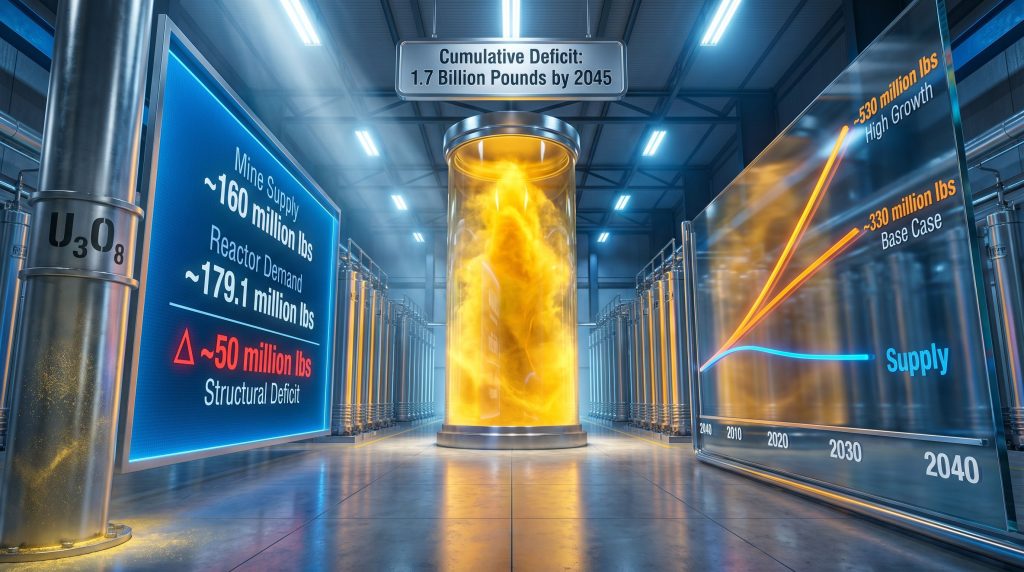
| Mine Supply | ~160 million lbs |
| Secondary Supply | ~25 million lbs |
| Total Available Supply | ~185 million lbs |
| Reactor Demand (Actual Consumption) | ~179.1 million lbs |
| Visible Pre-Adjustment Deficit | ~5 million lbs |
| Structural Deficit (Broader Adjusted Basis) | ~50 million lbs |
Important Disclaimer: These figures are drawn from Purepoint Uranium's independent research paper and represent adjusted estimates, not officially reported industry figures. They should be interpreted as a directional analytical framework rather than a precise accounting of physical uranium flows. Investors should conduct independent due diligence and consult primary sources including USGS and IAEA production data.
Why Secondary Supply Has Been Hiding the Problem
Secondary uranium supply, which includes material derived from Russian feed dismantlement programmes and recycled sources, has historically supplemented primary mine output. This secondary flow has effectively subsidised an extended period of underinvestment in primary production capacity. As these secondary sources diminish over time, primary production must not only meet growing demand but replace declining secondary contributions simultaneously, a compounding challenge that standard single-line supply forecasts rarely make explicit.
The Three Triggers That Confirm the Pinch Is Approaching
A Composite Signal Framework
Rather than attempting to predict a specific calendar date for the supply-demand crossover, Purepoint Uranium's research framework identifies three observable market triggers that, in combination, confirm the pinch is structurally imminent. Critically, these function as a composite signal system. No single event, whether a mine flood, an acid supply disruption, or a reactor restart announcement, constitutes confirmation on its own.
Trigger 1: Sustained Long-Term Contract Pricing Above $85 per Pound
Long-term contract prices for uranium reflect the considered, forward-looking views of utilities and producers operating on multi-year planning horizons. When these prices sustain above $85 per pound across multiple consecutive quarters, it signals that sophisticated procurement professionals are pricing in structural scarcity rather than temporary disruption. Based on available market commentary, long-term prices have reached and held near $90 per pound in the period following the Purepoint analysis, suggesting this trigger has been met.
Trigger 2: Multiple Consecutive Quarters of Reported Inventory Drawdowns
Confirmation of actual inventory depletion, as distinct from utility survey indications of drawdown intentions, provides the most direct evidence that secondary supply buffers are being exhausted. UXC's summer utility survey data has indicated that many utilities described inventories as adequate but signalled intentions to draw them down over the following one to two years. This is directionally supportive but does not constitute confirmed hard data.
Trigger 3: Restart and Development Projects Systematically Pushed Beyond 2027
When projects that were expected to add supply before 2027 are formally delayed, the supply increment that forecasts were counting on disappears from the near-term equation. This trigger has become more complex than simple delay, however. As discussed in Purepoint's research conversations, some anticipated Western supply pounds are not merely being delayed but are effectively being redirected toward non-Western offtake structures, making them permanently unavailable to the market that most Western analysts are modelling. The Bannerman Resources example illustrates this clearly: uranium that many investors classified as future Western supply has transitioned into a Chinese offtake structure.
"These three triggers function as a composite signal system, not standalone catalysts. No single event constitutes confirmation of the pinch. The market breaks when all three converge and sustain."
Why Single Catalyst Events Keep Disappointing Uranium Investors
The Sulfuric Acid Disruption: A Case Study in Analytical Overreach
In February 2024, Kazakhstan's major uranium producer confirmed sulfuric acid supply constraints affecting production. The investor community's immediate response was to treat this operational disruption as a structural supply shift, extrapolating a temporary input shortage into a permanent change in Kazakhstan's production trajectory.
Large-scale mining operations have both the incentive and the resources to solve operational problems rapidly. The sulfuric acid situation was resolved through procurement adjustments and alternative sourcing, a relatively standard industrial response to input supply disruption. Framing it as a structural catalyst was, in retrospect, wishful thinking rather than rigorous analysis.
This pattern reflects a well-documented behavioural tendency in niche commodity markets: when investors are positioned for a thesis and waiting for confirmation, they tend to assign disproportionate significance to any data point that appears supportive, regardless of its durability.
Accumulation, Not Catalyst: How the Pinch Actually Arrives
The uranium supply demand pinch timing debate is fundamentally about accumulation, not about any single precipitating event. The deficit builds through the accumulation of dozens of smaller signals: production misses, project delays, rising term prices, utility inventory drawdowns, origin-bound contracting, and east-west supply bifurcation. No single item on that list moves the market. The composite of all of them, tracked systematically over time, is what defines the trajectory toward a structural recognition event.
As Purepoint's research framework acknowledges, this requires tracking pages of individual data points, each of which moves the probability curve either toward or away from the crossover date, and summing their directional effect. This is analytically demanding, opaque, and incompatible with the catalyst-driven, event-reactive style of investment commentary that dominates the retail uranium space.
Investor Bias Warning: The uranium market has a documented history of treating temporary operational disruptions as permanent supply shifts. Durable supply shortfalls emerge from structural underinvestment and systemic delivery failure, not from single-quarter operational incidents.
The next major ASX story will hit our subscribers first
Supply vs. Demand Modelling: Where the Asymmetry Lies
Demand Modelling Is Comparatively Reliable
One of the clearest insights from Purepoint's analytical work is that the demand side of the uranium equation has been reasonably well modelled, while the supply side has been systematically overstated. This asymmetry is important because it means the core bullish thesis is not about demand forecasting being too conservative. It is about supply forecasting being too optimistic.
Reactor schedules are known years in advance. Fuel procurement cycles are long and contractually structured. The fuel requirements of operating reactors can be estimated with reasonable precision from publicly available reactor specifications and operating patterns. Furthermore, the uranium market dynamics shaping 2025 and beyond reinforce why demand-side reliability makes the supply-side overstatement all the more consequential.
| Dimension | Demand Side | Supply Side |
|---|---|---|
| Data Quality | High: reactor schedules known years ahead | Low: capacity does not equal production |
| Primary Risk | Modest upside from policy-driven restarts | Chronic overstatement of deliverable output |
| Adjustment Scale Required | Minor | Significant |
| Transparency Level | Moderate | Opaque |
| SMR Near-Term Impact | Negligible | Not applicable |
Small Modular Reactors Are Not a Near-Term Demand Factor
A frequent narrative in uranium investment commentary invokes small modular reactors (SMRs) as a significant near-term demand driver. From a fuel cycle perspective, this is premature. The fuel requirements of any realistic near-term SMR deployment are immaterial relative to the fuel consumption of the existing conventional reactor fleet. You would need a substantial number of SMRs just to match the fuel requirements of a single conventional large reactor. Until the SMR commercial deployment pipeline is far more advanced, including demonstrated regulatory approval pathways and confirmed construction timelines, SMR demand contributions should be excluded from near-term supply-demand crossover calculations.
Long-Term Demand Trajectory Through 2040
While near-term SMR contributions are negligible, the longer-term demand picture supported by conventional reactor expansion is substantial. Under various projection scenarios:
| Scenario | 2040 Demand Forecast |
|---|---|
| Conservative | ~278 million lbs |
| Base Case | ~330 million lbs |
| High Growth | ~530 million lbs |
Global nuclear generating capacity is projected to grow from current levels toward approximately 438 GW by 2030 and 746 GW by 2040, driven by new build programmes in Asia, renewed commitment to existing fleets in Europe and the United States, and the intersection of AI data centre power demand with the growing recognition that baseload carbon-free electricity requires nuclear generation at scale. Under base-case demand growth, cumulative structural deficits could reach 1.7 billion pounds by 2045, a figure that underscores why the supply side's chronic underperformance relative to nameplate capacity projections has such significant long-term implications.
Why Mine Development Timelines Are Structurally Unreliable
The Execution Gap in Uranium Project Development
The uranium industry has a persistent pattern of project timelines slipping beyond initial announcements. This is not unique to uranium, but several characteristics of uranium development compound the execution risk:
- Price discovery failures: Projects require financing before price certainty exists, creating a circular dependency that delays final investment decisions
- Skill set scarcity: Uranium engineers, hydrogeologists with in-situ recovery experience, and nuclear fuel cycle specialists represent a thin global talent pool
- Funding dependency: Junior developer financing depends on equity markets that have proven unreliable over uranium's extended price cycle
- Regulatory complexity: Uranium's dual classification as an energy commodity and a proliferation-sensitive material creates regulatory layers absent in conventional mining
When a senior technical figure departs a development project, as seen at various junior developers, the knock-on effects extend far beyond that individual's contribution. Replacement timelines, re-permitting requirements, and revised technical studies can add years to development schedules, further eroding the supply increment that standard industry forecasts are counting on.
Western Supply Pounds Are Disappearing East
Beyond simple delay, a structural shift in uranium supply destination is underway. Projects previously classified as future Western supply contributors are being captured by non-Western offtake arrangements, effectively removing those pounds from the market that Western utilities and Western analysts are modelling. This is not a risk. It is an observable ongoing trend with direct implications for the supply-demand calculation that underpins the Western uranium investment thesis. In addition, US uranium production reaching a six-year high has done little to offset this broader structural redirection of supply away from Western markets.
U.S. Domestic Production Remains Structurally Insufficient
U.S. domestic uranium production at approximately 2.16 million pounds per year represents a negligible fraction of domestic reactor requirements. Regardless of domestic policy initiatives encouraging nuclear power or domestic fuel supply security, U.S. mine output cannot materially close the gap between domestic production and domestic consumption on any timeline relevant to investors currently evaluating the sector.
The Four Stages to Market Recognition of the Pinch
The critical analytical distinction in Purepoint's framework is between when the physical imbalance exists and when the market recognises and prices that imbalance. These are two separate events, potentially separated by months or years. The recognition process is expected to unfold across four observable stages:
-
Producer Behavior Shift: Producers begin restraining output to preserve value rather than maximise volume. Kazakhstan's strategic pivot away from maximum production toward value-driven output decisions is the clearest current example. MacArthur River's 25% production shortfall against guidance represents a different expression of the same dynamic.
-
Term Market Tightening: Long-term contract prices hold above $90 per pound. Tender participation thins as fewer counterparties bid per tender. Contract durations extend beyond 2035. Origin-bound contracting requirements signal that availability, not just price, is becoming a contracting consideration. The spot-term price divergence visible in current market data is a particularly telling indicator of this stage progressing.
-
Spot Price Structural Step-Up: Spot price volatility gives way to a sustained higher floor. The market appears to have tested an $85 floor recently, but multiple additional quarters of confirmation are required before institutional conviction builds around a genuinely higher structural base.
-
Utility Procurement Panic: Utilities shift from price-reactive procurement, where they move when prices look attractive, to availability-driven procurement, where their primary concern becomes securing access rather than negotiating price. This final stage has not yet manifested based on available market intelligence.
Critical Timing Note: By the time Stage 4 is observable, late-cycle entry has almost certainly already occurred. Investors tracking the Stage 2 to Stage 3 transition are operating in the most actionable window. The Q4 2026 to Q1 2027 period has been identified as the probable market recognition window based on the adjusted data, though this is a range estimate contingent on visible stage progression rather than a fixed calendar date.
The Echo Chamber Problem in Uranium Investment Communities
Recycled Analysis and the Danger of the Same Graph, Photocopied to Blur
One underappreciated structural weakness in uranium market analysis is the reliance of financial institutions on a small number of primary analytical sources. The uranium market is not large enough to justify dedicated analytical teams at most investment banks, so the same WNA capacity figures, the same PowerPoint graphics, and the same talking points circulate through the investment community with each successive reuse amplifying the original distortions.
This creates an echo chamber dynamic that is especially dangerous for timing-sensitive investment decisions. When the same overly optimistic supply projections are reproduced across dozens of investment research notes, the consensus becomes entrenched not because it has been validated by independent analysis but because its repetition creates the appearance of independent corroboration. For a broader perspective on how forecasters consistently overstate supply, the Crux Investor analysis of uranium supply underestimation provides valuable independent context on this structural problem.
Opportunity Cost Realism and Position Sizing
The uranium investment thesis has been structurally valid for an extended period. What has repeatedly proven unreliable is the assumption that the market would recognise and price the imbalance on any particular timeline. Investors who have held uranium equity positions since 2019 or 2020 have experienced the frustration of a correct thesis playing out on a much slower timeline than anticipated, incurring significant opportunity cost relative to capital deployed in other sectors over the same period.
The pragmatic conclusion from this experience is not to abandon the thesis but to size positions appropriately for a market where timing is bounded but not precisely predictable, and to focus capital allocation on companies with genuine operational quality rather than those whose investment case depends entirely on a commodity price rerating.
"The structural imbalance case for uranium has not weakened. What has proven unreliable is the assumption that the market would price the imbalance quickly. The more durable approach focuses on identifying operationally sound producers and developers that will outperform regardless of whether the pinch arrives in Q4 2026 or 2028."
Active Monitoring Checklist: What to Watch Right Now
For investors tracking uranium supply demand pinch timing in real time, the following indicators represent the most informative available signals:
- Long-term contract price sustaining above $85 to $90 per pound across multiple consecutive quarters
- Confirmed utility inventory drawdown data from multiple operators, not merely survey indications of intent
- Development projects with pre-2027 timelines formally revised beyond 2027 in official company disclosures
- Spot price establishing and defending a higher structural floor across at least two to three quarters
- Utility procurement language in earnings calls and public statements shifting from price optimisation to availability security
- Producer output guidance revised downward or maintained below nameplate capacity across multiple major operators
- Origin-bound contracting requirements tightening in long-term tender documentation
- Further instances of anticipated Western supply pounds transitioning to non-Western offtake structures
Frequently Asked Questions: Uranium Supply-Demand Pinch Timing
What is the uranium supply-demand pinch and why does timing matter?
The uranium supply-demand pinch describes the structural crossover at which fabricated fuel deliveries can no longer meet active reactor consumption requirements. Timing matters because investors entering the market too early face extended holding periods with significant opportunity cost, while those entering too late capture only a fraction of the price movement.
Has the uranium deficit already started?
Based on adjusted supply-demand modelling, the physical deficit likely already exists and is being masked by ongoing inventory drawdowns. The market has not yet fully recognised or priced this condition, which is why the spot price has not yet reflected the underlying structural imbalance. According to the World Nuclear Association's supply overview, uranium resources exist in sufficient quantity over the long term, however investment in production capacity remains critical to meeting projected demand growth.
Why do industry forecasts consistently overestimate uranium supply?
Industry reports are designed for policy planning and utility procurement, not market prediction. They report nameplate capacity rather than actual production, exclude the fabrication lag between mining and fuel delivery, and do not adjust for the difference between operable and operating reactors.
What role do AI data centres play in uranium demand?
The intersection of AI infrastructure buildout with the recognition that baseload carbon-free power requires nuclear generation is contributing to renewed reactor construction and reactor life extension programmes. However, this demand growth materialises slowly through new capacity additions and does not represent a near-term step change in fuel consumption.
When is the uranium spot price expected to reflect the structural deficit?
The Q4 2026 to Q1 2027 period has been identified as the probable market recognition window based on adjusted analytical data. However, this is a range estimate that depends on observable stage progression across producer behaviour, term market tightening, spot price floor establishment, and utility procurement behaviour change. It is not a fixed prediction.
Key Takeaways
-
The uranium physical deficit is not a future risk. Adjusted modelling suggests it is a present condition, obscured by inventory drawdowns and fundamental market opacity
-
Supply forecasting has been systematically overstated due to capacity-versus-production conflation. Demand forecasting is comparatively reliable and requires only minor adjustments
-
Three observable market triggers, sustained long-term prices above $85, confirmed inventory drawdowns, and project timelines pushed beyond 2027, provide a more actionable framework than any calendar-date prediction
-
Some anticipated Western supply pounds are not merely being delayed but are permanently transitioning to non-Western offtake, reducing available supply beyond what standard delay-based forecasts capture
-
The market recognition window is estimated at Q4 2026 to Q1 2027 but is contingent on visible progression through the four-stage recognition process
-
Cumulative structural deficits could reach 1.7 billion pounds by 2045 under base-case demand growth scenarios, making the long-term supply challenge far larger than near-term price movements imply
-
Investors who focus on a single catalyst event are likely to either miss the move or be repeatedly disappointed. Those tracking the multi-stage recognition process and selecting operationally superior companies are better positioned for durable returns
Readers seeking further analytical detail on uranium market structure and supply-demand modelling frameworks can access independent research papers published by Purepoint Uranium through their public research portal at purepoint.ca, where the underlying methodology discussed in this article is available for independent review.
Want to Know When the Next Major Mineral Discovery Hits the ASX?
Discovery Alert's proprietary Discovery IQ model delivers real-time alerts the moment significant ASX mineral discoveries are announced, turning complex market data into actionable investment insights for both short-term traders and long-term investors. Start your 14-day free trial today and explore how historic discoveries have delivered extraordinary returns to investors who positioned themselves early.