August 22, 2026
The Uranium Utility Contracting Cycle: Why Spot Prices Are the Wrong Signal to Watch
Nuclear energy markets operate on a fundamentally different clock to almost every other commodity sector. While oil traders react to weekly inventory reports and copper prices shift on daily manufacturing data, uranium demand is shaped by decisions made years in advance, negotiated in private, and rarely disclosed in full. Understanding this distinction is not merely academic — it is the single most important factor separating investors who correctly time the uranium utility contracting cycle from those who exit the sector precisely when the underlying thesis is about to be confirmed.
The uranium market has now entered what experienced sector participants describe as the third meaningful equity pullback since 2021. Producers, developers, and exploration-stage companies have broadly declined 40 to 50% from their 52-week highs by mid-2026, even as spot prices moved toward $100 per pound earlier in the year before retreating. The apparent contradiction — deteriorating equity prices alongside a structural supply deficit that has never been resolved — reveals something important about how this market actually functions.
When big ASX news breaks, our subscribers know first
Why Spot Prices Are a Misleading Indicator of Uranium Market Health
The financial media and many retail participants treat the daily uranium spot price as the primary gauge of sector health. This creates a persistent and exploitable misunderstanding of the market's actual mechanics.
Spot transactions in uranium represent a structurally small share of total annual demand. The World Nuclear Association estimates that the vast majority of uranium changes hands through long-term bilateral contracts negotiated well outside public view, with spot volumes accounting for only a fraction of the physical pounds consumed by the world's operating reactors each year. A spot price move — upward or downward — tells you almost nothing about whether utilities are actively contracting, which is the only signal that genuinely matters for equity re-ratings. Furthermore, the uranium market dynamics at play make this distinction even more consequential for investors positioning ahead of the next contracting wave.
Utilities operate on procurement horizons that extend three to seven years ahead of actual reactor fuel loading requirements. This is not inefficiency — it is a rational response to the sequential nature of the nuclear fuel cycle. Uranium must first be converted, then enriched, then fabricated into fuel assemblies before it can be loaded into a reactor. Each of these steps requires its own long-term contract, and uranium sits at the beginning of that chain, meaning it is typically contracted last and well in advance.
The Four Signals That Actually Matter
Rather than monitoring spot price feeds, experienced uranium sector participants focus on a different set of leading indicators:
-
A measurable acceleration in utility Requests for Proposals (RFPs) issued to producers and intermediaries, signalling that buyers are re-entering the procurement process simultaneously.
-
Tightening of contract terms, including shorter lead times for delivery and reduced flexibility in price mechanisms, which reflects eroding buyer negotiating power as available supply shrinks.
-
Rising volumes in private, bilateral off-market transactions that bypass the spot market entirely and are rarely disclosed publicly.
-
A shift in spot market participation back toward physical utilities from financial intermediaries and funds, which indicates that real procurement urgency is beginning to displace financial speculation.
Key Insight: A surge in RFP issuance is often the earliest observable leading indicator of a new contracting wave. In mid-2026, market participants noted a jump to more than half a dozen concurrent utility RFPs after an extended period with almost none — a signal that had not been present at any point during the prior nine months of equity weakness.
The Structural Architecture of the Uranium Utility Contracting Cycle
Defining the Cycle's Key Parameters
| Cycle Feature | Detail |
|---|---|
| Average Cycle Duration | 10 to 12 years, anchored by deep inventory buffers and multi-year procurement horizons |
| Typical Contract Terms | Bilateral agreements spanning 3 to 15 years; price mechanisms often incorporate base escalators above spot |
| Inventory Buffer Duration | Utilities can sustain operations for 12 to 36 months without new spot or contract purchases |
| Behavioural Pattern | Extended below-replacement contracting draws down inventory; utilities then converge simultaneously |
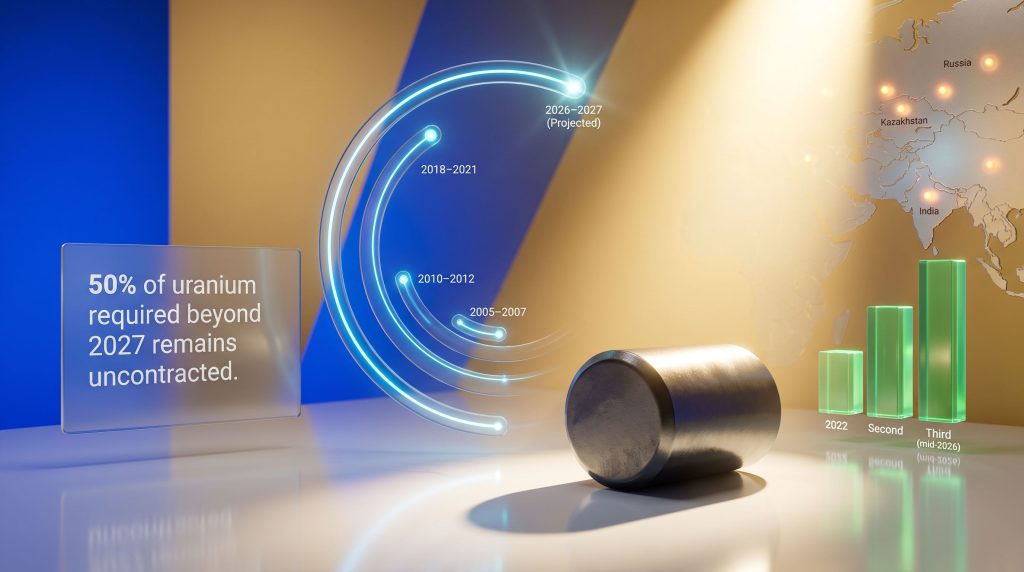
| Current Phase | 2025 to 2027 new contracting wave forming; an estimated 50% of uranium required beyond 2027 remains uncontracted |
The inventory buffer dynamic is particularly important and is not widely understood outside specialist circles. Because a nuclear utility can draw on existing stockpiles for one to three years without consequence, there is no immediate operational pressure forcing procurement decisions. This enables extended periods of below-replacement contracting — sometimes lasting several years — without triggering visible market stress. When the buffer strategy approaches its limit across multiple utilities simultaneously, the resulting demand wave is structurally concentrated and difficult for the supply base to absorb quickly.
Mine development timelines compound this problem. A new uranium mine typically requires five to fifteen years from discovery to sustained production, meaning that no volume of capital investment committed today can meaningfully close a supply gap that materialises within the current contracting window. The uranium market deficit therefore remains a structural feature rather than a temporary condition.
Historical Contracting Waves: The Pattern Is Consistent
| Wave Period | Market Context | Price Environment |
|---|---|---|
| 2005–2007 | Last major procurement surge cycle | Spot rose from approximately $12/lb to above $120/lb |
| 2010–2012 | Post-Fukushima supply uncertainty; reactor shutdowns | Moderate price recovery before prolonged decline |
| 2018–2021 | Cycle-low contracting; inventory drawdown phase | Subdued spot, ranging from sub-$30/lb to mid-$40s |
| 2026–2027 (Projected) | New wave forming; structural deficit intact | Spot approached $100/lb in early 2026 |
The 2005 to 2007 cycle remains the most instructive historical reference. The price move from approximately $12 per pound to over $120 per pound occurred within roughly two years, driven not by sudden demand creation but by the simultaneous recognition among utilities that available contracted supply was insufficient. The price spike forced buyers into a competitive procurement environment they had deferred preparing for.
Three Pullbacks, Three Recovery Triggers: A Repeating Pattern Since 2021
The uranium equity market has now experienced three distinct drawdown-and-recovery sequences since 2021. Each has found a floor at a progressively higher base level, and each recovery has been triggered by a specific, visible category of market event rather than by spot price movement alone.
| Pullback | Approximate Duration | Recovery Catalyst |
|---|---|---|
| First (2022) | Majority of calendar year 2022 | Utilities began replacement-rate contracting; supply disruptions in Niger; major producer output guidance reductions |
| Second | Multi-month correction | Sprott Physical Uranium Trust executed approximately $200 million in spot market purchases; new US domestic supply policy measures introduced |
| Third (Current, mid-2026) | Approximately nine months as of mid-2026 | Awaiting: utility contract awards from accelerating RFP activity |
The pattern that emerges across all three cycles is significant. Each successive trough has been structurally higher than its predecessor, reflecting the persistent tightening of the supply-demand balance. The deficit that underpins the sector's investment thesis has not diminished across any of these drawdowns. What has changed is simply the market's willingness to price that thesis ahead of confirmatory evidence. In addition, the uranium supply-demand volatility observed across these periods underscores how equity markets frequently misread short-term price signals as structural deterioration.
Analytical Note: The current pullback's duration of approximately nine months aligns closely with the duration of the two prior corrections, suggesting the cycle may be approaching a resolution point. Whether that resolution arrives via contract awards, a large physical purchase programme, or a production guidance reduction from a major supplier will likely determine the catalyst's magnitude.
Why Retail and Institutional Investors Read the Same Market Differently
The behavioural asymmetry between retail and institutional participants in uranium equities is one of the most consistent features of the cycle and one of the least discussed. Retail investors, tracking spot prices as a proxy for sector health, tend to interpret extended price weakness or spot price declines as evidence that the fundamental thesis is deteriorating. This interpretation drives selling that amplifies drawdowns beyond what supply-demand fundamentals would justify on their own.
Institutional and specialist investors who understand utility procurement timelines are more likely to view the same periods of equity weakness as accumulation windows. From their perspective, the absence of visible contracting activity is a temporary state — a function of where utilities sit in their inventory cycle — rather than a signal of thesis failure. This divergence in interpretation creates the characteristic volatility profile of uranium equities: sharp drawdowns during contracting gaps, followed by rapid and often significant re-ratings once contract awards confirm the cycle's activation.
What Makes the Current Cycle Structurally Different From Prior Waves
The Supply Deficit Is Not Cyclical — It Is Structural
The scale of uncovered future demand in the current cycle is unusually large. Estimates consistently indicate that at least 50% of uranium required to fuel the existing global reactor fleet beyond 2027 remains uncontracted. This figure does not account for fleet expansion — it represents simply the volume required to keep currently operating reactors fuelled. The procurement obligation is not contingent on new reactor construction or policy changes; it is a mathematical necessity of operating the existing fleet.
Supply disruptions in key producing jurisdictions have made this gap harder to close from the production side. Output guidance reductions from major producers and ongoing operational constraints in West African supply corridors have compressed the pool of available contracted supply, reducing the buffer that might otherwise give utilities more time to defer procurement decisions.
The Geopolitical Asymmetry in Supply Security Responses
One of the more unusual features of the current cycle is the uneven pace at which different national buyers are responding to supply risk. Several governments — particularly in Asia and Eurasia — have moved visibly and decisively. India, Russia, and Kazakhstan have all been active in executing bilateral state-to-state uranium supply agreements that effectively pre-empt competitive access for other buyers. This activity is shifting available supply toward markets with established bilateral frameworks.
The United States presents a contrasting picture. Despite formally designating uranium as a critical mineral and introducing domestic supply support measures, the Russian uranium import ban has further complicated procurement options for US utilities, leaving them more exposed to tightening supply conditions. This asymmetry is regarded by knowledgeable market participants as an unusual and potentially consequential feature of the current cycle, given the scale of US nuclear generating capacity and the magnitude of its forward procurement requirements.
Speculative Consideration: If the US posture toward bilateral uranium supply security remains comparatively passive as the contracting wave accelerates, American utilities may be forced to compete in a market where a meaningful share of available supply has already been pre-committed through state-level agreements in other jurisdictions. This scenario could compress the available supply pool for open-market procurement and intensify price pressure during the contracting window.
The Anatomy of a Contracting Wave: Three Phases Investors Should Understand
Phase 1: RFP Acceleration
The first observable signal of an emerging contracting wave is a measurable increase in formal Requests for Proposals issued by utilities to producers and intermediaries. After extended periods of minimal RFP activity, a sudden cluster of concurrent proposals signals that multiple buyers are re-entering the procurement process simultaneously. The mid-2026 appearance of more than half a dozen active RFPs — following months with almost none — fits this pattern precisely.
Crucially, RFP issuance does not immediately translate into contract awards. A lag of several months to a year is typical as utilities evaluate competing proposals, negotiate terms and conditions, and secure internal budget approvals. Autumn is historically a period of elevated contracting activity, as procurement decisions tend to align with utility annual budget and fuel planning cycles. Uranium market trends consistently support this seasonal pattern across multiple historical cycles.
Phase 2: Contract Awards and the Re-Rating Mechanism
Contract awards are the event class that historically triggers equity re-ratings across the sector. Unlike RFP issuance, which signals intent, a contract award represents verifiable, large-volume physical demand being committed at disclosed or inferable prices. This is the visible transaction evidence that investors are conditioned to require before treating a price move as the beginning of a durable cycle.
The opacity of the uranium contracting market means that contract details — including exact volumes, price mechanisms, and duration — are rarely disclosed in full. However, even partial disclosure of a contract award from a major utility carries significant signalling value because it confirms that procurement urgency has reached the execution stage. According to Cameco's supply-demand analysis, the structural gap between committed supply and projected reactor demand continues to widen, reinforcing why contract awards carry such outsized market significance.
Phase 3: Equity Re-Rating Sequence Across the Sector Hierarchy
Once contract awards become visible, re-ratings tend to follow a consistent sequence:
-
Producers re-rate first, as contracted revenue visibility directly supports forward earnings models and reduces the discount rate applied to future cash flows.
-
Developers follow, as contracted producer pricing establishes a floor that justifies project economics at current capital costs, improving the probability of financing.
-
Exploration-stage companies re-rate last and most leveraged, as discovery value is amplified by a higher long-term price assumption embedded across the sector.
This sequencing means that exploration companies typically offer the most asymmetric upside in a contracting cycle activation, but also the longest wait from the initial re-rating signal to full valuation realisation.
The next major ASX story will hit our subscribers first
How Exploration Companies Navigate the Capital Efficiency Challenge
The Cost Structure of Athabasca Basin Exploration
Exploration-stage uranium companies face a specific capital efficiency problem during contracting gaps. A single drill programme at an Athabasca Basin project can cost upwards of $3 million. Funding multiple simultaneous programmes independently in a depressed equity market could require raising $10 million or more through share issuances at discounted prices, imposing permanent dilution on existing shareholders.
The Athabasca Basin in northern Saskatchewan remains one of the world's premier uranium exploration addresses, hosting some of the highest-grade uranium deposits ever discovered. Grades in the basin's unconformity-hosted deposits routinely exceed 1% U3O8, compared to global mining averages closer to 0.05 to 0.1%. This extraordinary grade advantage means that even relatively small tonnage discoveries can represent substantial economic value, justifying the high per-metre cost of deep drilling in challenging geological conditions.
Joint Venture Structures as a Capital Preservation Approach
The joint venture model has become a preferred capital management tool for exploration companies seeking to maintain geological momentum through a weak equity market without bearing the full cost burden independently. Under a typical structure, a larger and better-capitalised senior partner funds the majority of programme costs in exchange for a majority project interest, while the junior partner retains a reduced, non-controlling interest and earns a management fee.
| Factor | Joint Venture Advantage | Joint Venture Risk |
|---|---|---|
| Capital efficiency | Senior partner absorbs majority of drill costs | Programme pace dependent on partner's own capital priorities |
| Dilution management | Reduced need for equity raises at depressed prices | Reduced ownership stake in discovery upside |
| Project advancement | Multiple projects can advance concurrently | Partner may redirect focus based on their own strategic shifts |
| Risk diversification | Exposure spread across multiple JV partners | Concentration in one partner amplifies impact of their strategic changes |
The trade-off is not trivial. Larger partners have their own capital allocation priorities that may diverge from an exploration company's preferred pace. Historical precedent demonstrates that major mining companies have optioned exploration projects and subsequently redirected capital elsewhere within the same region, leaving junior partners with paused programmes and reduced strategic flexibility.
A notable example involves Rio Tinto, which optioned an Athabasca Basin exploration project approximately fifteen years ago before eventually redirecting its attention to other priorities within the region. Maintaining active joint ventures with multiple senior partners across different projects is one way of distributing this risk — if one partner's priorities shift, the entire exploration programme is not paused as a result.
Strategy Insight: The joint venture model is most effective as a capital preservation tool when applied across multiple partnerships simultaneously. A portfolio of two or more active joint ventures, each with a different senior partner, reduces the binary risk of a single programme pause determining the company's entire near-term activity profile.
Catalysts That Could Accelerate the Next Contracting Wave
Several specific developments, if they materialise, could compress the timeline to visible contract awards and the equity re-rating sequence that follows:
-
RFP conversion to contract awards by autumn 2026: The cluster of RFPs noted in mid-2026 represents a plausible pathway to publicly visible contract awards within the same calendar year, consistent with historical procurement timelines.
-
Production guidance reductions from Tier 1 producers: Downward revisions to output guidance from major suppliers would tighten the available contracted supply pool and accelerate urgency among utilities still holding uncovered positions.
-
Large-scale physical purchasing programmes: Activity from financial vehicles such as the Sprott Physical Uranium Trust, which previously deployed approximately $200 million in spot market purchases, has historically compressed the timeline to utility re-engagement by removing physical pounds from the accessible supply pool. Indeed, as The Oregon Group's analysis of utility re-engagement highlights, utilities returning to the market in force can rapidly shift the procurement dynamic.
-
Visible US bilateral supply security activity: A shift toward more active US government or utility-level engagement in bilateral uranium supply agreements — bringing US procurement behaviour closer to the state-level activity visible in Asian markets — would represent a significant sentiment catalyst given the scale of forward US procurement requirements.
-
SMR procurement planning: While Small Modular Reactors are not yet a near-term uranium demand driver at scale, utilities with SMR development commitments are beginning to include SMR fuel requirements in long-term procurement planning assumptions. As SMR timelines become more concrete, this demand layer could begin influencing contracting decisions within the current decade.
Frequently Asked Questions: Uranium Utility Contracting Cycle
What is the uranium utility contracting cycle?
The uranium utility contracting cycle is a recurring 10 to 12 year pattern in which nuclear power operators defer long-term uranium supply agreements during periods of inventory adequacy, then re-enter the procurement market in a concentrated wave. This behavioural convergence creates demand surges that the supply base, constrained by 5 to 15 year mine development timelines, cannot rapidly absorb, driving significant price and equity market responses.
Why do uranium equities lag spot price movements?
Uranium equities are re-rated by visible, large-volume contracting events rather than spot price changes alone. Because spot transactions represent a small fraction of total uranium demand and contract details are rarely disclosed publicly, investors require verifiable evidence of utility procurement activity before treating a price move as a durable cycle signal.
What percentage of future uranium demand is currently uncontracted?
Estimates indicate that at least 50% of uranium required to fuel the existing global reactor fleet beyond 2027 remains uncontracted as of the mid-2020s, representing a substantial volume of unavoidable future procurement that must enter the market regardless of short-term price conditions.
What is an RFP in the uranium market?
A Request for Proposal is a formal procurement document issued by a nuclear utility to uranium producers and intermediaries, soliciting supply offers for potential long-term contracts. An acceleration in RFP issuance is one of the earliest observable signals that utilities are re-entering the contracting market, typically preceding actual contract awards by several months to a year.
How long does a uranium contracting wave typically last?
Historical contracting waves have spanned multiple years within the broader 10 to 12 year cycle. Once utilities begin contracting at replacement-rate levels or above, procurement activity typically persists for two to four years as the full scope of uncovered requirements is addressed through successive contract negotiations.
This article is intended for informational purposes only and does not constitute financial advice. Uranium equity markets involve significant risk, and forward-looking statements regarding supply-demand dynamics, price projections, and contracting timelines involve inherent uncertainty. Past market cycles are not necessarily indicative of future outcomes. Readers should conduct their own due diligence or consult a qualified financial adviser before making investment decisions.
Want to Catch the Next Major ASX Mineral Discovery Before the Market Does?
Discovery Alert's proprietary Discovery IQ model delivers real-time alerts on significant ASX mineral discoveries, turning complex data across more than 30 commodities into clear, actionable insights for both short-term traders and long-term investors — explore historic discovery returns on Discovery Alert's discoveries page to understand what early positioning can mean, and begin your 14-day free trial at Discovery Alert to secure your market-leading advantage.