
July 17, 2026
The Structural Forces Behind a Market That Cannot Repeat Itself
Commodity markets have a long history of producing import records that look, in hindsight, less like demand milestones and more like policy artefacts. The surge in seaborne copper flowing into the United States throughout 2025 belongs squarely in that second category. To understand why analysts broadly agree that US copper imports are unlikely to beat the 2025 record in 2026, it helps to examine the machinery that created the record in the first place, then assess how thoroughly that machinery has since been dismantled.
When big ASX news breaks, our subscribers know first
What Actually Drove the 2025 US Copper Import Surge?
The 2025 import spike was not the product of accelerating industrial activity or a manufacturing renaissance. It was, in essence, a financial trade executed at scale. As copper tariff fears grew increasingly convincing among market participants, traders and industrial buyers made a calculated decision to pull forward months of future purchasing into the present, locking in tariff-free supply before any policy change could close the window.
The numbers that resulted were extraordinary by any historical standard:
- US seaborne refined copper imports exceeded 100,000 metric tons per month beginning in April 2025
- Year-over-year volumes increased by approximately 158%, adding roughly 343,000 metric tons to baseline figures
- By mid-2025, cumulative US seaborne copper imports had already reached 568,000 metric tons, nearly matching the entire 2024 full-year total of 598,000 metric tons
- The full-year 2025 US copper import figure ultimately reached approximately 1.64 million metric tons, against a 2024 baseline of roughly 900,000 metric tons per US Geological Survey data
- The estimated full-year 2025 import value reached approximately US$25.08 billion
Amplifying this front-loading dynamic was a persistent and financially meaningful gap between COMEX copper prices and the London Metal Exchange global benchmark. This divergence created a textbook arbitrage window: international suppliers could buy copper at LME-linked prices and deliver it into COMEX-registered warehouses at a meaningful premium, generating profit simply from the geography of the trade rather than from any shift in end-use demand.
What made 2025 unique was the combination of policy-driven urgency and a wide, seemingly stable arbitrage spread. Both conditions made the trade appear close to risk-free, drawing in volumes far beyond what any structural demand analysis would have predicted.
As Guy Wolf, Global Head of Market Analytics at Marex, observed at LME Asia Week in Hong Kong, the market always has to assign some probability to tariff implementation, but 2025 presented what felt like an unusually one-sided opportunity. According to Reuters reporting from LME Week, Wolf noted that replicating that same level of material flow into the US would be significantly harder in 2026, precisely because the near-certain, risk-free character of the 2025 trade no longer exists.
The Inventory Overhang: Why the US Market Cannot Simply Absorb More
The most immediate structural barrier to a 2026 repeat is the sheer volume of copper already sitting inside US borders. COMEX-registered warehouse stocks illustrate the scale of the accumulation most starkly.
| Inventory Metric | Value |
|---|---|
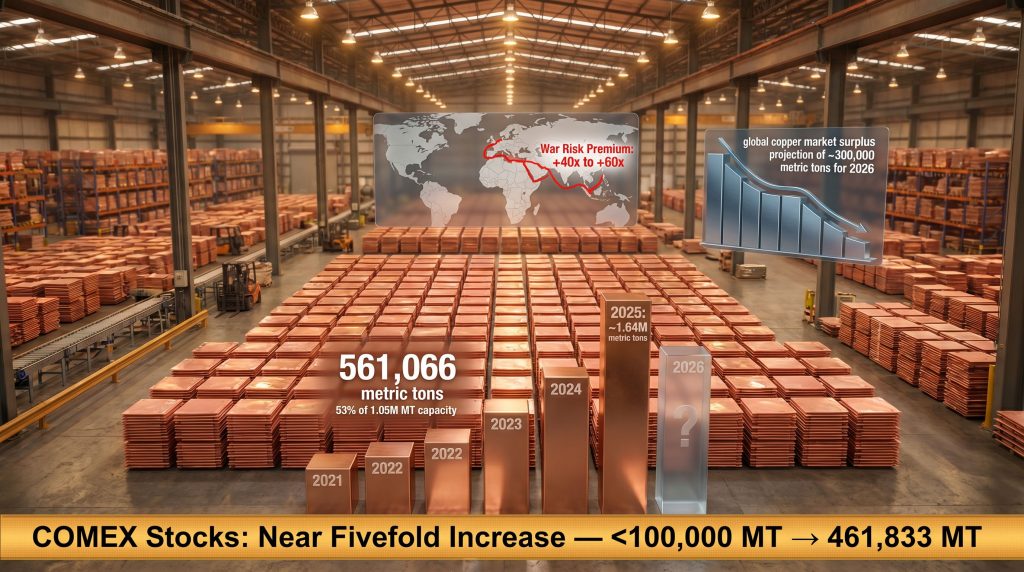
| COMEX copper stocks (mid-2026) | ~561,066 metric tons |
| COMEX total storage capacity | ~1,050,000 metric tons |
| Current capacity utilisation | ~53% |
| Estimated total US inventories (exchange + non-exchange) | ~1,000,000 metric tons |
| COMEX copper stocks at start of 2025 | Under 100,000 metric tons |
| COMEX copper stocks at 2025 peak | 461,833 metric tons |
That progression from below 100,000 metric tons to 561,066 metric tons represents a fivefold-plus increase in COMEX copper stocks over approximately 18 months. Combined with non-exchange holdings held by fabricators, industrial buyers, and traders, total US copper inventories are estimated at approximately 1 million metric tons across all storage categories.
Howard Lau, Director of Asia Materials Research at HSBC, made the structural implication explicit. As reported by Reuters on May 8, 2026, Lau stated that with approximately one million tons already sitting across exchange and non-exchange inventories, a repeat of 2025 import volumes is structurally improbable. Furthermore, the US tariff impact on copper supply has fundamentally reshaped how buyers are approaching forward purchasing decisions.
What makes this inventory particularly difficult to shift quickly is a dynamic analysts describe as "trapped stockpile" behaviour. Copper that entered the US during the tariff-anticipation window cannot easily re-enter global markets without absorbing significant logistical and financial penalties. This effectively converts the accumulated inventory into a domestic supply buffer, satisfying near-term consumption requirements without generating any fresh import orders.
Understanding Inventory Digestion Timelines
When annual US copper consumption runs in the range of 1.5 to 1.8 million metric tons, holding approximately 1 million metric tons in combined inventory suggests the market is carrying somewhere between six and eight months of forward consumption in stockpiles. Historical norms for a well-functioning market typically sit closer to three to four months of inventory cover.
Absorbing the excess at a rate of 100,000 metric tons per quarter would push normalisation timelines well into 2027, which means the inventory ceiling on fresh imports will persist through the remainder of 2026.
There is also a carrying cost dimension that intensifies the pressure to liquidate rather than accumulate further. COMEX warehouse fees, typically ranging from $0.05 to $0.15 per pound per month depending on warehouse location and operator, translate to an annual holding cost of roughly $1,100 to $3,300 per metric ton. On one million metric tons of inventory, the aggregate annual carrying burden falls between $1.1 billion and $3.3 billion, creating a persistent financial incentive to work through existing stocks before placing new import orders.
Geopolitical Cost Shocks: How the Iran War Reshaped Shipping Economics
Even if inventory saturation were less severe, a second structural force has fundamentally altered the economics of copper trade flows into the United States. The outbreak of conflict in the Middle East triggered a dramatic repricing of marine war risk insurance across commercial shipping routes.
Sabrina Qian, Director at shipbroker IFCHOR GALBRAITHS Singapore, provided one of the most striking data points in the entire market debate. As reported by Reuters on May 8, 2026, Qian noted that war risk premiums on shipping escalated by 40 to 60 times within just two weeks of the conflict's onset.
A 40 to 60-times increase in war risk premiums within a fortnight is not an incremental cost shift. It is a structural repricing that can entirely eliminate the margin on a copper arbitrage trade that was already operating on relatively thin spreads.
To understand the practical impact, consider a simplified arbitrage calculation. If the COMEX-LME copper price spread is approximately $200 per metric ton and a war risk premium increase adds $150 to $250 per metric ton in logistics costs to a US-bound shipment, the trade moves from profitable to break-even or loss-making within a single week.
This compression of arbitrage margins operates simultaneously with inventory saturation, creating what analysts describe as a dual-constraint environment. The compounding effect of these two forces — namely oversaturated domestic inventories and elevated shipping costs — is widely interpreted as making it structurally improbable rather than merely unlikely that 2026 import volumes will approach the 2025 record.
Could 2026 Still Produce a Historically Large Import Year?
Despite the structural headwinds, the early 2026 data presents a more complicated picture than the bearish consensus suggests.
US refined copper imports in the first quarter of 2026 exceeded 500,000 metric tons according to Trade Data Monitor data. With approximately 800,000 metric tons imported across just the first four months of the year, a simple annualisation of that pace produces a full-year projection above 2 million metric tons, which would comfortably exceed the 2025 record of 1.64 million metric tons.
Nicholas Snowdon, Head of Metals and Mining Research at Mercuria, represents the bullish end of the analytical spectrum. As reported by Reuters, Snowdon's assessment is that the US is on track to import approximately 1.2 million metric tons more copper in 2026 than it did in the pre-tariff era of 2024, implying full-year imports above 2 million metric tons.
The bearish counterargument, which commands broader support among analysts, rests on several compounding factors:
- Inventory absorption capacity limits how much additional copper the domestic market can physically accommodate before warehouse constraints or carrying costs force a pullback in ordering
- Tariff policy evolution adds uncertainty rather than the certainty that drove 2025 purchasing. On July 30, 2025, the US imposed 50% tariffs on semi-finished copper products and copper-intensive derivatives, while refined copper retained its exemption status. Goldman Sachs analysts have projected a refined copper tariff decision in the first half of 2026, with potential 2027 implementation
- Arbitrage risk repricing means traders must now assign genuine probability weights to multiple tariff outcomes rather than treating pre-tariff purchasing as a near-certain, risk-free opportunity
- Global copper market surplus conditions forecast a 300,000 metric ton surplus in 2026, which reduces the supply-side urgency that might otherwise push buyers to accelerate imports
The scenarios below illustrate the range of plausible 2026 outcomes:
| Scenario | Driver | Implied 2026 Import Volume | Probability Assessment |
|---|---|---|---|
| Base case (normalisation) | Inventory digestion + logistics costs suppress inflows | Below 1.64 million MT | Most probable per analyst consensus |
| Bull case (continued momentum) | COMEX-LME spread widens; Chinese demand recovery tightens global supply | Above 2 million MT | Mercuria's working assumption |
| Tariff shock scenario | Formal refined copper tariff announcement triggers final pre-tariff surge | Sharp near-term spike, followed by 2027 correction | Contingent on tariff timeline |
Disclaimer: Scenario projections involve significant uncertainty and should not be interpreted as investment advice. Commodity market outcomes depend on policy decisions, geopolitical developments, and demand dynamics that are inherently unpredictable.
The China Dimension: A Competing Pull on Global Copper Supply
One factor that could challenge the bearish consensus on US imports is the divergent inventory picture emerging in China. While US copper stockpiles are bloated, Chinese exchange copper inventories have been declining sharply, signalling either strengthening domestic consumption or a tightening of supply within China's industrial ecosystem.
This creates a bifurcated global copper market with competing regional demand signals. US buyers are sitting on excess supply and have limited near-term incentive to import aggressively. In contrast, China demand trends suggest Chinese buyers are drawing down stockpiles and may need to source additional supply from global markets. The question for global price dynamics is which of these two gravitational forces dominates the direction of copper trade flows in the second half of 2026.
Snowdon's view, as reported by Reuters, is that the combined pull from continued US accumulation and recovering Chinese demand has the potential to push the global copper market into a significant supply deficit, which would support copper prices even as US-specific import volumes eventually normalise.
COMEX copper was trading at approximately $5.64 per pound (roughly $12,440 per metric ton) at the time of the original reporting, reflecting the tension between near-term inventory abundance in the US and longer-term tightening concerns in global markets.
The next major ASX story will hit our subscribers first
Key Indicators to Watch Through the Remainder of 2026
For investors and traders tracking US copper import dynamics, the following metrics provide the most direct signals of how the market is evolving:
| Indicator | Current Reading | What to Watch For |
|---|---|---|
| COMEX copper stocks | ~561,066 metric tons | Sustained decline signals inventory digestion beginning |
| COMEX storage utilisation | ~53% | Rising toward 80%+ would signal renewed accumulation |
| Monthly US refined copper import volumes | ~200,000 MT/month pace in Q1 2026 | Whether pace decelerates in Q2-Q3 2026 |
| COMEX-LME copper price spread | Monitor via CME/LME daily publications | Widening above $200/MT would reactivate arbitrage flows |
| War risk shipping premium | 40-60x above pre-conflict baseline | Any easing would reduce logistics barriers to US imports |
| Global copper surplus/deficit balance | ~300,000 MT surplus forecast for 2026 | Shift to deficit would support price and potentially import activity |
| US refined copper tariff status | Under active review; 50% imposed on semi-finished products | Any announcement would immediately reshape import economics |
The single most consequential variable on this list is tariff policy. Refined copper currently retains its exemption from US import tariffs, but this classification remains under active review. Goldman Sachs analysts have projected a formal tariff decision on refined copper in the first half of 2026. Any announcement, whether imposing a new tariff or extending the exemption, would immediately and materially reprice the economics of US-bound copper trade flows.
A Note on the Refining Capacity Constraint
One lesser-discussed dynamic in the US copper market is the growing gap between raw copper availability and domestic refining capacity. The US has limited smelting and refining infrastructure relative to its consumption requirements, meaning that even as domestic copper mining output exists, the country remains structurally dependent on refined copper imports to meet fabricator demand.
This refining bottleneck means that inventory accumulation at the exchange level does not perfectly substitute for all forms of import demand, particularly for specialised grades or forms of refined copper required by specific industrial applications. Understanding this distinction is important context for interpreting COMEX inventory data as a proxy for overall US copper market health.
The 2025 Record in Proper Perspective
The weight of analytical opinion points toward structural normalisation as the most probable trajectory for US copper imports through the remainder of 2026. The conditions that produced the 2025 record — including minimal domestic inventories, a wide and stable COMEX-LME arbitrage spread, low logistics costs, and near-certain tariff anticipation — have all deteriorated materially.
With domestic stockpiles estimated at approximately one million metric tons, COMEX storage more than half consumed, war risk premiums compressing shipping economics, and global copper supply projected to post a 300,000 metric ton surplus, the probability of breaching the 2025 import record is widely assessed as low. However, current copper market trends suggest that the more analytically coherent expectation is a gradual deceleration of import volumes as existing inventory is absorbed, tariff policy evolves toward greater clarity, and the COMEX-LME spread narrows.
The 2025 US copper import record was, at its core, a policy artefact rather than a demand signal. Treating it as a benchmark for structural consumption growth would misread the market entirely. Consequently, the next major inflection point for copper will be determined not by US import volumes but by the interaction between Chinese demand recovery, global supply constraints emerging from years of underinvestment in new mine development, and the ultimate resolution of US tariff policy on refined copper imports.
Furthermore, those evaluating copper investment strategies should weigh the distinction between a structurally driven demand cycle and a policy-induced import surge when positioning for the longer-term outlook. According to Benchmark Mineral Intelligence analysis, the 2025 import volumes were far in excess of actual consumption, further reinforcing the view that the record reflects stockpiling behaviour rather than genuine demand growth.
This article is intended for informational purposes only and does not constitute financial or investment advice. Commodity market projections and analyst forecasts involve material uncertainty and may not reflect actual future outcomes.
Want to Position Ahead of the Next Major Copper Discovery?
Discovery Alert's proprietary Discovery IQ model delivers real-time alerts the moment significant mineral discoveries hit the ASX, transforming complex commodity data into actionable insights for both traders and long-term investors — begin your 14-day free trial today and see why historic discoveries have generated extraordinary returns for those who acted early.