
August 4, 2026
The Hidden Cost of Redirected Metal: How Commodity Arbitrage Creates Scarcity Without Shortage
There is a peculiar feature of physical commodity markets that often escapes casual observers: total global supply can appear abundant on paper while specific regions experience genuine, acute scarcity on the ground. This paradox is not theoretical. It plays out whenever a powerful price incentive causes large volumes of inventory to migrate from one geography to another, stripping one market of its physical buffer while simultaneously flooding another with excess metal. Understanding this mechanism is essential context for interpreting what has unfolded in the copper market through mid-2026, where US copper imports tighten supply outside the US in ways that are reshaping pricing dynamics across every major exchange simultaneously.
When big ASX news breaks, our subscribers know first
What a Single Month of Copper Imports Reveals About the Entire Global Market
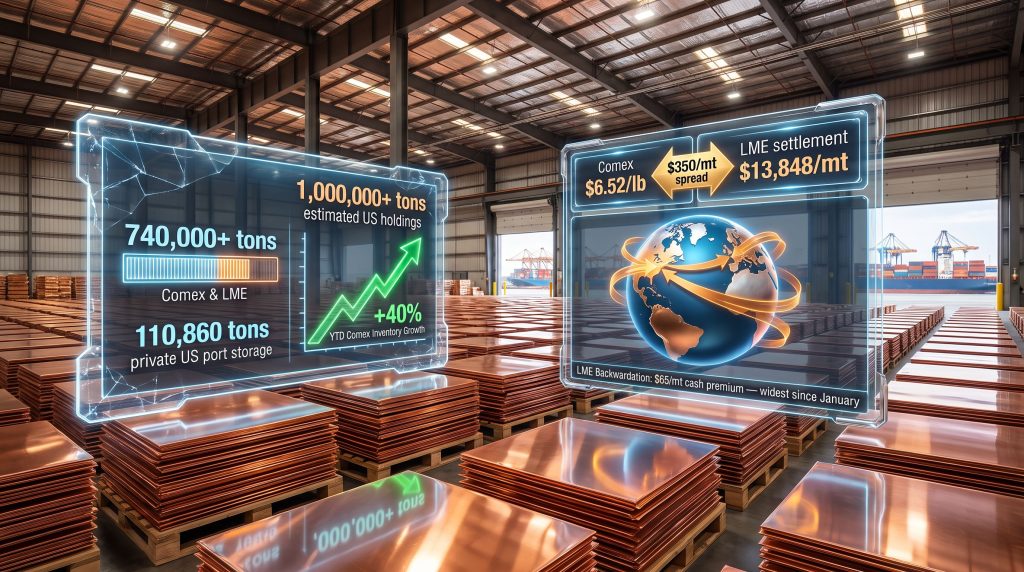
The scale of July's US refined copper import activity was exceptional by any historical measure. Monthly volumes exceeded 200,000 metric tons, the highest single-month figure recorded in IHS Markit shipping data since 2014. To contextualise that number: it is not simply a large import figure. It represents a structural reallocation of physical inventory away from LME-registered warehouses in Europe and Asia toward Comex-registered storage and private US port facilities. According to record US copper import data, these volumes are far in excess of domestic consumption, underscoring the extent of arbitrage-driven accumulation.
The cumulative effect of this reallocation becomes clear when inventory data across all categories is aggregated:
| Inventory Category | Volume (Metric Tons) |
|---|---|
| Combined Comex + LME Warehouses | 740,000+ |
| Private US Port Storage | 110,860 |
| Estimated Total US Copper Holdings | 1,000,000+ |
| Comex YTD Inventory Growth | +40%+ |
A critical and underappreciated detail here is the 110,860 tons sitting in private US port storage, which falls entirely outside official exchange reporting. This inventory is invisible to most market participants who rely solely on published Comex or LME warehouse data, yet it represents a substantial volume that has been effectively removed from the globally tradeable copper pool.
The practical consequence is that LME warehouse stocks outside the US fell to their lowest levels in nearly two years as the import surge accelerated, creating conditions where European and Asian buyers encountered genuine physical scarcity despite the apparent abundance of global inventory totals. Furthermore, the global copper supply gap continues to widen as this redistribution effect compounds over successive months of elevated US import volumes.
The Arbitrage Mechanics Driving Copper Away from Overseas Markets
The engine behind this redistribution is a price differential known as the Comex-LME spread. When this spread exceeds the combined cost of freight, insurance, and logistics for transporting copper from overseas warehouses to US ports, a profitable trade emerges that large-scale operators can exploit repeatedly until the spread narrows. In July, this spread averaged more than $350 per metric ton, a level that comfortably cleared all transport costs and created a persistent financial incentive to move metal.
Copper itself traded at $6.52 per pound, approximately 47% above year-ago price levels and within close range of the June record high of $6.67/lb. LME copper settled at $13,848/mt, while the SHFE 2609 contract closed at 106,190 yuan/mt. These headline price figures tell only part of the story. The more revealing signal comes from the structure of forward curves.
Backwardation in a commodity futures market occurs when the spot price exceeds the forward price. This structure signals that buyers are willing to pay a premium for immediate physical delivery over future delivery, directly reflecting near-term supply scarcity in the physical market.
The LME cash contract traded at a $65/mt premium to the three-month forward contract, the widest backwardation observed since January. Simultaneously, the spot premium for Grade 1 copper cathode in Shanghai rose to 280 yuan/mt above the SHFE 2608 contract, gaining 20 yuan/mt in a single trading session. When backwardation widens across both LME and SHFE at the same time, it confirms that physical tightness is not isolated to a single exchange or region but reflects a broader, coordinated supply strain in markets outside the US.
Why Tariff Uncertainty Functions as a Self-Reinforcing Import Driver
Trade policy has provided the additional accelerant for this arbitrage activity. Existing 50% tariffs already apply to semi-finished copper products and derivatives. A June 30 deadline for Commerce Secretary Howard Lutnick to recommend a refined copper tariff structure passed without a formal announcement. Separately, a study into phased tariffs beginning at 15% in January 2027 was directed, though no final decision has been reached. The White House's formal copper tariff directive outlines the policy framework currently under consideration.
The absence of clarity does not reduce import momentum. It extends the window during which importing pre-tariff refined copper remains advantageous. StoneX Financial's head of metals, Michael Cuoco, has observed that traders continue accelerating copper shipments into the US because locking in metal ahead of any potential tariff is more economically rational than waiting for policy certainty. Each week without an announcement extends the profitable window and sustains the arbitrage-driven trade diversion.
| Tariff Policy Milestone | Status |
|---|---|
| 50% tariff on semi-finished copper products | Active |
| June 30 Lutnick recommendation deadline | Passed without announcement |
| Proposed phased tariff on refined copper (15%) | Targeted January 2027 start |
| Final presidential tariff decision | Pending |
This dynamic creates a self-reinforcing loop: uncertainty drives imports, imports reduce overseas exchange inventory, reduced inventory tightens LME backwardation, and tighter backwardation validates the urgency of continued accumulation. The tariff-driven copper rally has consequently become one of the most significant structural forces reshaping global copper flows in recent memory.
The Demand Equation: AI Infrastructure and the Structural Case for Copper Deficits
While tariff mechanics explain the near-term distribution of copper inventories, the medium-term price outlook rests on a more fundamental question: whether global refined copper supply will be adequate to meet growing demand through 2026 and beyond. In this context, understanding the copper supply crunch already developing at the structural level is critical for forming a coherent market view.
Institutional forecasts diverge sharply on this question:
| Institution | 2026 Copper Market Forecast |
|---|---|
| J.P. Morgan | 330,000-ton refined deficit |
| ICSG | 150,000-ton refined deficit |
| Goldman Sachs | Near-term surplus |
The gap between these projections is one of the widest seen in recent copper market history. Both J.P. Morgan and the International Copper Study Group (ICSG) embed approximately 475,000 metric tons of AI data centre copper consumption into their 2026 forecasts. This figure reflects the substantial copper intensity of modern AI infrastructure: power distribution cabling, liquid cooling systems, server interconnects, high-voltage grid connection upgrades, and transformer installations all require significant volumes of refined copper.
What makes this demand assumption particularly sensitive is its concentration in a single sector. Unlike consumer electronics or automotive demand, which are distributed across millions of purchasing decisions, AI data centre copper consumption is concentrated among a relatively small number of hyperscale technology companies and their construction contractors. A deferral of 18 to 24 months in build schedules would materially weaken the demand assumptions underpinning both deficit forecasts, bringing Goldman Sachs' surplus scenario back into play.
The SHFE Import Margin: A Gauge of Chinese Restocking Capacity
One indicator that receives less attention than LME or Comex pricing is the Shanghai Futures Exchange import margin, which measures whether it is economically viable for Chinese buyers to import refined copper at prevailing exchange rates and price levels. Shanghai Metals Market (SMM) data showed the SHFE import margin sitting at negative 730 to 840 yuan/mt, meaning imported copper was uneconomic for Chinese buyers without the specific benefit of the Comex-LME arbitrage.
This negative margin constrains Chinese downstream restocking activity and limits the extent to which Chinese physical demand can compete with US buyers for available global supply. A recovery in SHFE import margins above breakeven would signal that Chinese industrial buyers are returning as a competing force for physical copper, which would amplify the supply tightness already visible in LME warehouse data.
How Different Market Participants Experience the Same Price Environment Differently
The consequences of elevated copper prices and redirected trade flows are not uniform across the market. Three distinct participant segments experience the current environment in fundamentally different ways:
Primary copper miners with LME-linked offtake agreements sit in the most advantageous position. Every $200/mt increase in LME copper translates directly into higher per-tonne revenue and improved EBITDA margins, with the benefit flowing immediately through to earnings given that most mining operating costs are relatively fixed in the short term.
US-based copper fabricators and manufacturers face the inverse dynamic. Their raw material costs are priced against Comex, which currently carries a substantial premium above LME due to the arbitrage-driven import surge. Unless end-product pricing can be adjusted to reflect higher input costs, fabricator margins compress. This creates a structural cost disadvantage relative to overseas competitors who purchase copper closer to LME benchmark levels.
Chinese manufacturers and downstream consumers are constrained by the negative SHFE import margin, which effectively prices them out of the imported copper market under current conditions. Domestic Chinese copper supply remains their primary avenue for restocking, limiting their ability to participate in global physical markets at current price levels.
For individual investors, the operational complexity and capital intensity of physical copper accumulation at scale makes direct participation in the arbitrage trade inaccessible. However, copper investment strategies that focus on physically backed copper ETFs provide practical exposure to higher copper prices without requiring the logistics infrastructure, bonded warehouse access, or balance sheet capacity needed to hold physical inventory through a tariff decision without facing margin calls.
Price Levels That Define the Bull and Bear Cases Through 2026
Rather than speculating on tariff timing, a more analytically durable framework focuses on specific price thresholds that will either validate or invalidate the competing institutional forecasts. In addition, monitoring the copper price growth drivers underpinning each scenario helps investors assess which institutional view is gaining empirical support as data evolves.
| Price Signal | Level | Market Interpretation |
|---|---|---|
| LME Bull Confirmation | Above $14,000/mt | Deficit materialising; supports miner equity gains of 12-18% |
| LME Bear Warning | Below $12,500/mt (10 sessions) | AI demand deferral; risk of 15-20% decline in miners and ETFs |
| LME Backwardation Bull | Above $80/mt cash premium | Physical tightness intensifying outside the US |
| LME Backwardation Bear | Below $30/mt for 10 sessions | Ex-US supply pressures easing; arbitrage trade unwinding |
| SHFE Bull Target | Above 108,000 yuan/mt | Chinese restocking supporting global copper demand recovery |
Goldman Sachs has identified $12,500/mt as a critical price floor, having been tested during the June sell-off. Ten consecutive LME settlements below this level would provide strong evidence that AI data centre copper demand is being deferred, weakening the deficit thesis and introducing meaningful downside risk for copper mining equities and physically backed ETFs in the range of 15% to 20%.
Sustained trading above $14,000/mt, combined with evidence that J.P. Morgan's projected 330,000-ton deficit is beginning to manifest in physical market data, would support copper mining equity gains in the 12% to 18% range. The LME cash-to-three-month backwardation spread serves as the most real-time available gauge of whether US copper imports tighten supply outside the US in a manner that persists or reverses.
The next major ASX story will hit our subscribers first
Scenario Analysis: Two Pathways for Global Copper Supply Through 2026
Bull Case: Physical Scarcity Deepens and Deficit Forecasts Prove Accurate
- Chinese downstream restocking recovers as SHFE import margins improve, pushing the 2609 contract above 108,000 yuan/mt through Q4 2026
- LME copper sustains levels above $14,000/mt as the J.P. Morgan 330,000-ton deficit begins reducing physical inventory buffers
- LME backwardation widens beyond $80/mt, confirming that ex-US physical supply cannot adequately meet spot demand
- AI data centre construction timelines remain on schedule, validating the 475,000-ton demand assumption embedded in deficit forecasts
- Outcome: Copper mining equities appreciate 12% to 18%; physically backed copper ETFs track LME price gains
Bear Case: AI Demand Deferred and Arbitrage Trade Reverses
- LME copper closes below $12,500/mt for ten consecutive sessions, signalling that AI infrastructure investment is being delayed by 18 to 24 months
- The Comex-LME spread narrows below $200/mt, removing the financial incentive for continued arbitrage-driven imports
- LME warehouse stocks outside the US begin recovering as import volumes slow, easing the artificial tightness in ex-US physical markets
- Goldman Sachs' surplus forecast proves accurate as demand growth fails to absorb available refined copper supply
- Outcome: Copper miners and physically backed ETFs decline 15% to 20%; the deficit narrative loses institutional support
Key Takeaways for Copper Market Participants
The redirection of over 200,000 metric tons of refined copper into US warehouses in a single month has created measurable physical scarcity across European and other ex-US markets, even as total global inventory figures appear elevated. The mechanisms driving this outcome, including the Comex-LME spread, tariff policy uncertainty, and bonded warehouse dynamics, are well understood by large institutional operators but remain opaque to most market participants.
Several key points deserve attention as the situation develops through 2026:
- LME backwardation at its widest level since January and falling LME warehouse stocks confirm that the supply tightening outside the US is a real physical phenomenon, not a statistical artefact
- The tariff policy timeline remains unresolved, but the more durable analytical framework centres on whether J.P. Morgan's 330,000-ton deficit or Goldman Sachs' surplus forecast ultimately reflects physical market reality
- The $14,000/mt and $12,500/mt LME thresholds provide the most actionable signals for assessing whether ex-US physical tightness will persist or reverse
- The negative SHFE import margin remains a key constraint on Chinese restocking and will need to recover before Chinese demand can function as a meaningful counterweight to US import accumulation
- Market participants without access to private port inventory data or institutional logistics infrastructure are better positioned through LME-linked mining equities or physically backed copper ETFs than through direct physical accumulation
Consequently, recognising how US copper imports tighten supply outside the US is no longer merely an academic observation — it has become a central operational consideration for copper buyers, sellers, and investors across every major market.
This article contains forward-looking analysis and price scenario projections based on publicly available institutional research. These scenarios involve forecasts and assumptions that may not materialise. Readers should conduct their own due diligence and seek independent financial advice before making investment decisions based on commodity price projections.
For broader context on copper market dynamics, supply-demand forecasting frameworks, and commodity investment analysis, Crux Investor's Analyst's Notes series at cruxinvestor.com provides independent institutional-grade perspectives on how physical market conditions translate into equity and ETF outcomes.
Want to Stay Ahead of the Next Major Copper Discovery on the ASX?
Discovery Alert's proprietary Discovery IQ model delivers real-time notifications the moment significant mineral discoveries — including copper — are announced on the ASX, transforming complex market data into actionable investment insights before the broader market reacts. Explore how historic discoveries have generated substantial returns on Discovery Alert's dedicated discoveries page, and begin your 14-day free trial today to position yourself ahead of the next major move in copper and beyond.