
June 11, 2026
The Hidden Cost of Shrinking Oil Buffers: What Inventory Cycles Reveal About Energy Market Fragility
Most investors track crude oil prices as a headline number. Far fewer pay attention to the inventory dynamics that quietly determine how vulnerable those prices are to sudden supply shocks. Understanding the mechanics of crude storage cycles, and what happens when those buffers run thin, is central to the broader discussion of US crude draws and Middle East oil supply risks. It also offers a more rigorous framework for anticipating energy market behaviour than watching benchmark prices alone.
When US crude inventories decline for eight consecutive weeks, the market is not simply registering tighter supply. It is systematically losing the cushion that prevents price spikes from becoming structural price shifts. That distinction matters enormously for anyone with exposure to energy costs, including mining operators whose margin assumptions were built on a different oil price reality.
When big ASX news breaks, our subscribers know first
What Eight Consecutive US Crude Draws Actually Signal
Defining the Draw and Its Compounding Effect
A crude inventory draw occurs when domestic oil stockpiles decline on a week-over-week basis, indicating that consumption and export demand are absorbing crude faster than domestic production and imports can replenish it. In isolation, a single draw is unremarkable and occurs regularly across seasonal demand cycles. What makes the current situation structurally significant is the sustained nature of the depletion.
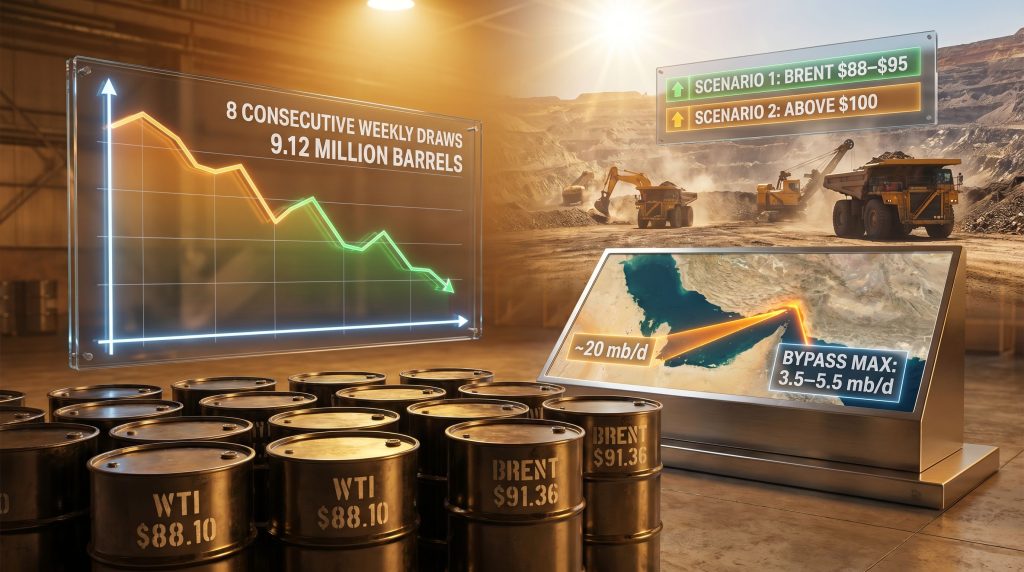
The US Energy Information Administration confirmed that crude inventories fell by 9.12 million barrels for the week ending June 5, 2026, representing the eighth consecutive weekly drawdown and the largest single-week decline within that streak. The preceding week recorded a draw of 6.7 million barrels, confirming an accelerating rather than plateauing trend. Gasoline inventories declined a further 1.19 million barrels during the same reporting period, providing demand-side confirmation that consumption strength, not supply reduction alone, is driving the drawdown.
| Metric | Reported Figure | Market Significance |
|---|---|---|
| Weekly draw (week ended June 5) | 9.12 million barrels | Largest single draw in the streak |
| Prior week draw | 6.7 million barrels | Confirmed accelerating trend |
| Alternative estimate (same week) | 7.228 million barrels | Directional consensus across sources |
| Gasoline inventory change | -1.19 million barrels | Demand-side confirmation |
| Consecutive weekly draws | 8 | Longest sustained streak in recent cycle |
Why the Buffer Concept Is Central to Price Stability
A concept underappreciated by retail investors is what market analysts call inventory elasticity, which describes the relationship between stock levels and price sensitivity to supply disruption. When inventory buffers sit at elevated levels, geopolitical shocks and supply outages can be absorbed through the temporary release of commercial stocks without triggering lasting price moves. As those buffers thin, the market's capacity for self-correction diminishes rapidly, and the price response to any given supply event becomes disproportionately larger.
Eight consecutive draws have eroded the US market's ability to absorb further disruption at current benchmark prices. LSEG oil analyst Emril Jamil noted that the combination of declining inventories and persistent geopolitical tensions continues to provide structural support for oil prices, with the risk balance skewed to the upside through the seasonally stronger third-quarter demand period. Furthermore, this is not a transient risk premium — it represents a structural repricing of the market's vulnerability to new shocks. Tracking crude oil price trends through this period reveals how quickly the repricing has accelerated.
The smaller the inventory cushion, the more sensitive prices become to any incremental supply disruption. Eight consecutive draws have materially lowered the threshold at which future events could trigger substantial price spikes.
Seasonal context amplifies this concern. The current draw streak is occurring during May and June, a period when US inventories historically build in preparation for peak summer driving demand. A drawdown pattern during a seasonally supportive period for stock accumulation is a particularly anomalous signal, and one that suggests underlying demand or export absorption is running well ahead of historical norms for this time of year.
How the Strait of Hormuz Converts Geopolitical Risk Into a Physical Supply Problem
The Arithmetic of a Chokepoint
The Strait of Hormuz is not merely a geopolitical flashpoint. It is the physical bottleneck through which approximately 20 million barrels per day of globally traded crude oil moved before the current conflict period, representing roughly one-fifth of all oil consumed worldwide. No other maritime passage comes close in terms of volume concentration, which means any sustained restriction does not function as a regional disruption but as a systemic supply event with global pricing consequences. The IEA's analysis of Middle East energy markets reinforces just how structurally irreplaceable this chokepoint remains.
The bypass arithmetic is stark:
| Export Route | Capacity (mb/d) | Current Status |
|---|---|---|
| Strait of Hormuz (pre-conflict) | ~20 | Restricted by Iran |
| Saudi Arabia East-West Pipeline | ~2.0-2.5 | Operational, near capacity |
| UAE Fujairah Terminal | ~1.5-3.0 | Operational, near capacity |
| Combined bypass maximum | 3.5-5.5 | Insufficient to offset Hormuz |
| UAE West-East Pipeline (planned) | TBC | Online 2027 at earliest |
| Implied supply gap | ~14.5 | No solution identified before 2027 |
The UAE's planned West-East pipeline represents the only identified infrastructure capable of meaningfully expanding bypass capacity, but it is not scheduled to reach operational status until 2027. Consequently, this creates a structural supply gap that cannot be resolved through infrastructure investment within the current conflict timeline, regardless of how ceasefire negotiations evolve.
The Escalation Ladder and Its Current Position
Commodity markets make an important distinction between a geopolitical risk premium, which is priced on the probability of supply disruption, and a physical disruption premium, which is priced on actual supply removal from the market. The current environment has blended both, which is why benchmark prices have remained elevated even during sessions where the immediate escalation news was limited. The broader oil market impacts of this blended premium are now feeding into supply chain costs across multiple sectors.
The sequence of events shaping the current premium includes:
- US military strikes on Iranian targets following the downing of a US Apache attack helicopter, an incident President Trump had committed publicly to responding to
- Iranian retaliatory strikes against a US base in Jordan and 21 Gulf targets, demonstrating Tehran's willingness to escalate beyond rhetoric
- Hormuz restriction policy maintained by Tehran, with most commercial shipping continuing to face delays or interdiction
- Ceasefire deadlock driven by Iran's insistence on conditions that Israel has declined to accept, leaving negotiations stalled ahead of Q3
- Hezbollah trigger risk, with Tehran threatening full resumption of hostilities if Israel acts against Hezbollah, a threshold Israel has shown no willingness to accept
Commonwealth Bank of Australia economist Harry Ottley had assessed the conflict as trending toward de-escalation, but that analysis preceded the additional US airstrikes and Iran's subsequent retaliatory strikes on Gulf targets, materially changing the escalation trajectory. This divergence between analyst expectations and actual events illustrates a common pattern in geopolitical risk assessment: de-escalation assumptions tend to be revised more slowly than the underlying situation deteriorates.
Where Oil Prices Stand and What the Scenarios Look Like Through Q3
The Muted Price Reaction as a Structural Signal
Brent crude fell just $0.09 to $91.36 per barrel and WTI declined $0.10 to $88.10 per barrel on June 10, 2026, following confirmed US airstrikes on Iranian targets. The near-zero single-session reaction to what would historically have been a major escalation event carries a specific interpretation: markets are no longer treating each military exchange as a discrete risk event. Instead, the conflict has been reclassified as a persistent background condition, and the current price level already embeds a sustained geopolitical premium.
The US Dollar Index (DXY) stood at 99.95 on the same date, a level that introduces compounding pressure for non-US energy consumers. Dollar strength erodes the exchange-rate benefit that would otherwise partially offset higher fuel costs for operators working outside the United States.
Three Price Pathways Through Q3 2026
ING commodity strategists have indicated that ongoing Middle East supply disruptions provide continued support for oil prices if they persist into the third quarter, when seasonal demand is typically at its strongest. Three distinct scenarios emerge from the current configuration:
Scenario 1: Contained Conflict (Base Case)
- Military exchanges between the US and Iran remain limited in scope
- Hormuz traffic gradually improves without a formal ceasefire
- No confirmed strikes on Saudi or UAE pipeline infrastructure
- Brent holds in an $88-$95/barrel range through Q3 2026
- Mining companies face elevated but manageable fuel costs if hedge coverage was secured before the conflict began
Scenario 2: Infrastructure Strike Escalation (Adverse Case)
- Iran targets Saudi or UAE pipeline assets, including infrastructure previously struck in April
- Export capacity is materially reduced beyond current restrictions
- Brent moves above $100/barrel within approximately 10 trading days of a confirmed major infrastructure strike
- Diesel costs increase 10-14% for unhedged mining operations relative to current cost guidance
Scenario 3: Ceasefire and Hormuz Reopening (Bull Case for Miners)
- A confirmed US-Iran ceasefire leads to unrestricted Hormuz reopening
- Downward price pressure emerges within two to three weeks of confirmed reopening
- WTI could fall below $85/barrel if the ceasefire holds and demand does not fully absorb the returning supply
- Unhedged mining operators benefit most from this outcome as diesel costs retreat toward pre-conflict budget assumptions
Why Mining Companies Are Disproportionately Exposed to Sustained High Oil
Diesel as the Primary Variable Cost in Open-Pit Operations
For large open-pit mining operations, particularly gold and copper producers, diesel fuel is the dominant variable cost after labour. The relationship is direct and unavoidable: haul trucks, excavators, drilling equipment, and ancillary fleet all run on diesel, and at scale the consumption volumes are enormous. When WTI remains above $85/barrel, the fuel cost structure embedded in most 2026 operating budgets — typically set before the current conflict environment — is materially exceeded. Understanding the full scope of commodity price impacts on mining operations requires accounting for this diesel exposure as a primary variable.
| Operation Type | Diesel as % of AISC | Exposure Level |
|---|---|---|
| Large open-pit gold (unhedged) | 15-25% | High |
| Large open-pit copper (unhedged) | 15-22% | High |
| Underground operations | 8-14% | Moderate |
| Hedged producers (Q3 coverage at or below current Brent) | Variable | Managed |
AISC = All-In Sustaining Cost
Geographic Exposure: Where the Cost Pressure Concentrates
Not all mining jurisdictions carry equal fuel cost exposure. Operations in West Africa and Southeast Asia face compounding disadvantages that make them particularly sensitive to global crude price movements:
- Dollar-denominated diesel pricing: Fuel procurement in these regions is priced against global crude benchmarks with no local buffer or domestic production discount
- Absence of state subsidies or local supply alternatives: Unlike some domestic markets where governments partially insulate industrial users from price volatility, these jurisdictions typically offer no comparable protection
- Limited hedging infrastructure: Smaller operators in frontier markets often lack access to the derivative instruments available to larger producers, leaving them structurally unhedged by default
Japan's wholesale price index reaching a three-year high of 6.3% in May provides a useful proxy for understanding how elevated energy costs transmit into broader industrial cost structures. The same dynamic applies directly to mining operations purchasing dollar-priced diesel from international markets, where the global crude price feeds through to operational costs without meaningful filtration.
The Hedge Coverage Decision Framework
The factor that separates margin-resilient producers from margin-pressured operators in the current environment is not simply the oil price — it is whether management secured forward fuel hedges before the conflict elevated prices to current levels. The assessment framework is relatively straightforward:
-
Hedged at or below current Brent for Q3 delivery: Cost certainty maintained even if oil rises above $100/barrel. This producer can execute Q3 plans with confidence regardless of how the conflict evolves.
-
Unhedged but able to defer discretionary development activity: Partial mitigation is available through delaying non-essential capital work, though this introduces mine life risk that must be weighed against the near-term cost saving.
-
Unhedged and unable to defer Q3 pre-stripping or major development drilling: Full margin impact of higher fuel costs with no mitigation lever. Reducing activity could shorten mine life or breach production covenants embedded in project finance agreements, creating a forced-execution scenario at elevated cost.
For unhedged open-pit operators that cannot defer essential mine development activity, sustained WTI above $85/barrel translates directly into compressed operating margins with no available offset mechanism.
How US Macroeconomic Data Could Amplify the Pressure
The CPI to Dollar to Mining Cost Transmission Chain
US May CPI data released on June 11, 2026, introduces a secondary amplification risk that operates independently of the oil price itself. The transmission mechanism works through a chain of connected market responses:
- An above-consensus CPI print raises the probability of additional Federal Reserve rate increases
- Higher Fed rate expectations attract capital inflows that strengthen the US dollar
- A stronger dollar (DXY currently at 99.95) reduces the exchange-rate benefit that non-US mining operators rely on to partially offset higher USD-denominated fuel costs
- The combined effect is higher fuel costs in dollar terms and a reduced local-currency offset, creating a dual cost headwind that operates beyond the oil price alone
For non-US mining operators reporting in local currencies, this transmission mechanism means that US monetary policy decisions can materially affect operating margins through the dollar channel even when the operator has limited direct exposure to US markets. Furthermore, an above-consensus CPI reading on June 11 would therefore carry negative implications for energy-intensive producers in Australia, Canada, and emerging-market mining jurisdictions simultaneously. This market volatility across multiple asset classes reflects how interconnected these macroeconomic pressures have become.
Reading the EIA Data as a Forward Signal
The EIA's global oil outlook provides crucial context for interpreting weekly petroleum status reports. The EIA Weekly Petroleum Status Report itself remains the most direct near-term indicator of whether the inventory tightening cycle is continuing or beginning to reverse. Investors monitoring the oil-mining cost nexus should watch for three distinct outcomes:
| EIA Outcome | Signal Interpretation | Likely Price Impact |
|---|---|---|
| Draw of 7+ million barrels (ninth consecutive) | Inventories continue tightening | Supports WTI above $85/barrel through Q3 |
| Build of 3+ million barrels for two consecutive weeks | Demand weakening or supply returning | Reduces structural price support |
| Draw between 3-7 million barrels | Neutral to mixed | Range-bound price action likely |
A ninth consecutive draw above 7 million barrels would confirm that the structural tightening is ongoing and that the market's vulnerability to US crude draws and Middle East oil supply risks remains elevated heading into the peak summer demand period.
The next major ASX story will hit our subscribers first
A Monitoring Framework for Investors Navigating This Environment
Supply-Side and Geopolitical Indicators
Investors seeking to track how US crude draws and Middle East oil supply risks evolve through Q3 2026 should focus on a layered set of indicators across three distinct categories. In addition, the broader mining commodity outlook for copper and uranium provides useful context for how energy cost pressures are intersecting with demand-side dynamics across the sector.
Supply and inventory signals:
- EIA Weekly Petroleum Status Report (weekly draw or build magnitude and direction)
- Hormuz commercial traffic data through vessel tracking services
- Saudi and UAE pipeline utilisation rates relative to stated capacity
- Any confirmed strikes on Gulf energy infrastructure, particularly pipeline assets
Geopolitical escalation signals:
- US-Iran ceasefire negotiation status and changes in preconditions from either party
- Israel-Hezbollah activity and Iranian response posture, given Tehran's stated trigger threshold
- US military operational tempo in the region as an indicator of escalation or de-escalation
Mining sector-specific signals:
- Q3 hedge coverage disclosures from energy-intensive gold and copper producers
- AISC guidance revisions that cite changes in fuel cost assumptions
- Capital expenditure deferral announcements from unhedged operators facing margin compression
- Local currency movements against the US dollar for West African and Southeast Asian producers
The current configuration of eight consecutive US crude draws combined with structurally impaired Hormuz bypass capacity creates a market environment where the default risk direction is higher oil prices rather than lower. However, without a confirmed ceasefire and Hormuz reopening, the conditions that have kept WTI above $85/barrel through the first half of 2026 remain firmly in place for the third quarter and potentially beyond.
Mining investors in particular should prioritise understanding which operators in their portfolios are carrying unhedged fuel exposure into Q3 before adding to positions in energy-intensive producers. The difference between a hedged and unhedged operator at current oil prices is not a marginal cost variation. At diesel's share of 15-25% of all-in sustaining costs, it is the difference between margin stability and meaningful earnings compression during a period when the oil price outlook offers limited near-term relief.
This article is intended for informational purposes only and does not constitute financial advice. Oil price scenarios, mining cost projections, and geopolitical risk assessments involve forward-looking assumptions that may not reflect actual outcomes. Readers should conduct independent research and consult qualified financial advisors before making investment decisions. Historical data and scenario analysis are provided for context and do not guarantee future results.
Want To Stay Ahead of the Next Major ASX Mineral Discovery?
While energy cost pressures and inventory cycles reshape mining margins, Discovery Alert's proprietary Discovery IQ model scans ASX announcements in real time, delivering instant alerts on significant mineral discoveries so subscribers can identify actionable opportunities before the broader market reacts — explore historic discovery returns or start your 14-day free trial today.