August 21, 2026
When Official Numbers Diverge From Reality: The Hormuz Energy Flow Crisis Explained
Energy markets have always operated on the principle that price discovery depends on reliable data. When the information ecosystem fractures, whether through measurement limitations, geographic misclassification, or deliberate communication strategy, the consequences ripple across every node of the global supply chain. The Strait of Hormuz is not simply a chokepoint for crude oil. It is a data battleground where US high-balling Hormuz energy flows has become one of the most consequential information disputes in recent market history.
When big ASX news breaks, our subscribers know first
Why the US Is High-Balling Hormuz Energy Flows: The Data Discrepancy in Full
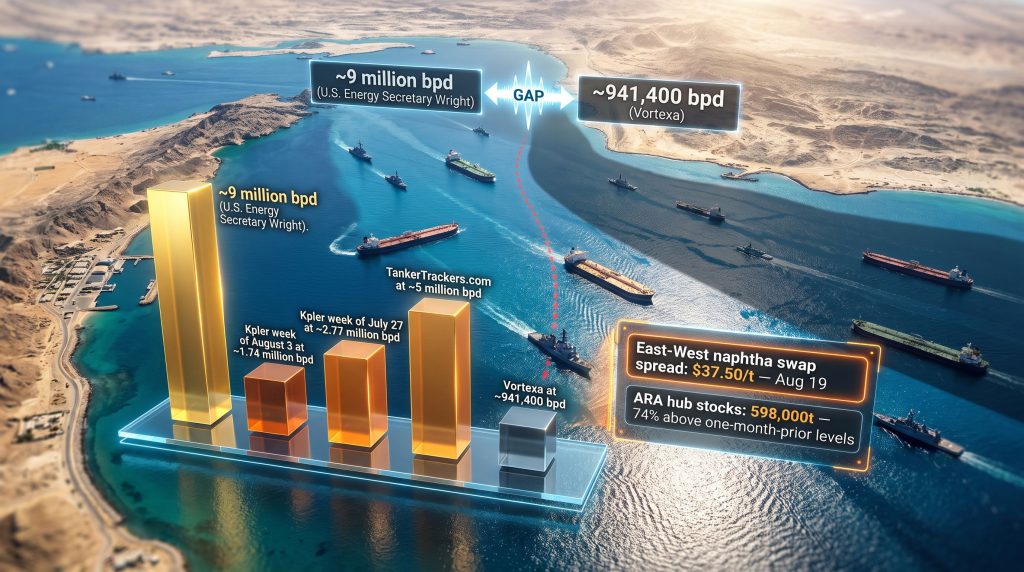
The phrase US high-balling Hormuz energy flows has become shorthand for a serious divergence between official claims and observable evidence. U.S. Energy Secretary Chris Wright claimed an average of approximately 9 million barrels per day (bpd) had exited the strait over a seven-day period. U.S. Treasury Secretary Scott Bessent publicly asserted meaningful control over the strait and suggested large energy volumes were continuing to move. However, independent vessel tracking and satellite monitoring firms have produced data that tells a materially different story.
| Data Source | Reported Hormuz Flow Volume | Methodology |
|---|---|---|
| U.S. Energy Secretary (Wright) | ~9 million bpd (7-day avg.) | Official government briefing |
| U.S. Treasury Secretary (Bessent) | Broad claim of large volumes and control | CNBC interview statement |
| TankerTrackers.com (Aug 20) | ~5 million bpd departing US Navy blockade line | Vessel tracking + satellite |
| Vortexa (Aug 14–21 period) | ~941,400 bpd through the strait itself | AIS + satellite vessel tracking |
| Kpler (week of Aug 3) | ~1.74 million bpd crude exports through Hormuz | Vessel-flow tracking data |
| Kpler (week of July 27) | ~2.77 million bpd | Vessel-flow tracking data |
The divergence between the highest official figure and the lowest independent estimate represents a gap of more than 9x in observable crude transit volumes through the strait itself. Furthermore, even the TankerTrackers.com figure of approximately 5 million bpd, which encompasses all departures from the broader U.S. Navy blockade perimeter including eastern UAE and Omani ports, falls well short of the official narrative.
Understanding why this gap exists requires unpacking a critical geographic distinction that has been largely absent from public discourse. The crude oil trade geopolitics surrounding this region add another layer of complexity to an already fraught situation.
The Geography Problem: Strait Transits vs. Gulf Region Departures
Much of the confusion surrounding Hormuz flow reporting stems from the failure to differentiate between two fundamentally different measurements. Volumes departing the broader Gulf region, including eastern UAE ports such as Fujairah and Omani facilities at Sohar, Muscat, and Duqm, are not the same as volumes physically transiting the Strait of Hormuz itself.
Vortexa data for the period of August 14 to 21 illustrates this clearly:
- Fujairah port exports averaged approximately 2.06 million bpd
- Sohar and Muscat, Oman, contributed a combined ~1.15 million bpd during the same window
- Strait of Hormuz transits themselves accounted for approximately 941,400 bpd
- Total observable Gulf departures across all exit points were estimated at roughly 4 million bpd
The U.S. Navy's blockade on Iranian ports is being enforced from a position outside the strait, between the Gulf of Oman and the Arabian Sea. Consequently, TankerTrackers.com's figure of approximately 5 million bpd departing the blockade line almost certainly captures loadings at UAE and Omani eastern ports that are geographically distinct from strait transits.
When official statements aggregate all of these flows under the umbrella of Hormuz movements without geographic precision, the resulting headline figure inflates the apparent success of the naval operation considerably.
This geographic conflation is not a minor technicality. For energy buyers in Asia and Europe who are trying to assess near-term supply reliability and price forward contracts, the difference between volumes transiting the strait and volumes departing adjacent eastern ports represents entirely different risk profiles, freight cost structures, and logistical vulnerabilities.
The LNG supply outlook for Asian importers is particularly sensitive to this distinction, given how structurally exposed Qatari volumes remain to any sustained disruption.
How the Strait of Hormuz Functions Under Active Military Conditions
The Two-Lane Transit Architecture
The Strait of Hormuz operates under an internationally recognised traffic separation scheme that divides the narrow waterway into two primary transit corridors. The U.S.-supported southern lane runs along the Omani coast, while the northern lane, running adjacent to the Iranian coastline, remains under Iranian maritime influence. This architectural reality has profound implications for tanker operators weighing route selection under current conflict conditions.
Satellite monitoring data from maritime security firm Windward recorded 16 total vessel transits through the strait in a recent 24-hour window, split between 10 inbound and 6 outbound movements. Of the 12 tanker-specific transits tracked in that same period, the majority utilised the northern, Iranian-controlled lane rather than the U.S.-supported southern corridor. This pattern directly undermines the assertion that the southern lane is functioning as a reliable high-volume transit route.
AIS-Dark Transits: The Invisible Variable
One of the least publicly understood dimensions of Hormuz flow accounting is the problem of AIS-dark vessels. The Automatic Identification System is the maritime equivalent of an aircraft transponder, broadcasting a vessel's position, speed, and identity in real time. When tanker operators disable their AIS transponders, they disappear from conventional tracking networks entirely.
The strategic incentive for transiting dark is straightforward. Vessels broadcasting their position on the southern lane have been subject to Iranian interdiction attempts, making AIS silence a rational risk-mitigation choice. However, this creates a measurement vacuum that affects both official and independent flow accounting.
Satellite imagery from firms like Windward partially compensates for this gap by visually confirming vessel presence and movement, but satellite revisit rates and imagery resolution impose their own limitations. Importantly, even if dark transits are more numerous than currently detectable, the satellite-confirmed evidence of traffic volumes on both lanes remains far below pre-conflict norms.
The Ashley and Hestia Case Studies
Two specific vessel movements provide granular insight into the operational realities of southern corridor transits:
- The Ashley: This vessel transited the southern lane with its AIS disabled, carrying 469,000 barrels of fuel oil loaded at the Dubai lightering area on August 16. Following its transit, the Ashley was recorded idling off Fujairah, suggesting that completing a strait transit does not automatically translate into a smooth onward voyage.
- The Hestia (Hong Kong-flagged): Completed an inbound transit of the southern corridor before subsequently abandoning its position and idling off the UAE's eastern coast. The Hestia represents at least one of a minimum of two China-affiliated Very Large Crude Carriers (VLCCs) that aborted strait transits within a short window, a pattern that serves as a real-time indicator of elevated perceived operational risk.
- Sweden Prosperity (Liberia-flagged): Was among the few vessels recorded completing an inbound southern corridor transit during the monitoring period.
The VLCC abandonment rate is emerging as one of the more sensitive leading indicators available to market participants. These are the largest and most economically significant tanker classes, and their operators' decisions to abort transits reflect an insurance, liability, and operational risk calculus that no official statement can override.
Strategic Consequences: Four Scenarios That Will Shape Energy Markets
Scenario 1: Market Credibility Erosion
When government-reported energy flow data is repeatedly and materially contradicted by observable third-party evidence, the downstream consequence is not simply academic. Sovereign credibility in energy diplomacy erodes in measurable ways. Energy importers in Asia and Europe are already recalibrating procurement strategies based on independent tracking data rather than official briefings.
Inflated official flow numbers may temporarily dampen crude price volatility by suggesting supply continuity. However, when independent data forces a reconciliation, the correction can be abrupt and disorderly. Oil market disruption of this nature demonstrates that markets eventually price toward observable reality regardless of official communication.
Scenario 2: Supply Chain Rerouting Acceleration
Saudi phosphate producer Maaden provides perhaps the most concrete case study of how the Hormuz disruption is reshaping commodity logistics in real time. Having previously routed phosphate exports from its Ras Al-Khair facility through Hormuz, the company pivoted to trucking product to Saudi Arabia's Red Sea coast, primarily Yanbu, following the strait's effective closure.
The freight economics of this rerouting are instructive:
| Route | Freight Cost (60,000t DAP cargo to India) |
|---|---|
| Saudi Red Sea ports to India | ~$40/t |
| Duqm, Oman to India | ~$20s/t |
While the Duqm route offers a meaningful freight cost advantage, congestion at Omani ports is pushing up demurrage costs that partially erode this benefit. Maaden has also trimmed its 2026 phosphate production guidance to 6 to 6.5 million tonnes of DAP equivalent, citing sulphur shortages and elevated logistics costs.
Mediterranean naphtha is experiencing a parallel rerouting dynamic. Loadings from the Mediterranean destined for Asia averaged 219,000 b/d in August, up sharply from 126,000 b/d in July. The east-west naphtha swap spread widened to $37.50/t on August 19 from $30/t on August 13. European naphtha stocks in the ARA hub rose to 598,000t as of August 13, 74% above levels recorded a month earlier.
Scenario 3: The Naval Escort Economy
A less visible but economically significant consequence of the current situation is the emergence of what might be termed a naval escort economy. War risk insurance premiums for Hormuz transits have escalated substantially, and underwriters are now applying meaningfully different risk pricing to the southern lane versus the northern lane.
The compounding effect of elevated Houthi activity in the Red Sea reduces the utility of Saudi Red Sea ports as a reliable bypass, creating a situation where nearly every major export corridor from the Gulf carries elevated risk premiums simultaneously. Oil market dynamics of this scale have not been seen since the Gulf War period of 1990–91.
Scenario 4: Alternative Infrastructure Buildout
U.S. officials have cited 5 to 7 million bpd of capacity moving through pipeline alternatives. The existing bypass infrastructure includes:
- East-West Pipeline (Saudi Arabia): Theoretical capacity of approximately 5 million bpd connecting eastern Saudi fields to Yanbu on the Red Sea coast
- Habshan-Fujairah Pipeline (UAE): Connects Abu Dhabi production fields to Fujairah on the Gulf of Oman, bypassing the strait entirely
- Oman's eastern port network (Sohar, Muscat, Duqm): Increasingly utilised but operating under growing congestion constraints
Even at maximum theoretical bypass capacity, total observable Gulf export volumes remain well below pre-conflict norms. According to analysis from the Brookings Institution, the constraint is not pipeline capacity alone but the intersection of port infrastructure limitations, vessel availability, war risk premiums, and the logistical complexity of rerouting physical commodity flows at scale.
Commodity-by-Commodity Impact Assessment
Crude Oil
Iraqi and Saudi crude shipments currently account for the primary volumes still transiting Hormuz itself. Iranian crude is effectively excluded under the naval blockade. Brent and Dubai crude benchmarks have absorbed elevated uncertainty premiums, though the temporary suppressive effect of official high-volume claims on price discovery means the full risk premium may not yet be fully reflected in forward curves. Tracking crude oil price trends in this environment requires weighting independent data above official briefings.
LNG and Natural Gas
Qatar is the world's largest single-country LNG exporter, and the majority of Qatari LNG must transit through or in close proximity to Hormuz. Unlike crude oil, LNG cannot be meaningfully rerouted through pipeline bypasses, making Qatari volumes structurally exposed to any sustained disruption. Spot LNG price implications for primary Asian importers, including Japan, South Korea, and China, are consequently more severe on a per-unit basis than for crude.
Oil Products and Petrochemical Feedstocks
The Mediterranean naphtha arbitrage expansion to Asia is already cascading into Asian cracker restart economics. European naphtha cracks against ICE Brent futures have traded at a discount for most of August, averaging approximately $4/bl over recent sessions, while crack spreads against prompt North Sea Dated crude have remained negative at approximately $7/bl.
Fertilizers
Beyond Maaden's guidance cut, the broader DAP and phosphate logistics chain serving Indian and East African buyers is experiencing sustained freight cost inflation. Sulphur shortages, a key input for phosphate production, have compounded the logistical disruption into a direct production constraint.
The next major ASX story will hit our subscribers first
A Decision Framework for Energy Buyers Operating Under Hormuz Uncertainty
Market participants exposed to Middle East energy supply need a structured approach to navigating the current information environment. The following framework reflects the analytical requirements of operating under conditions where official data and observable data diverge materially.
- Establish a multi-source data baseline. Cross-reference at least three independent vessel tracking sources — Vortexa, Kpler, and TankerTrackers.com — before making procurement or pricing decisions. Weight satellite-confirmed data more heavily than AIS-only figures during active conflict periods.
- Disaggregate Gulf region flows from Hormuz strait flows. Eastern UAE and Omani port departures carry distinct risk profiles, cost structures, and capacity constraints. Model Fujairah, Sohar, and Duqm throughput as separate supply corridors.
- Stress-test against the low-flow scenario. A base case of approximately 4 million bpd total Gulf departures across all exit points represents current observable reality. A bear case should model further reductions if Iranian interdiction activity on the southern lane intensifies.
- Monitor the VLCC abandonment rate as a leading indicator. When the largest crude carriers are aborting strait transits, it signals a shift in the risk calculus of the most sophisticated maritime operators in the world.
- Price in bypass cost differentials fully. Duqm-to-India freight at approximately $20s/t versus Saudi Red Sea ports at approximately $40/t sounds attractive, but Duqm congestion premiums, war risk surcharges, and demurrage exposure must be modelled comprehensively before procurement decisions are finalised.
The Bigger Picture: Why the Hormuz Data War Has Lasting Consequences
The debate over US high-balling Hormuz energy flows is not merely a dispute about barrel counts. It represents a structural shift in how global energy markets process geopolitical risk signals. For decades, official government statements about supply disruptions carried significant market-moving weight. The current episode is accelerating a trend already underway: energy traders, refiners, and importers are systematically weighting independent vessel tracking data above official flow claims when the two diverge during active conflict periods.
If this credibility gap persists or widens, the self-fulfilling dimension becomes significant. Energy buyers who doubt the reliability of Hormuz access do not wait for diplomatic resolution. They restructure procurement away from Hormuz-dependent supply chains, invest in alternative corridor relationships, and embed higher structural risk premiums into long-term contract pricing.
In addition, global energy security experts have described the current Hormuz standoff as "the largest supply shock ever experienced", underscoring the severity of the situation beyond what official narrative suggests. If independent tracking firms continue publishing vessel-level data that persistently contradicts official assertions, the credibility test will be settled by observable market behaviour. The long-term consequence could be a permanent realignment of Asian LNG procurement toward Atlantic Basin suppliers, accelerated Duqm and Fujairah port expansion investment, and a fundamental repricing of Persian Gulf energy security risk across insurance, freight, and commodity forward markets.
This article contains analysis of geopolitical energy flow scenarios and independent market data. It does not constitute financial or investment advice. Commodity flow figures and market data referenced are subject to revision as vessel tracking methodologies evolve and new information becomes available. Readers should conduct independent due diligence before making procurement or investment decisions based on any information presented here.
For further market-level detail on vessel tracking developments and commodity flow reporting from the Gulf region, Argus Media publishes ongoing coverage at argusmedia.com.
Want to Stay Ahead of the Next Major Commodity Discovery Before the Market Moves?
The Hormuz disruption is reshaping global commodity supply chains in real time — and significant mineral discoveries on the ASX can deliver equally dramatic market movements. Discovery Alert's proprietary Discovery IQ model scans ASX announcements daily, delivering real-time alerts on high-potential mineral discoveries across more than 30 commodities, helping investors identify actionable opportunities before the broader market reacts. Explore historic discovery returns on Discovery Alert's dedicated discoveries page and begin your 14-day free trial to position yourself ahead of the next major find.