June 29, 2026
Modern global energy markets operate within a complex web of interconnected systems where regional disruptions can trigger cascading effects across continents. The petroleum sector, in particular, functions as the circulatory system of the global economy, with critical chokepoints serving as potential bottlenecks that can reshape price dynamics within hours. Understanding these transmission mechanisms becomes essential when analyzing how US Iran conflict oil impact between major powers can ripple through commodity markets, affecting everything from refined product margins to strategic reserve deployment policies.
Understanding the Geopolitical Oil Price Transmission Mechanism
Energy market volatility during periods of international tension follows predictable patterns driven by both physical supply constraints and psychological risk premiums. The global petroleum system relies heavily on specific geographic corridors that concentrate massive volumes of crude oil and liquefied natural gas flows, creating vulnerability points where disruption fears can amplify price movements far beyond the actual supply impact.
The Strait of Hormuz as a Critical Economic Chokepoint
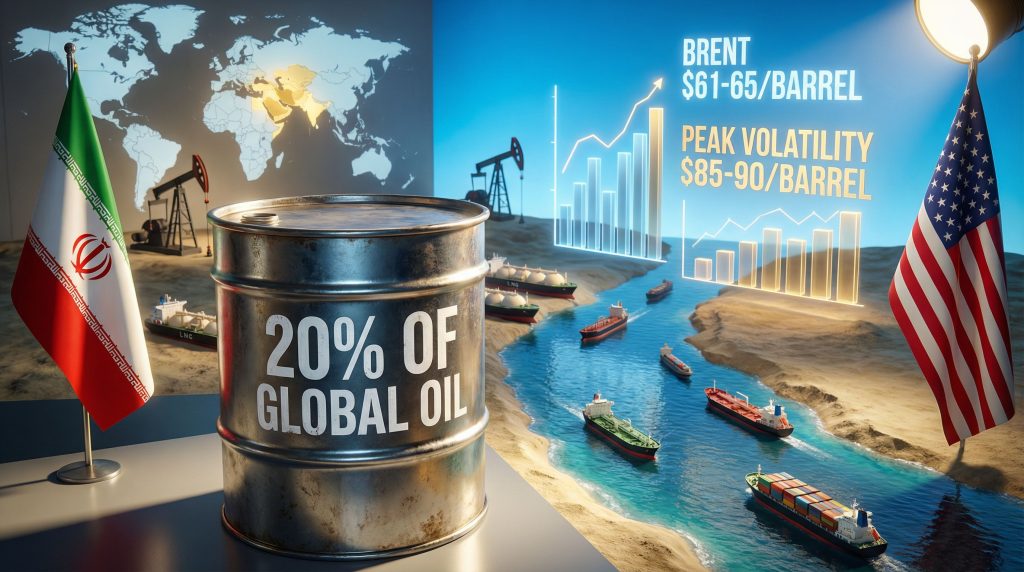
The narrow waterway separating Iran from the Arabian Peninsula represents one of the most strategically significant passages in global energy commerce. This maritime corridor facilitates the transit of approximately 20% of globally traded petroleum and 19% of LNG volumes annually, according to the U.S. Energy Information Administration. The daily flow through this passage reaches 21-25 million barrels per day (mbpd), representing crude oil from Saudi Arabia, UAE, Kuwait, Iraq, and Iran destined for Asian refineries and global markets.
The physical dimensions of this chokepoint reveal its vulnerability. At its narrowest point, the strait measures just 21 nautical miles between Iran's mainland and the Musandam Peninsula. This geographic constraint means that any military action or threat to shipping lanes can immediately impact global energy security calculations.
Economic multiplier effects extend far beyond the energy sector itself. Industries dependent on petroleum inputs, including petrochemicals, transportation, and manufacturing, experience cost pressures that can persist for months after initial supply disruptions. The downstream impact affects:
- Refinery utilization rates in Asia and Europe
- Shipping insurance premiums for vessels transiting high-risk areas
- Currency exchange rates in oil-importing economies
- Strategic reserve drawdown decisions by consuming nations
Risk Premium Calculation Models in Commodity Markets
Financial markets incorporate geopolitical uncertainty through sophisticated risk assessment frameworks that translate potential supply disruptions into immediate price adjustments. Energy traders and analysts employ scenario modeling techniques to quantify the probability and magnitude of various disruption outcomes.
The risk premium calculation process involves several key variables:
Disruption Probability Assessment:
- Historical frequency of supply interruptions in the region
- Current military posturing and diplomatic tensions
- Intelligence assessments of potential escalation scenarios
- Alternative supply route availability and capacity
Supply Impact Quantification:
- Potential volume losses measured in millions of barrels per day
- Duration estimates for different conflict scenarios
- Spare production capacity available from other producers
- Strategic reserve release capabilities and timing
Market Response Calibration:
- Price elasticity of demand during crisis periods
- Inventory level buffers in consuming regions
- Refinery flexibility to process alternative crude grades
- Consumer demand destruction thresholds at various price levels
According to energy market research, a 1 million barrel per day supply disruption typically correlates with a $2-4 per barrel price increase during the initial 30-day period. However, this relationship varies significantly based on global inventory levels, spare production capacity, and seasonal demand patterns. Furthermore, the Trump tariffs impact adds another layer of complexity to global energy price calculations during geopolitical tensions.
When big ASX news breaks, our subscribers know first
What Are the Immediate Market Responses to Middle East Tensions?
Financial markets demonstrate remarkable speed in responding to geopolitical developments, with energy futures markets often reacting within minutes of breaking news. The sequence of market responses follows a predictable pattern that reflects both algorithmic trading systems and fundamental supply-demand adjustments.
Crude Oil Benchmark Volatility Patterns
Different crude oil benchmarks exhibit varying degrees of sensitivity to Middle Eastern tensions based on their geographic origins and refinery destinations. The price relationships between major benchmarks provide insights into market expectations about supply disruption scenarios.
| Market Response Phase | Brent Price Range | WTI Price Range | Key Characteristics |
|---|---|---|---|
| Pre-escalation | $65-70/barrel | $62-67/barrel | Normal fundamentals driving |
| Initial tensions | $72-78/barrel | $68-74/barrel | News-driven volatility spike |
| Peak uncertainty | $85-95/barrel | $80-90/barrel | Maximum risk premium |
| Resolution phase | $70-75/barrel | $67-72/barrel | Gradual normalization |
The Brent-WTI spread typically widens during Middle Eastern crises as Brent crude, which serves as the benchmark for much of the world's oil, incorporates higher risk premiums than West Texas Intermediate crude produced domestically in the United States. During recent tensions, this spread has expanded to $5-8 per barrel compared to the historical average of $2-3 per barrel.
Futures curve dynamics also provide critical information about market expectations. During crisis periods, the futures curve often shifts into backwardation, where near-term contracts trade at premiums to longer-dated ones. This pattern reflects immediate supply concerns while suggesting markets expect eventual resolution.
Natural Gas and LNG Market Spillover Effects
Energy market disruptions rarely remain confined to crude oil alone. Natural gas and LNG markets experience parallel price pressures through several transmission mechanisms:
European Energy Security Implications:
- Increased demand for non-Russian LNG supplies
- Pipeline flow diversification strategies
- Strategic gas storage level monitoring
- Industrial demand curtailment preparations
Qatar LNG Export Considerations:
- Qatar operates 77 million tonnes per annum (mtpa) of LNG production capacity
- Potential shipping route adjustments around threatened areas
- Alternative long-term contract negotiations
- Spot market price premiums for immediate delivery
The interconnected nature of global gas markets means that disruptions in one region can affect pricing across multiple continents. European gas prices often rise in sympathy with Middle Eastern tensions due to supply security concerns, even when European supplies face no direct threat. Moreover, trade war oil movements often amplify these effects through complex supply chain relationships.
How Do Supply Chain Disruptions Cascade Through Energy Markets?
Energy supply chains exhibit complex interdependencies where disruptions in one segment can amplify throughout the entire system. The petroleum refining industry, in particular, demonstrates how regional production constraints can create global pricing imbalances and margin expansion opportunities.
Regional Production Impact Assessment
Middle Eastern oil production represents approximately 30% of global crude output, making any potential disruption significant for worldwide supply balances. The vulnerability assessment varies considerably by country and production facility:
| Country/Region | Current Production | Peak Capacity | Utilization Rate | Risk Level |
|---|---|---|---|---|
| Saudi Arabia | 10.2 mbpd | 10.8 mbpd | 94% | Moderate-High |
| UAE | 3.1 mbpd | 3.5 mbpd | 89% | Moderate |
| Kuwait | 2.7 mbpd | 3.1 mbpd | 87% | Moderate-High |
| Iraq | 4.4 mbpd | 5.8 mbpd | 76% | High |
| Iran | 2.1 mbpd | 3.8 mbpd | 55% | Extreme |
Source: OPEC Monthly Oil Market Report, February 2026
The production utilization rates reveal important insights about each country's ability to compensate for regional disruptions. Saudi Arabia's high utilization rate of 94% indicates limited spare capacity for immediate production increases, while Iraq's 76% utilization suggests potential for expanded output under normal circumstances.
Iranian Production Constraints:
Iran's significantly reduced production capacity utilization of 55% reflects the ongoing impact of international sanctions rather than physical limitations. This creates a unique dynamic where conflict resolution could potentially add substantial supply to global markets rather than reducing it. The OPEC production impact becomes particularly relevant in such scenarios.
Refining Margin Expansion Dynamics
Petroleum refining margins demonstrate some of the most dramatic responses to supply chain disruptions. The crack spread, which measures the difference between refined product prices and crude oil costs, can expand dramatically when crude supplies face constraints while product demand remains stable.
3:2:1 Crack Spread Analysis:
This industry-standard metric represents the profit from refining 3 barrels of crude oil into 2 barrels of gasoline and 1 barrel of distillate fuel oil. During normal market conditions, crack spreads typically range from $8-12 per barrel of crude processed.
Crisis Period Expansion Example:
- 3 barrels of crude at $85/barrel = $255 total cost
- 2 barrels of gasoline at $115/barrel = $230 revenue
- 1 barrel of heating oil at $105/barrel = $105 revenue
- Total product revenue: $335
- Crack spread: $335 – $255 = $80 per barrel processed
This represents a 567% increase over normal crack spread levels, demonstrating how supply constraints can create extraordinary profit opportunities for refineries with secure crude supply access.
Regional Refinery Vulnerability:
Middle Eastern refinery capacity of approximately 2.8 million barrels per day faces potential disruption during conflicts. Key facilities include:
- Jebel Ali Refinery (UAE): 140,000 barrels per day capacity
- Sitra Refinery (Bahrain): 267,000 barrels per day capacity
- Yanbu Refinery (Saudi Arabia): 400,000 barrels per day capacity
These facilities not only process crude for local consumption but also produce refined products for export to Asian and European markets.
What Economic Policy Tools Can Mitigate Oil Price Volatility?
Government intervention mechanisms play crucial roles in stabilising energy markets during geopolitical crises. Policy tools range from strategic reserve releases to trade policy adjustments and international coordination efforts.
Strategic Petroleum Reserve Deployment Strategies
The United States maintains the world's largest government-controlled oil stockpile with approximately 714 million barrels of crude oil stored in underground salt caverns along the Gulf Coast. Strategic Petroleum Reserve (SPR) releases serve multiple purposes during energy crises:
Market Psychological Impact:
- Signals government commitment to price stability
- Reduces speculative premium in futures markets
- Provides confidence to consuming industries and consumers
Physical Supply Augmentation:
- Maximum release capacity of 4.4 million barrels per day
- Typical releases range from 30-60 million barrels over 30-day periods
- Coordination with International Energy Agency member releases multiplies impact
Historical Effectiveness Analysis:
During the 2022 Russia-Ukraine conflict, coordinated SPR releases by IEA members totalling 240 million barrels helped moderate price increases. Research indicates that each million barrels of SPR release correlates with approximately $0.05-0.10 per barrel reduction in crude prices during crisis periods.
Trade Policy Adjustments and Import Diversification
Energy import policies become critical tools for managing supply security during regional conflicts. The US Iran conflict oil impact extends beyond direct bilateral trade to encompass broader import strategy adjustments:
Alternative Supplier Development:
- Canadian crude imports: Current capacity exceeds 4 million barrels per day
- Latin American sources: Mexico, Colombia, and Brazil provide approximately 1.8 million barrels per day
- African crude grades: Nigeria, Angola, and Ghana offer high-quality alternatives
Russian Oil Import Considerations:
Despite broader sanctions regimes, energy markets sometimes require pragmatic policy adjustments during acute supply crises. The complexity of global oil trading means that crude oil molecules can flow through multiple jurisdictions before reaching final destinations.
Shipping and Insurance Interventions:
- Government-backed shipping insurance for high-risk transit areas
- Naval escort services for commercial tankers
- Temporary suspension of Jones Act restrictions for domestic shipping
Consequently, the global tariff impact must be carefully considered when implementing these policy measures to avoid unintended market distortions.
How Do Financial Markets Price Geopolitical Risk in Energy Commodities?
Financial market mechanisms for pricing geopolitical uncertainty in energy markets involve sophisticated instruments that translate political risk into quantifiable economic terms. Understanding these pricing mechanisms provides insights into market expectations and potential investment opportunities.
Options Market Volatility Indicators
Energy options markets provide real-time assessments of uncertainty and tail-risk scenarios through various volatility metrics:
Implied Volatility Expansion:
During geopolitical crises, implied volatility in crude oil options typically increases 150-300% above normal levels. This expansion reflects market uncertainty about potential outcomes and timeline resolution.
- Normal market IV: 18-25% for at-the-money options
- Crisis period IV: 45-75% for equivalent contracts
- Peak crisis IV: Can exceed 100% during acute uncertainty phases
Put-Call Ratio Analysis:
The relationship between put and call option volumes reveals market sentiment and hedging behaviour:
- Normal conditions: Put-call ratios around 1.0-1.3
- Crisis periods: Ratios expand to 1.8-2.2 as hedging demand increases
- Extreme scenarios: Ratios can reach 3.0+ during panic selling phases
VIX Correlation Dynamics:
The relationship between the VIX (equity market volatility index) and oil prices strengthens significantly during geopolitical events:
- Normal correlation: +0.15 to +0.35 between VIX and oil prices
- Crisis correlation: +0.65 to +0.85, indicating synchronised risk-off behaviour
- Recovery correlation: Returns to normal levels as tensions resolve
Investment Flow Redirection Patterns
Geopolitical tensions trigger significant capital reallocation across energy-related investment categories:
Energy Sector Equity Performance:
- Integrated oil companies: Benefit from higher margins and price realisations
- Independent refiners: Experience dramatic margin expansion during supply constraints
- Pipeline operators: Gain from increased utilisation and alternative route premiums
- Alternative energy: Receive increased investment as energy security priorities shift
Currency Market Implications:
Oil price volatility creates secondary effects in foreign exchange markets, particularly affecting currencies of oil-importing and oil-exporting nations:
Oil-Importing Currency Weakness:
- Japanese Yen, South Korean Won, and Indian Rupee typically weaken
- European Euro faces pressure due to energy import dependence
- Import cost inflation concerns drive central bank policy considerations
Petrodollar Recycling Effects:
- US Dollar strength from increased energy transactions
- Gulf state currencies benefit from higher oil revenues
- Investment flows into dollar-denominated assets increase
According to Goldman Sachs analysis, the Iran conflict has created substantial volatility in oil price forecasting models, complicating traditional risk assessment frameworks. Additionally, Reuters reports suggest that while energy impacts may be temporary, the magnitude of short-term price movements remains significant.
What Are the Long-Term Economic Implications of Persistent Middle East Instability?
Prolonged geopolitical tensions create structural changes in global energy markets that extend far beyond immediate price volatility. These long-term implications reshape investment patterns, policy frameworks, and economic relationships across multiple continents.
Inflation Transmission Mechanisms
Energy price increases serve as a primary transmission mechanism for inflation throughout the global economy. The pass-through effects operate through multiple channels with varying time lags:
Direct Energy Cost Impacts:
- Transportation fuel costs: Immediate impact on logistics and personal mobility
- Residential heating costs: Seasonal variations in regional impact severity
- Industrial energy inputs: Manufacturing cost pressures with 2-3 month transmission lags
Indirect Inflation Amplification:
- Petrochemical input costs: Affect plastics, synthetic materials, and chemical products
- Agricultural impacts: Fertiliser and transportation cost increases affect food prices
- Service sector transmission: Energy-intensive services experience margin compression
Central Bank Policy Responses:
The challenge for monetary policymakers lies in distinguishing between temporary energy price spikes and persistent inflationary pressures:
- Transitory approach: Maintaining accommodative policy despite energy price increases
- Hawkish response: Raising interest rates to prevent inflation expectations from becoming entrenched
- Targeted interventions: Using fiscal policy and strategic reserves to address energy-specific inflation
Global GDP Growth Impact Modelling
Economic research indicates that oil price increases above certain thresholds create measurable drags on global economic growth. The relationship varies based on the underlying cause and persistence of price increases:
Price Elasticity Relationships:
- $10 per barrel increase: Typically correlates with 0.1-0.2% reduction in global GDP growth
- $20 per barrel increase: Can reduce growth by 0.3-0.5% over 12-18 months
- $30+ per barrel increase: May trigger recession concerns in energy-importing economies
Sectoral Vulnerability Assessment:
Different economic sectors demonstrate varying sensitivity to energy price shocks:
| Sector | Vulnerability Level | Impact Timeline | Mitigation Strategies |
|---|---|---|---|
| Transportation | Very High | Immediate | Fuel efficiency, alternative fuels |
| Manufacturing | High | 1-3 months | Energy hedging, process optimisation |
| Retail/Services | Moderate | 3-6 months | Price pass-through, demand management |
| Technology | Low | 6-12 months | Energy efficiency improvements |
Recovery Timeline Projections:
Historical analysis suggests that economic recovery from energy price shocks follows predictable patterns:
- Months 1-3: Immediate demand destruction and consumer adjustment
- Months 4-9: Industrial adaptation and supply chain reconfiguration
- Months 10-18: New equilibrium establishment and investment reallocation
- Beyond 18 months: Structural changes in energy consumption and investment patterns
The next major ASX story will hit our subscribers first
How Can Investors Position for Energy Market Volatility?
Investment strategies during periods of heightened geopolitical risk require sophisticated approaches that balance opportunity capture with downside protection. Energy market volatility creates both significant risks and substantial profit potential for prepared investors.
Portfolio Hedging Strategies During Geopolitical Crises
Professional investment managers employ multiple hedging techniques to manage energy market exposure during uncertain periods:
Futures-Based Hedging:
- Long crude oil futures: Direct exposure to price appreciation
- Crack spread strategies: Capture refining margin expansion opportunities
- Calendar spread trades: Profit from term structure changes during volatility
Options-Based Strategies:
- Protective put purchases: Limit downside risk while maintaining upside exposure
- Call spread combinations: Reduce premium costs while capturing moderate price increases
- Volatility plays: Purchase straddles or strangles to profit from price movement regardless of direction
Cross-Commodity Spread Trading:
Energy market disruptions create opportunities in related commodity markets:
- Oil-gas spread trades: Natural gas often outperforms crude during Middle Eastern tensions
- Refined product strategies: Gasoline and heating oil margins expand during crude supply constraints
- Alternative energy plays: Solar and wind equipment demand increases during fossil fuel uncertainty
Fundamental Analysis Framework for Crisis Periods
Investment success during energy market volatility requires robust analytical frameworks that incorporate both quantitative data and qualitative geopolitical assessments:
Supply-Demand Balance Monitoring:
- Weekly inventory reports: EIA and API data provide real-time supply indicators
- Production tracking: OPEC and non-OPEC production monitoring
- Refinery utilisation rates: Capacity constraints and maintenance schedules
- Import-export flow analysis: Trade pattern changes and alternative routing
Geopolitical Risk Assessment:
- Conflict escalation probability: Intelligence analysis and diplomatic developments
- Alliance formation patterns: Coalition building and support structures
- Economic warfare potential: Sanctions regimes and trade restrictions
- Resolution timeline estimates: Historical precedent analysis and mediation efforts
Forward Curve Analysis:
The futures curve structure provides critical insights into market expectations:
Contango Conditions (Normal):
- Longer-dated contracts priced above near-term contracts
- Indicates adequate supply expectations and storage capacity
- Suggests temporary nature of current price premiums
Backwardation Conditions (Crisis):
- Near-term contracts priced above longer-dated contracts
- Reflects immediate supply constraints and strong current demand
- Often signals sustained higher price expectations
FAQ: Understanding Oil Market Crisis Dynamics
How quickly do geopolitical events translate to pump prices?
The transmission from geopolitical events to consumer fuel prices follows a predictable timeline influenced by multiple factors. Crude oil price changes typically affect wholesale gasoline and diesel prices within 2-3 days, reflecting futures market movements and refinery procurement adjustments.
Retail price transmission occurs more gradually:
- Days 3-7: Major metropolitan markets show initial price increases
- Week 2-3: Suburban and rural markets adjust pricing
- Month 1: Full price transmission completes across all market segments
Regional variation factors:
- Refinery concentration and competition levels
- State and local fuel tax structures
- Distribution infrastructure efficiency
- Inventory levels at retail locations
What historical precedents guide current market expectations?
Energy market participants rely on historical precedent analysis to calibrate current risk assessments and price expectations:
1990-1991 Gulf War:
- Oil prices peaked at $42/barrel (equivalent to $95/barrel in current dollars)
- Duration of peak prices: Approximately 5 months
- Recovery timeline: 8 months to pre-crisis levels
2019 Saudi Aramco Attacks:
- Largest single-day oil price increase: 19.5% for Brent crude
- Supply impact: 5.7 million barrels per day temporarily disrupted
- Recovery speed: 8 trading days to normalise
2022 Russia-Ukraine Conflict:
- Peak price reached: $127/barrel for Brent crude
- Sustained elevation period: 16 weeks above $100/barrel
- Market adaptation: Alternative supply routes developed over 6-month period
Which economic indicators best predict oil market recovery?
Several key indicators provide reliable signals for energy market recovery timing:
Supply-Side Indicators:
- Spare production capacity utilisation: Recovery begins when spare capacity exceeds 2 million barrels per day globally
- Strategic reserve release rates: Declining release rates signal improving supply confidence
- Tanker charter rates: Normalising shipping costs indicate resolved logistical constraints
Demand-Side Metrics:
- Refinery utilisation rates: Recovery above 85% utilisation suggests normalising demand patterns
- Product inventory levels: Commercial inventory rebuilding indicates market rebalancing
- Crack spread normalisation: Refining margins returning to historical ranges
Financial Market Signals:
- Options implied volatility: Declining volatility suggests reduced uncertainty
- Futures curve normalisation: Return to contango structure indicates supply security
- Currency correlation patterns: Weakening correlation between oil prices and currency movements
How do different conflict scenarios affect price projections?
Energy market analysts develop multiple scenario frameworks to assess potential price outcomes based on conflict characteristics:
Limited Engagement Scenario:
- Price impact: $5-10 per barrel premium above baseline
- Duration: 2-6 weeks
- Recovery pattern: Rapid normalisation once tensions de-escalate
Regional Supply Disruption:
- Price impact: $15-25 per barrel increase
- Duration: 2-4 months
- Recovery pattern: Gradual decline as alternative supplies develop
Major Infrastructure Threat:
- Price impact: $30-50 per barrel spike potential
- Duration: 6-12 months
- Recovery pattern: New equilibrium establishment at elevated levels
Extended Conflict Scenario:
- Price impact: Sustained $20-35 per barrel premium
- Duration: 12+ months
- Recovery pattern: Structural market changes and permanent supply diversification
Each scenario incorporates specific assumptions about production capacity impacts, shipping route availability, strategic reserve deployment, and international policy responses.
Conclusion: Navigating Energy Market Uncertainty Through Economic Analysis
The US Iran conflict oil impact demonstrates the intricate relationships between geopolitical events and global commodity markets. Energy market participants must develop sophisticated analytical frameworks that incorporate both quantitative metrics and qualitative risk assessments to navigate successfully through periods of heightened uncertainty.
Key Monitoring Indicators for Market Participants
Successful navigation of energy market volatility requires continuous monitoring of specific indicators that provide early warning signals for market direction changes:
Critical Data Points:
- Weekly inventory reports from EIA and API for real-time supply assessment
- OPEC production data for spare capacity utilisation monitoring
- Tanker tracking information for shipping route and volume analysis
- Refinery utilisation rates for downstream market demand indicators
- Options market implied volatility for risk sentiment measurement
Early Warning Systems:
Market participants should establish alert systems for key threshold breaches that historically precede major price movements:
- Crude oil inventory draws exceeding 5 million barrels per week
- Refining crack spreads expanding beyond $15 per barrel
- Options implied volatility exceeding 40% for at-the-money contracts
- Strategic petroleum reserve release announcements
- Diplomatic breakthrough or escalation announcements
Risk Management Framework:
The complexity of energy market dynamics during geopolitical crises requires structured approaches to risk management that balance opportunity capture with downside protection. Successful strategies incorporate multiple time horizons, diversified exposure mechanisms, and adaptive position management techniques.
The interconnected nature of global energy systems means that localised conflicts can create worldwide economic consequences. Understanding these transmission mechanisms, monitoring key indicators, and maintaining flexible strategic approaches becomes essential for market participants seeking to navigate the challenging landscape of geopolitical energy market volatility.
This analysis is based on publicly available market data and historical precedent analysis. Energy market investments carry substantial risks and investors should conduct thorough due diligence and consider professional advice before making investment decisions. Past performance of energy markets during geopolitical events does not guarantee future results.
Want to Capitalise on Energy Market Volatility?
Discovery Alert's proprietary Discovery IQ model delivers real-time alerts on significant ASX mineral discoveries, helping investors identify actionable opportunities during periods of market uncertainty when energy sector volatility creates broader commodity market movements. Begin your 14-day free trial today to position yourself ahead of market shifts and gain the insights needed to navigate complex geopolitical developments affecting global energy markets.