
June 21, 2026
Energy market volatility represents one of the most complex interconnected systems in global finance, where military tensions between major powers create immediate price disruptions that ripple across international economies. The modern oil trading ecosystem operates through a sophisticated network of algorithmic responses, strategic reserve deployments, and geopolitical risk calculations that can trigger substantial US-Iran conflict oil price surge movements within minutes of breaking news.
Understanding how these dynamics function requires examining the intricate relationships between supply chain vulnerabilities, central bank policies, and investor psychology during periods of heightened international tension.
Understanding Risk Premium Mechanisms in Energy Markets
Modern oil markets operate through sophisticated pricing mechanisms that immediately incorporate geopolitical uncertainty into commodity valuations. When military conflicts escalate in energy-producing regions, traders implement what economists classify as geopolitical risk premiums, adding significant cost increases to crude oil futures contracts.
The US-Iran conflict oil price surge phenomenon demonstrates these market dynamics in real-time. Historical analysis reveals that risk premiums typically range from $5-15 per barrel during active conflicts, though this can vary dramatically based on perceived supply disruption severity. Furthermore, our comprehensive oil price rally analysis reveals that the 2019 tanker attacks in the Strait of Hormuz region triggered immediate 4% daily price increases, while the 2022 Ukraine invasion created $15-25 per barrel premiums that sustained for several weeks.
Key Risk Premium Characteristics:
• Algorithmic Response Speed: Futures markets now reprice within seconds of geopolitical news due to high-frequency trading dominance
• Options Volatility Expansion: Uncertainty about supply continuity drives 20-40% increases in options pricing during crisis periods
• Correlation Strengthening: Crude prices temporarily exhibit stronger correlation with equity indices during geopolitical stress
• Probability Weighting: Markets price in scenarios of infrastructure damage, production shutdowns, and transit route closures rather than waiting for actual supply disruptions
The mechanism operates through supply disruption expectations rather than immediate physical shortages. Trading algorithms now process news sentiment, satellite imagery of military movements, and diplomatic communications to calculate probability-weighted scenarios for various disruption levels.
When big ASX news breaks, our subscribers know first
Critical Global Energy Transit Vulnerabilities
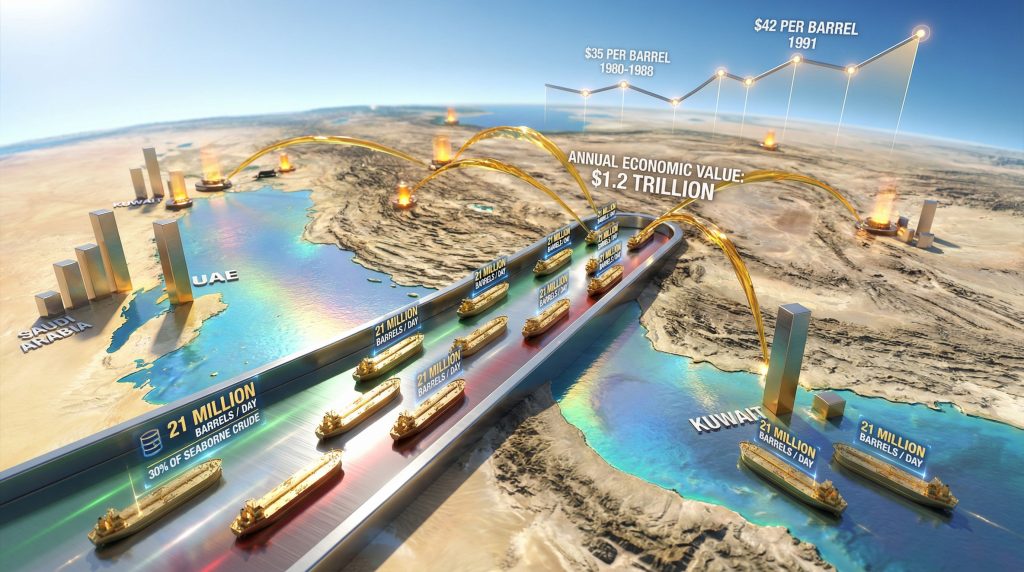
The Strait of Hormuz represents the world's most strategically vulnerable energy transit route, where geographical constraints create systematic risks for global oil supplies. This narrow waterway, measuring only 21 nautical miles at its narrowest point between Iran and Oman, serves as the mandatory passage for all maritime crude exports from the Persian Gulf region.
Strategic Transit Statistics:
| Metric | Daily Volume | Global Market Share |
|---|---|---|
| Crude Oil Transit | 21 million barrels | 21% of global petroleum trade |
| LNG Shipments | 3.5 billion cubic feet | 30% of global LNG trade |
| Annual Economic Value | $1.0-1.3 trillion | Critical to Asia-Pacific economies |
The concentration of energy infrastructure around this chokepoint creates multiple vulnerability scenarios during regional conflicts. Saudi Arabia's Ras Tanura terminal, with its 550,000 barrels per day refining capacity, represents a critical processing hub, while the East-West pipeline system provides the only viable alternative route to Red Sea ports, bypassing the Strait entirely with approximately 5 million barrels per day capacity.
Infrastructure at Risk:
• UAE Facilities: Abu Dhabi offshore fields produce approximately 3.2 million barrels daily, while Fujairah storage terminals (located outside the Strait) maintain 200 million barrels of strategic capacity
• Kuwait Production: Northern fields contribute 2.8 million barrels per day, positioned between potential conflict zones with historical vulnerability demonstrated during the 1990 Iraqi invasion
• Iranian Asymmetric Capabilities: Military assets include naval mines, anti-ship missiles, and small boat swarms designed specifically for chokepoint warfare
The geographic positioning creates a strategic dilemma where Iran possesses significant capability to disrupt global energy supplies, while coalition naval forces (primarily U.S. Fifth Fleet) maintain presence to ensure transit security. This balance of deterrence typically prevents complete closures but cannot eliminate market volatility hedging concerns during active conflicts.
Historical Analysis of Conflict-Driven Price Volatility
Examining previous geopolitical crises reveals consistent patterns in how oil markets respond to military conflicts, though the magnitude and duration vary significantly based on actual supply disruptions versus perceived threats.
Major Historical Price Events:
1980-1988 Iran-Iraq War Period:
The prolonged conflict demonstrated how sustained regional warfare affects global energy markets. Oil prices opened 1980 around $37 per barrel following the 1979 Iranian Revolution, peaked at $43 per barrel in 1981, then experienced dramatic volatility throughout the war period. By 1986, oversupply and reduced demand had collapsed prices to the $10-15 range, illustrating how markets eventually adjust to sustained disruption levels.
1991 Gulf War Response:
Military action in the Persian Gulf triggered immediate market overreaction, with Brent crude peaking at $40.40 per barrel on October 11, 1990, following Iraq's invasion of Kuwait. The subsequent swift coalition victory demonstrated market tendency toward initial pessimistic scenarios. Prices fell from $40 to $22 per barrel within weeks of the 100-hour ground campaign conclusion, equivalent to approximately $95-105 in current purchasing power.
2019-2020 Strait Tensions:
The attacks on the Kokuka Courageous and Front Altair tankers on June 13, 2019, provide the most relevant recent precedent for current US-Iran conflict oil price surge scenarios. Brent crude rose from $61.50 to $64.35 (+4.6%) in a single trading day, while war risk insurance premiums for tankers increased from 0.01% to 0.05-0.10% (representing a 5-10x increase).
Key Market Lessons:
• Overreaction Pattern: Initial price spikes typically exceed sustained impacts as markets price worst-case scenarios
• Duration Dependency: Longer conflicts allow supply chain adaptation and alternative sourcing arrangements
• Resolution Speed: Swift military conclusions often trigger rapid price normalisation
• Infrastructure Resilience: Modern supply chains demonstrate greater flexibility than historical precedents suggest
These historical examples reveal that whilst initial market reactions can be severe, sustained high prices depend more on actual supply disruption duration than conflict announcement or military activity levels. Moreover, the recent oil price trade war analysis demonstrates how modern markets respond differently to various geopolitical pressures.
Strategic Reserve Management and OPEC+ Response Patterns
OPEC+ maintains approximately 2.7 million barrels per day of readily deployable spare capacity, primarily concentrated in Saudi Arabia (2.0 million barrels daily) and the UAE (0.3-0.5 million barrels daily). During geopolitical crises, the cartel faces competing economic and political pressures that shape their response strategies.
Strategic Decision Framework:
The organisation must balance revenue maximisation from higher prices against market stability concerns and diplomatic relationships with consuming nations.
OPEC+ Member Fiscal Breakeven Points (per barrel):
• Saudi Arabia: $80-85 (balanced budget requirement)
• UAE: $75-80 (government spending needs)
• Kuwait: $85-90 (social programme funding)
• Iraq: $90-95 (infrastructure investment demands)
Emergency Response Protocols:
Historical emergency releases typically range from 500,000 to 1.0 million barrels per day, though this varies by crisis severity. Additionally, understanding the broader OPEC meeting impact helps predict cartel responses to geopolitical tensions:
• 2022 IEA Coordinated Release: 120 million barrels authorised (approximately 1.3 million barrels daily over 90 days)
• 2005 Hurricane Katrina Response: 30 million barrels released from Strategic Petroleum Reserve, reaching peak flows of 1.4 million barrels daily
• Coordination Mechanisms: International Energy Agency protocols enable synchronised releases from multiple strategic reserve systems
The effectiveness of these interventions depends on market psychology as much as physical supply additions. Announcements of pending releases often provide immediate price relief even before actual oil reaches markets, demonstrating the importance of coordinated communication strategies during crisis periods.
Regional Infrastructure Vulnerabilities During Military Conflicts
Middle Eastern oil infrastructure presents multiple strategic targets during regional military conflicts, with varying levels of defensive protection and alternative routing capabilities. Understanding these vulnerabilities helps explain market risk assessment patterns during US-Iran conflict oil price surge scenarios.
Critical Saudi Arabian Assets:
The Kingdom's energy infrastructure represents the world's largest concentration of spare production capacity, making it a primary target for asymmetric warfare strategies. The Ghawar field, confirmed as the world's largest conventional oil field with approximately 5 million barrels daily production capacity, operates with sophisticated protective systems but remains vulnerable to missile or drone attacks.
The East-West pipeline system provides crucial strategic flexibility, transporting crude from eastern production fields to Red Sea loading terminals, completely bypassing the Strait of Hormuz. This 5 million barrel daily capacity represents the only major alternative to Gulf shipping routes for Saudi exports.
UAE Strategic Positioning:
Abu Dhabi's offshore production fields contribute approximately 3.2 million barrels daily to global supplies, whilst maintaining advantageous positioning outside immediate conflict zones. The Fujairah storage terminals, located on the Oman Sea coast outside the Strait of Hormuz, provide 200 million barrels of strategic storage capacity with direct access to international shipping lanes.
Kuwait's Vulnerable Geography:
Positioned between potential conflict zones, Kuwait's northern fields produce approximately 2.8 million barrels daily whilst maintaining historical vulnerability to regional warfare. The 1990 Iraqi invasion demonstrated complete production shutdown risks, with infrastructure restoration requiring over two years following conflict resolution.
Defence and Deterrence Systems:
• Patriot Missile Batteries: Deployed at major production facilities and loading terminals
• Naval Protection: Coalition maritime forces maintain regular patrols of critical shipping lanes
• Satellite Monitoring: Real-time tracking of potential threats to infrastructure
• Rapid Response Protocols: Emergency shutdown and restart procedures for production facilities
These defensive measures provide significant protection but cannot eliminate all risks during active military conflicts, particularly from advanced missile systems or coordinated attack scenarios.
Safe-Haven Asset Correlation Patterns During Energy Crises
Geopolitical oil shocks trigger predictable investment flow patterns as portfolio managers seek protection from market volatility and inflation pressures. Gold, as the primary safe-haven commodity, exhibits strong correlation with oil price spikes during military conflicts. However, the comprehensive gold price forecast suggests these relationships are becoming more complex.
Asset Performance During Energy Crises:
| Asset Class | Typical Response | Duration | Correlation with Oil |
|---|---|---|---|
| Gold | +3-8% surge | 4-8 weeks | 0.6-0.8 |
| Oil Futures | +5-15% spike | 1-3 weeks | 1.0 (baseline) |
| Defence Stocks | +2-6% gain | 2-4 weeks | 0.4-0.6 |
| Airlines/Transport | -5-12% decline | 3-6 weeks | -0.7 to -0.9 |
Gold Price Dynamics:
During oil-driven geopolitical crises, precious metals markets typically demonstrate immediate surge patterns of 2-5% within the first 24 hours of conflict escalation. The sustained premium often lasts 2-6 weeks, depending on conflict resolution speed and actual supply disruption levels.
Investment Flow Analysis:
Portfolio rebalancing during energy crises follows established patterns:
• Institutional Responses: Pension funds and sovereign wealth funds typically reduce energy-intensive sector exposure whilst increasing commodity allocations
• Retail Investor Behaviour: Individual investors often exhibit delayed response patterns, entering positions 2-3 days after institutional moves
• Algorithmic Trading: High-frequency systems now account for immediate price discovery, processing news sentiment and satellite imagery within seconds
The modern market structure creates faster initial responses but also increases volatility clustering, where periods of uncertainty extend longer than historical precedents due to algorithmic feedback loops.
The next major ASX story will hit our subscribers first
Australian Market Insulation and Energy Security Profile
Australia maintains relative protection from Middle Eastern energy supply disruptions through domestic production capabilities and diversified import sourcing, though complete insulation remains impossible given global market interconnectedness.
Domestic Energy Security:
• Oil Production: Domestic sources cover approximately 20% of national consumption, primarily from Bass Strait and Northwest Shelf operations
• Strategic Reserves: Government maintains 90-day import cover through International Energy Agency protocols
• Import Diversification: Crude sources include Malaysia (35%), UAE (25%), and Saudi Arabia (20%), reducing single-source dependency
ASX Energy Sector Response Patterns:
During Middle Eastern conflicts, Australian energy companies typically experience:
Oil Producers (Woodside, Santos):
- Share price gains of 3-8% during initial crisis periods
- Sustained outperformance if conflicts extend beyond 30 days
- Increased investment in domestic exploration projects
LNG Exporters:
- Premium pricing for Asian market deliveries during supply uncertainty
- Contract renegotiation opportunities during extended disruptions
- Accelerated development timelines for approved projects
Refining Operations:
- Expanded margins during supply chain disruptions
- Increased utilisation of domestic crude processing
- Strategic inventory management during crisis periods
Natural Market Advantages:
Geographic isolation provides Australia with unique energy security benefits compared to European or Asian economies more dependent on Middle Eastern supplies. The domestic natural gas sector, in particular, benefits from increased Asian demand during regional supply uncertainty.
Modern Algorithmic Trading Impact on Oil Market Dynamics
Contemporary oil markets exhibit fundamentally different characteristics compared to historical periods due to electronic trading dominance and artificial intelligence integration. These technological changes create both faster price discovery and increased volatility clustering during geopolitical events.
High-Frequency Trading Characteristics:
• Response Speed: News-to-price reaction times now average under 30 seconds for major geopolitical developments
• Volume Amplification: Breaking news periods generate 300-500% volume increases above normal trading levels
• Sentiment Processing: Algorithms now analyse social media feeds, diplomatic communications, and satellite imagery for trading signals
Market Structure Evolution:
Electronic trading represents approximately 85% of crude futures volume, compared to 15% in the 1990s. This transformation creates several important implications for crisis response:
Correlation Increases: During geopolitical stress periods, oil prices now exhibit 0.6-0.8 correlation with equity indices, compared to historical levels of 0.2-0.4. This reflects algorithmic risk-off positioning across multiple asset classes simultaneously.
Volatility Clustering: Extended periods of heightened uncertainty now persist longer than historical norms due to algorithmic feedback loops that amplify initial price movements.
Information Processing: Modern trading systems incorporate multiple data streams including:
- Real-time shipping traffic through critical chokepoints
- Satellite imagery of production facilities and military movements
- Central bank communication analysis for policy response anticipation
- Social media sentiment scoring for market psychology assessment
These technological advances mean that US-Iran conflict oil price surge scenarios now unfold much faster than historical precedents, with initial market reactions completing within hours rather than days.
Supply Chain Disruption Cascades Beyond Energy Sectors
Regional military conflicts in the Persian Gulf create far-reaching economic impacts that extend well beyond crude oil markets, affecting global manufacturing and transportation systems through interconnected supply chain dependencies.
Shipping and Insurance Impact:
War risk premiums for maritime insurance increase dramatically during Middle Eastern conflicts, often rising from normal levels of 0.01% to 0.05-0.10% of cargo value (representing 5-10x increases). Alternative routing around conflict zones adds 10-15 days to typical Asia-Europe shipping schedules, whilst container shipping rates often spike 20-40% during extended crisis periods.
According to Reuters analysis, oil prices could potentially spike to $100 per barrel during severe conflict scenarios, creating significant downstream effects across multiple industries.
Petrochemical Supply Dependencies:
Manufacturing sectors dependent on petrochemical feedstocks experience cascading price pressures:
• Automotive Industry: Plastic components and synthetic materials see immediate cost increases
• Electronics Manufacturing: Semiconductor packaging materials and plastic housings affected
• Construction Materials: PVC, polyethylene, and other petroleum-derived products experience price volatility
Just-in-Time Vulnerability:
Modern supply chain efficiency creates systematic vulnerabilities during energy crises. The 2019 tanker attacks demonstrated how quickly manufacturers must adapt sourcing strategies when primary supply routes face uncertainty.
Regional Manufacturing Impact:
Asian refineries, which process approximately 60% of Middle Eastern crude exports, must implement contingency protocols during supply disruptions:
- Extended force majeure periods for delivery contracts
- Strategic reserve utilisation for feedstock continuity
- Alternative crude source activation (often at premium pricing)
Furthermore, CNN reports highlight how US strikes in Iran could see oil prices surge dramatically, affecting global manufacturing costs. These secondary effects often persist longer than initial oil price spikes, as supply chain reorganisation requires weeks or months to complete even after conflicts resolve.
Central Bank Policy Responses to Energy-Driven Inflation
Central banks face complex monetary policy decisions when oil price shocks threaten economic stability, balancing inflation control against growth preservation during geopolitical uncertainty periods.
Federal Reserve Historical Approaches:
The U.S. central bank's response patterns have evolved significantly since the 1970s oil crises:
• 1970s Strategy: Aggressive interest rate increases to combat energy-driven inflation, contributing to deep recessions
• 2008 Response: Delayed monetary tightening due to simultaneous financial crisis, prioritising financial stability over inflation control
• 2022 Approach: Gradual rate normalisation whilst emphasising temporary nature of energy price increases
Reserve Bank of Australia Framework:
The RBA typically implements several strategies during energy price disruptions:
Core Inflation Focus: Monetary policy decisions emphasise underlying inflation trends excluding volatile energy components, providing stability during temporary supply shocks.
Fiscal Coordination: Communication with government regarding fuel excise adjustments and emergency reserve releases to minimise economic disruption.
Forward Guidance: Clear messaging about temporary nature of energy-driven inflation to anchor inflation expectations and prevent secondary effects.
International Coordination Mechanisms:
During major energy crises, central banks often coordinate policy responses through:
- G7 finance minister communications
- International Monetary Fund consultation processes
- Bank for International Settlements coordination protocols
- Regional central bank cooperation agreements
This coordination becomes particularly important when energy supply disruptions affect multiple economies simultaneously, requiring synchronised policy responses to maintain global financial stability.
Investment Portfolio Positioning During Energy Market Volatility
Professional investment managers implement systematic strategies to protect portfolios and capitalise on opportunities during geopolitical oil market disruptions. These approaches have evolved significantly as energy markets have become more complex and interconnected with other asset classes.
Energy Sector Allocation Strategies:
Overweight Integrated Oil Companies: Major international oil companies with diversified operations and strategic reserves often outperform during crisis periods. These firms benefit from both higher commodity prices and increased margins on existing inventory holdings.
Underweight Energy-Intensive Industries: Airlines, shipping companies, and heavy manufacturing face immediate margin pressure from increased input costs. Portfolio managers typically reduce exposure to these sectors at the first signs of sustained energy price increases.
Renewable Energy Hedge Positioning: Increased energy security concerns during geopolitical conflicts often accelerate government support for domestic renewable energy development, creating investment opportunities in wind, solar, and battery storage technologies.
Geographic Diversification Approaches:
• Reduce Middle East Exposure: Mutual funds and ETFs with heavy regional exposure face heightened volatility during local conflicts
• Increase North American Energy Assets: Domestic production companies benefit from both higher prices and increased strategic importance
• Norwegian Model Consideration: The sovereign wealth fund approach of diversifying away from resource dependency provides portfolio stability lessons
Commodity Exposure Management:
Direct Futures Positions: Short-term oil futures contracts provide immediate exposure to price movements but require active management due to contango/backwardation effects.
Energy Infrastructure REITs: Pipeline companies, storage facilities, and transportation assets offer medium-term exposure with dividend income stability.
Strategic Metal Reserves: Copper, aluminium, and lithium often correlate with energy prices during geopolitical stress, providing diversified commodity exposure.
Risk Management Protocols:
Institutional investors typically implement several protective measures during energy crises:
- Increased cash allocations to maintain liquidity during volatility
- Options strategies to hedge downside risk in affected sectors
- Currency hedging for international energy investments
- Stress testing portfolios against various crisis duration scenarios
Market Psychology and Behavioural Patterns During Oil Crises
Understanding investor psychology during energy market disruptions reveals predictable patterns that sophisticated traders exploit whilst retail investors often fall victim to emotional decision-making during crisis periods.
Institutional vs. Retail Response Timing:
Professional fund managers typically react within hours of geopolitical developments, using algorithmic systems and risk management protocols to reposition portfolios immediately. Retail investors often exhibit delayed responses, entering positions 2-3 days after news breaks, frequently buying near short-term price peaks.
Fear and Greed Cycle Dynamics:
Energy crises create pronounced emotional trading patterns:
Initial Panic Phase (Days 1-3): Overreaction to worst-case scenarios drives immediate price spikes across energy-related assets.
Reality Assessment (Days 4-14): Markets begin pricing actual supply disruption levels rather than theoretical maximum impacts.
Adaptation Period (Weeks 3-8): Supply chain adjustments and strategic reserve releases typically moderate initial price increases.
Resolution Anticipation (Variable): Markets often begin recovery before actual conflict resolution as diplomatic progress generates optimism.
Cognitive Bias Exploitation:
Experienced traders capitalise on predictable behavioural patterns:
- Availability Heuristic: Recent energy crises (2008, 2022) create outsized fear responses to new disruption threats
- Herding Behaviour: Retail investors follow institutional movements with significant delays, creating arbitrage opportunities
- Loss Aversion: Energy stocks often oversell during initial crisis periods as investors prioritise capital preservation over profit opportunities
Technical Analysis of Modern Oil Market Structure
The contemporary oil market operates through sophisticated electronic systems that create unique technical trading patterns during geopolitical stress periods. Understanding these structural changes helps explain why modern energy crises unfold differently than historical precedents.
Electronic Trading Dominance Impact:
Approximately 85% of crude futures volume now occurs through electronic platforms, compared to traditional open-outcry systems that dominated until the early 2000s. This transformation creates several key characteristics:
Microsecond Price Discovery: Algorithmic systems process news feeds, satellite data, and diplomatic communications to generate trading signals faster than human cognitive processing allows.
Volatility Amplification: Electronic systems can execute thousands of trades per second, amplifying initial price movements through momentum-based algorithms.
Cross-Asset Correlation: Modern portfolio management systems automatically adjust positions across multiple asset classes simultaneously, creating stronger correlations between oil prices and equity indices during stress periods.
Options Market Sophistication:
Contemporary options markets provide sophisticated tools for both hedging and speculation during energy crises:
- Volatility increases of 20-40% during crisis periods reflect uncertainty about conflict duration and supply impact severity
- Put/call ratios often shift dramatically as institutional investors hedge existing positions
- Options flow analysis provides early indicators of institutional sentiment changes
High-Frequency Trading Considerations:
HFT systems now account for approximately 50-60% of crude futures volume during normal periods, increasing to 70-80% during crisis events. These systems:
- React to news within 100-500 milliseconds of publication
- Process social media sentiment, diplomatic communications, and satellite imagery
- Create liquidity during normal periods but can amplify volatility during stress events
Preparing Investment Strategies for Energy Market Uncertainty
Modern investors must account for the evolving nature of geopolitical energy risks, where traditional approaches may prove insufficient given technological changes and increased market interconnectedness. Successful preparation requires understanding both immediate tactical responses and longer-term strategic positioning.
Immediate Crisis Response Framework:
When US-Iran conflict oil price surge scenarios develop, experienced investors implement several coordinated strategies:
Liquidity Management: Maintaining 10-15% cash allocation provides flexibility to capitalise on oversold conditions during initial panic phases.
Sector Rotation Protocols: Pre-established criteria for reducing airline, shipping, and manufacturing exposure whilst increasing energy producer and precious metals allocations.
Options Hedging: Protective put strategies on broad market indices hedge against systematic risk whilst maintaining upside exposure.
Long-Term Structural Considerations:
Energy market evolution requires strategic portfolio adjustments beyond immediate crisis response:
• Renewable Energy Transition: Government energy security concerns often accelerate domestic renewable development during geopolitical stress
• Infrastructure Investment: Pipeline companies, storage facilities, and transportation assets gain strategic importance during supply uncertainty
• Technology Integration: Companies developing energy efficiency technologies benefit from increased corporate and government investment priorities
Risk Assessment Protocols:
Professional investors increasingly rely on multiple analytical frameworks:
- Scenario planning for various conflict duration and intensity levels
- Supply disruption modelling using satellite monitoring and shipping data
- Central bank policy response anticipation based on inflation targeting frameworks
- Currency hedging strategies for international energy investments
Understanding that modern energy markets operate through complex interconnected systems enables better preparation for inevitable volatility during regional conflicts. The Australian market's relative insulation provides some protection, but global interconnectedness means no economy remains completely immune to major energy supply disruptions affecting critical producing regions.
Disclaimer: This analysis is for educational and informational purposes only and should not be considered as financial advice. Energy markets involve substantial risk, and geopolitical events can create significant price volatility. Readers should conduct their own research and consult with qualified financial advisors before making investment decisions. Past performance does not guarantee future results, and all investments carry risk of loss.
Ready to Capitalise on the Next Major Mineral Discovery?
Discovery Alert's proprietary Discovery IQ model delivers real-time notifications on significant ASX mineral discoveries, empowering subscribers to identify actionable opportunities ahead of the broader market. Explore Discovery Alert's discoveries page to understand how historic mineral discoveries have generated substantial returns, then begin your 14-day free trial to position yourself advantageously for the next breakthrough.