July 24, 2026
When Geopolitics Meets the Trading Floor: Two Shocks Hit the ASX at Once
Global equity markets have always been sensitive to the drumbeat of conflict, but what makes the events of 24 July 2026 particularly significant for Australian investors is not one macro shock arriving in isolation. It is the rare and uncomfortable simultaneity of two independent forces colliding at the same moment: a military escalation in the Middle East that has pushed Brent crude back above US$100 per barrel, and a fresh round of US tariffs landing on approximately 60 countries with Australia absorbing a 12.5% rate. The result is a -0.5% decline signalled in ASX futures heading into Friday's open on 25 July 2026, a move that deserves far more analytical unpacking than a single headline can provide.
Understanding why the US-Iran war escalation and ASX futures drop are connected requires tracing the transmission mechanism from a narrow waterway in the Persian Gulf all the way to the screens of investors in Sydney and Melbourne. Furthermore, the global trade impact of these converging pressures extends well beyond Australia's borders, making this a genuinely systemic event rather than a localised market disruption.
When big ASX news breaks, our subscribers know first
The Strait of Hormuz: The World's Most Consequential Chokepoint
Few geographic features carry the economic weight that the Strait of Hormuz does. At its narrowest point, the passage is only about 33 kilometres wide, yet roughly 20% of the world's daily oil supply transits through it. Tankers carrying crude from Saudi Arabia, Iraq, Iran, Kuwait, and the UAE all depend on safe passage through this corridor. When that passage is disrupted, even partially or temporarily, the repricing effect in global energy markets is almost instantaneous.
Historical precedent reinforces this point. During the so-called Tanker War of the 1980s, insurance premiums on vessels transiting the Gulf surged dramatically, and spot oil prices reflected the risk premium within days. More recent Iranian threats to close the strait during nuclear negotiations in 2011 and 2012 produced immediate crude price spikes even though no actual closure occurred. Markets do not wait for confirmation of physical disruption; they price in the probability of it.
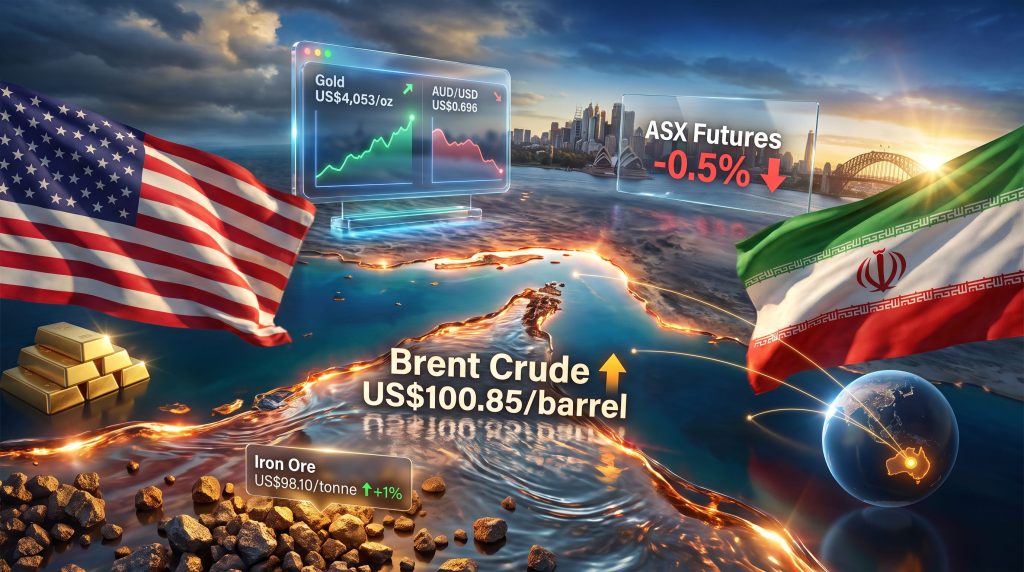
The latest escalation in US-Iran hostilities has rekindled that dynamic. With diplomatic channels appearing increasingly non-functional and military exchanges continuing despite international pressure, the market has concluded that a sustained resolution is not imminent. Brent crude at US$100.85 per barrel as of 24 July 2026 reflects exactly that calculus.
What makes Hormuz-driven oil shocks particularly damaging for equity markets is their inflationary character. Unlike demand-led oil price increases, which at least imply strong underlying economic activity, supply disruption-driven price spikes push costs higher without any corresponding growth benefit. This is the textbook precondition for stagflation.
Oil at US$100 and What It Actually Means for Australian Households and Businesses
The symbolic weight of triple-digit crude is not purely psychological, though psychology certainly plays a role. Sustained Brent prices above US$100 per barrel typically begin feeding through to domestic Australian fuel prices within two to four weeks, depending on refining margins, the currency exchange rate, and fuel excise structures.
For Australian households, the practical impact is straightforward: petrol and diesel costs rise, reducing disposable income. For businesses with logistics, transport, or manufacturing dependencies, input cost pressures increase. For the Reserve Bank of Australia, a sustained oil-driven inflation impulse complicates the rate-setting environment considerably, particularly if it coincides with softening domestic demand.
The Australian dollar's current positioning at US$0.696 adds another layer. A weaker AUD amplifies the domestic price impact of any globally-priced commodity, because oil is invoiced in US dollars. When the currency is soft and crude is elevated simultaneously, Australian consumers absorb a compounded cost increase rather than a single variable shock.
Trump's Tariff Layer: A Second Independent Pressure Source
Separate from the Middle East dynamic, but landing on the same trading day, the US administration activated a new tariff framework affecting approximately 60 nations. The structure applies rates ranging from 10% to 12.5%, with Australia placed at the higher end of that band at 12.5%, effective from 2:01pm AEST on 24 July 2026. The broader effect of tariffs on investment markets has been well documented, and the current measures are consistent with that pattern of heightened uncertainty.
| Tariff Variable | Detail |
|---|---|
| Countries affected | Approximately 60 nations |
| Tariff range | 10% to 12.5% |
| Australia's rate | 12.5% |
| Effective date and time | 24 July 2026, 2:01pm AEST |
| Legal status | Temporary measure, subject to Supreme Court proceedings |
The political context here matters. The Trump administration's original Liberation Day tariff agenda from 2025 encountered significant legal friction at the US Supreme Court level. The current tariff structure appears to function as a holding mechanism, applying broad tariff pressure across trading partners while the administration's more ambitious tariff framework remains tied up in litigation.
Classifying the current measures as temporary does not reduce their immediate market impact; traders and exporters respond to what is in force now, not to what might be resolved later. For Australian exporters, the 12.5% rate introduces demand uncertainty at a time when commodity markets are already navigating geopolitical headwinds. This is particularly relevant for sectors where price competitiveness in the US market is marginal.
How ASX Sector Exposure Breaks Down Across Both Shocks
Not every part of the Australian market reacts to these pressures in the same way. Understanding the sector-level differentiation is where the more actionable analytical work begins.
| ASX Sector | Likely Impact | Key Variable |
|---|---|---|
| Energy producers (upstream) | Positive short-term | Brent crude above US$100 per barrel |
| Materials and mining | Mixed | Iron ore recovery versus tariff demand risk |
| Gold equities | Positive | Gold at US$4,053 per ounce |
| Financials | Negative | Risk-off rotation, inflation expectations |
| Consumer Discretionary | Negative | Fuel cost pass-through, sentiment drag |
| Industrials | Negative | Tariff uncertainty, shipping cost pressure |
Energy: The Nuance Between Upstream and Downstream
A common investor error during oil price spikes is treating the energy sector as monolithically bullish. Upstream producers with direct exposure to crude output benefit from elevated prices, at least in the near term. However, downstream energy retailers and companies dependent on refined product inputs face margin compression when wholesale input costs rise faster than the retail prices they can pass on.
The divergence between Brent crude at US$100.85 per barrel and US natural gas futures at a comparatively subdued US$2.91 per gigajoule further complicates sector-level generalisation.
Gold: The Clearest Defensive Signal
Gold safe-haven demand at US$4,053 per ounce is not a trivial data point. Precious metals at these levels confirm that institutional capital is actively rotating into safe-haven positioning. For ASX-listed gold producers, the revenue implications are significant, and gold equities have historically been among the most reliable outperformers during geopolitical oil shocks precisely because they benefit from both the risk-off sentiment and the inflation hedging dynamic simultaneously.
Iron Ore: Partial Buffer, Not a Full Offset
Iron ore's modest recovery to US$98.10 per tonne in Singapore, representing a +1% gain, provides some cushion for Australia's major diversified miners. However, it is important not to overstate this signal. Monitoring iron ore price trends reveals that a single-day recovery in pricing does not neutralise the broader headwinds facing materials stocks during a risk-off session, particularly when tariff-driven demand uncertainty is also in play.
Historical ASX Behaviour During Middle East Escalations
Looking at prior US-Middle East military escalation episodes provides useful context for calibrating the current situation. During the Gulf War in 1990 to 1991, the initial Iraqi invasion of Kuwait produced sharp equity market sell-offs globally, with the ASX participating in that drawdown before recovering as the military campaign produced a swift resolution. The Iraq invasion of 2003 followed a similar pattern: acute initial volatility followed by stabilisation once the scope of supply disruption became clearer.
The key historical pattern worth noting is that initial ASX drawdowns during major geopolitical oil shocks have typically ranged from 2% to 5% over the first two weeks, before markets stabilise as the physical supply impact either materialises or fails to be as severe as initially feared. The current -0.5% futures signal may therefore represent only the opening chapter of a more extended repricing process if the conflict does not de-escalate quickly.
A subtler historical observation is the concept of the ceasefire premium. During any period of relative calm in a conflict zone, markets quietly price in a reduced risk premium for energy supply. When that ceasefire collapses, the market does not simply return to the pre-ceasefire pricing level; it often overshoots in the other direction because of the psychological whiplash of having priced in peace and then having that assumption invalidated.
The next major ASX story will hit our subscribers first
Key Indicators to Monitor Through This Volatility Window
For investors navigating the current environment, several data points and thresholds deserve close attention in the days ahead. The ASX commodity pressure context is particularly relevant when monitoring the following variables:
- Brent crude trajectory: A sustained hold above US$100 per barrel amplifies inflationary pressure. A return below US$95 would suggest the geopolitical risk premium is being partially unwound.
- Strait of Hormuz operational status: Any confirmed physical interference with tanker traffic represents a material escalation beyond current pricing assumptions.
- S&P Global Composite PMI: Released on 24 July 2026, this reading provides a contemporaneous snapshot of global manufacturing and services activity. A sub-50 composite reading would signal contraction and add a demand-side worry on top of the existing supply-side shock.
- AUD/USD: Currently at US$0.696, a break below US$0.685 would indicate deepening risk-off sentiment and amplify the domestic inflation impact of elevated crude.
- US Supreme Court ruling on tariff legality: The temporary classification of current tariffs makes this a pivotal legal variable. A ruling that constrains the administration's tariff authority could remove one of the two macro headwinds relatively quickly.
- RBA rate expectations: If oil-driven inflation feeds into domestic CPI readings, it could shift the rate outlook in ways that compound the headwind for interest-rate-sensitive sectors like financials and real estate.
Commodity Pricing Snapshot: 24 July 2026
| Commodity | Current Price | Direction | Market Signal |
|---|---|---|---|
| Brent Crude | US$100.85 per barrel | Rising | Geopolitical risk premium active |
| Iron Ore (Singapore) | US$98.10 per tonne | +1% recovery | Modest demand signal |
| Gold | US$4,053 per ounce | Elevated | Safe-haven demand confirmed |
| US Natural Gas | US$2.91 per gigajoule | Falling | Demand softness, adequate supply |
| AUD/USD | US$0.696 | Soft | Risk-off currency positioning |
Positioning Strategy: Navigating a Dual-Shock Environment
When two independent macro shocks converge, the standard portfolio construction question shifts from which sectors to overweight toward which risks to hedge and which exposures to reduce. Three broad scenarios help frame the range of outcomes:
- Near-term diplomatic breakthrough and tariff withdrawal: Both headwinds dissipate within 60 to 90 days. Markets recover sharply, cyclical and materials stocks lead the rebound, and the current futures decline looks like a brief volatility spike in retrospect.
- Conflict persists, tariffs become entrenched: Stagflationary pressure builds. Oil remains above US$100 per barrel, inflation expectations rise, consumer confidence deteriorates, and equity valuations face sustained headwinds across discretionary and financial sectors.
- Partial resolution on one front only: One shock resolves while the other lingers, producing a mixed sectoral outcome where commodity-linked names recover but export-oriented and consumer-facing stocks remain under pressure.
In all three scenarios, gold-exposed equities and upstream energy producers with domestic output maintain the most defensible near-term positioning. Cash and short-duration allocations provide tactical flexibility during the uncertainty window. Consumer discretionary and industrial stocks face the most challenging environment under scenarios two and three.
Frequently Asked Questions
Why does Middle East conflict cause ASX futures to fall?
ASX futures reflect overnight global sentiment. When US-Iran war escalation and ASX futures drop events coincide, risk appetite deteriorates internationally, oil prices rise, and capital rotates from equities into safe-haven assets. Asia-Pacific equity index futures, including ASX futures, absorb this sentiment shift before the local market opens. The US Energy Information Administration regularly publishes data on Hormuz transit volumes that can help investors track the real-time severity of any supply disruption.
Does Australia import Middle Eastern oil directly?
Australia is not as directly dependent on Middle Eastern crude as some of its Asian neighbours. However, global oil markets are fungible. A supply disruption anywhere in the world lifts prices universally, and Australia's import costs rise regardless of the specific origin of its crude supply. Shipping cost increases and insurance premium surges associated with Hormuz disruptions also affect Australia indirectly.
Are the current US tariffs permanent?
Based on available reporting, the 10% to 12.5% tariffs activated on 24 July 2026 are classified as a temporary measure connected to the administration's broader tariff agenda, which remains subject to ongoing US Supreme Court proceedings. The temporary classification does not eliminate their near-term economic impact. The World Trade Organization continues to monitor these developments and their implications for multilateral trade frameworks.
Which ASX sectors typically hold up best during oil price shocks?
Historically, upstream energy producers, gold miners, utilities, and healthcare companies have demonstrated relative resilience during geopolitical oil price spikes. Furthermore, export-oriented industrials, consumer discretionary companies, and financials have tended to underperform during the same periods, making sector rotation a key consideration for Australian investors navigating the US-Iran war escalation and ASX futures drop environment.
The information presented in this article is for educational and informational purposes only and does not constitute financial or investment advice. All prices and data referenced reflect conditions as of 24 July 2026. Readers should conduct independent research and consult a licensed financial adviser before making any investment decisions.
Want to Know Which ASX Mineral Discoveries Are Emerging Amid This Market Volatility?
When geopolitical shocks reshape commodity markets — pushing gold above $4,000 per ounce and crude past $100 per barrel — the companies making significant mineral discoveries can represent compelling opportunities for informed investors. Discovery Alert's proprietary Discovery IQ model delivers real-time alerts on significant ASX mineral discoveries, translating complex mineral data into actionable insights the moment announcements hit the exchange. Explore historic discovery returns on Discovery Alert's dedicated discoveries page and begin your 14-day free trial today to position yourself ahead of the broader market.