August 4, 2026
The ISM PMI Framework: A Real-Time Window Into Factory Sector Health
US manufacturing grows for 7th month in July ISM data — and when the Institute for Supply Management's monthly survey lands with a reading north of 55, it does not simply confirm that factories are busy. It signals something far more consequential: that the underlying architecture of industrial demand has shifted into a structurally different phase. Understanding why that distinction matters requires stepping back from the headline number and examining what the data's internal components reveal about the durability, breadth, and cost profile of the current US manufacturing expansion.
The ISM Manufacturing Purchasing Managers' Index is one of the most closely watched leading indicators in the global economic calendar. Published monthly by the Institute for Supply Management, it aggregates survey responses from purchasing and supply executives across dozens of US manufacturing industries into a single composite figure. Unlike GDP data, which arrives with a significant lag and undergoes multiple revisions, the PMI reflects forward-looking procurement behaviour and real-time operational conditions.
The headline figure is constructed from five equally weighted subindexes:
- New Orders (a measure of incoming demand)
- Production (actual output levels)
- Employment (workforce additions or reductions)
- Supplier Deliveries (a proxy for supply chain stress, where slower deliveries push the index higher)
- Inventories (stockpile levels held by manufacturers)
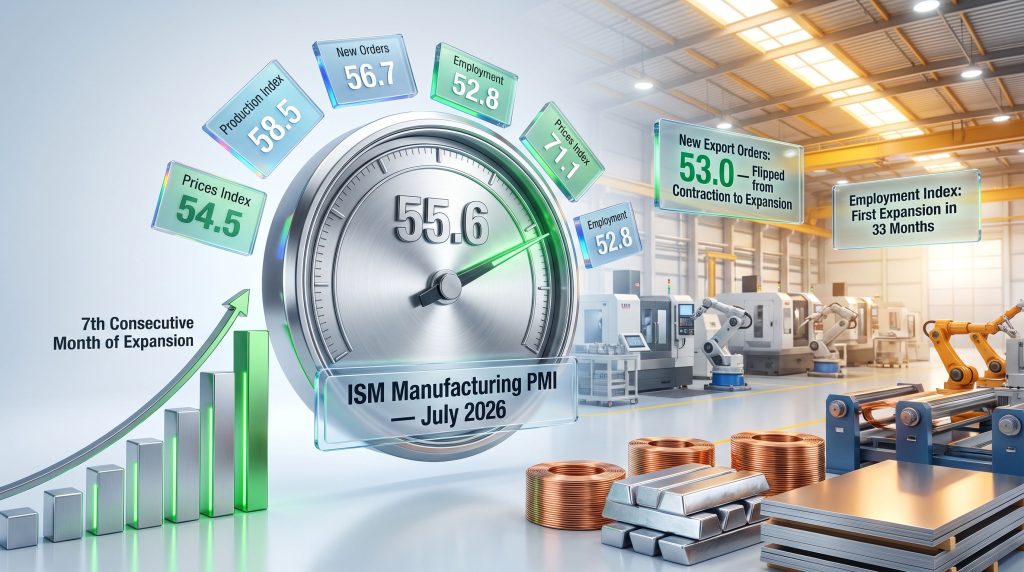
A composite reading above 50 confirms that the manufacturing sector expanded relative to the prior month. The higher the reading climbs above that threshold, the broader and more intense the growth. July 2026's print of 55.6 places the sector at its most energised point since May 2022.
This is not simply a directional signal. The magnitude of the reading above 50 has historically correlated with GDP growth trajectories, industrial capital expenditure cycles, and commodity demand patterns, making it an essential reference point for procurement professionals, commodity traders, and macroeconomic analysts alike.
When big ASX news breaks, our subscribers know first
How July 2026's 55.6 Reading Stacks Up Against Recent History
Context transforms a data point into intelligence. The July 2026 ISM reading does not exist in isolation; it sits at the apex of a seven-month expansion streak that has progressively gathered pace.
| Metric | July 2026 | June 2026 | Context |
|---|---|---|---|
| Headline PMI | 55.6 | 53.3 | Highest since May 2022 |
| Production Index | 58.5 | 52.2 | Highest since November 2021 |
| New Orders Index | 56.7 | 56.0 | 7th consecutive month of expansion |
| Employment Index | 52.8 | 49.7 | First expansion in 33 months |
| Prices Index | 71.1 | 73.0 | 22nd consecutive month above 50 |
| Inventories Index | 51.2 | 51.4 | Slowing growth |
| New Export Orders | 53.0 | 48.5 | Flipped from contraction to expansion |
The two-point jump from 53.3 to 55.6 in a single month is particularly instructive. An expansion that merely sustains itself month to month is encouraging. An expansion that accelerates suggests that new demand forces are arriving faster than existing capacity can absorb them. The July reading reflects the latter condition.
For comparison, the post-pandemic manufacturing surge of 2021 produced PMI readings in the high 50s and low 60s, supported by an extraordinary burst of pent-up consumer spending. The current expansion is distinct because it is being driven by structural demand anchors — namely defence procurement, domestic semiconductor-related capital equipment, and reshoring-linked industrial machinery orders — rather than a one-time inventory restocking cycle. Furthermore, according to the ISM's official PMI report, this marks one of the most sustained and broad-based expansions in recent memory.
The Subindex Story: Where Growth Is Actually Happening
Production at Multi-Year Highs
The production subindex's surge from 52.2 to 58.5 represents the most significant month-over-month acceleration within the report. This is the strongest output reading since November 2021 and marks the ninth consecutive month of production growth, a streak that indicates sustained rather than episodic manufacturing activity.
Production-side acceleration of this magnitude is typically driven by a combination of factors: growing order backlogs that require factories to run harder, improving labour availability that allows capacity to be utilised more fully, and capital equipment investments that expand throughput. Oxford Economics observed that the manufacturing sector had moved into a higher gear, with defence and semiconductor-related machinery identified as the leading contributors to that shift, with both sectors expected to continue anchoring growth through the remainder of the year.
New Orders and Export Demand Reinforce Each Other
The new orders index advanced modestly from 56.0 to 56.7, but the more significant development was in new export orders, which flipped decisively from contraction territory at 48.5 to expansion at 53.0. This inflection point matters because it suggests that international buyers are returning to US-manufactured goods at a meaningful pace.
However, it is worth noting that the US-China trade war impact on export order flows remains a key variable, as shifting bilateral trade conditions continue to influence procurement decisions across global supply chains.
Several forces can drive export order recoveries simultaneously:
- Currency competitiveness that makes US-manufactured goods more attractively priced in foreign markets
- Global inventory restocking cycles among trading partners whose own stockpiles have been drawn down
- Supply chain diversification strategies redirecting procurement away from other producing regions toward US suppliers
When domestic new orders and export orders both expand concurrently, it creates a dual-engine demand dynamic that is considerably more durable than single-channel growth.
The Employment Inflection: 33 Months of Contraction End
Perhaps the most structurally significant subindex movement in the July report is the employment index's shift from 49.7 to 52.8, breaking a contraction streak that stretched back approximately 33 months to around October 2023. For nearly three years, manufacturers collectively reduced headcount or held it flat, reflecting uncertainty about demand sustainability and a preference for productivity gains over workforce expansion.
The return to hiring territory signals a qualitative change in manufacturer confidence. Committing to new employees in capital-intensive industrial sectors involves meaningful fixed-cost obligations. When purchasing executives collectively report net hiring, it reflects an organisational judgement that incoming demand is durable enough to justify those commitments, not merely a temporary blip in order flows.
Geopolitical Risk as a Structural Cost Multiplier
Middle East Conflict and Its Freight Cascade
Active conflict in the Mideast Gulf region is exerting a persistent and compounding influence on US manufacturers' input cost structures. The disruption of key maritime corridors, including the Red Sea, the Strait of Hormuz, and the Suez Canal, forces cargo to be rerouted through alternative shipping lanes that add both distance and time to transit schedules. Survey responses from executives in the transportation equipment sector confirmed that these rerouting decisions translate directly into elevated freight costs and extended delivery windows for imported raw materials and components.
This dynamic is not a transitory logistics inconvenience. When supply chains absorb structural freight cost increases, those costs migrate into finished goods pricing and compress manufacturer margins unless they can be passed through to customers. In an environment where the prices index is already elevated, freight cost inflation acts as an amplifier rather than an isolated variable. Consequently, commodity tariff impacts are compounding this pressure further across the broader industrial landscape.
Commodity Prices: 22 Consecutive Months of Input Cost Expansion
The prices index registering 71.1 for the 22nd consecutive month above 50 is one of the most under-discussed elements of the current manufacturing cycle. A brief decline from 73.0 to 71.1 might superficially suggest easing pressure, but readings sustained above 70 indicate that input cost inflation has become a structural feature of the operating environment rather than a cyclical anomaly.
Commodities recording price increases in July 2026 included:
- Metals: Aluminium, copper, steel products, metal products
- Energy and Freight: Fuel, freight costs
- Industrial Inputs: Oil-based products, semiconductors, soybean meal
The presence of semiconductors on both the price-increase list and the demand-growth list is particularly revealing. It points to a supply-demand mismatch where domestic chip production capacity expansion timelines do not yet match the pace at which manufacturing demand for semiconductor-related components is growing. In addition, critical minerals demand tied to the energy transition is adding a further layer of structural pressure to input cost trajectories.
Bifurcated Inventory Behaviour: What Chemical Sector Responses Reveal
Inventory dynamics within the current cycle reflect an unusually polarised marketplace. The inventories index edged from 51.4 to 51.2, signalling decelerating stockpile growth. But the internal texture of inventory behaviour is more nuanced than the headline suggests.
Survey responses from chemical products sector executives described a marketplace characterised by simultaneous destocking and demand pull-forward, with some buyers deliberately reducing inventory exposure while others accelerate purchases in anticipation of future price increases or supply tightening. This bifurcated behaviour reflects genuine uncertainty about the trajectory of input costs and availability, and it creates asymmetric risk for procurement planning across the supply chain.
Sector Leadership and the Reshoring Dividend
Defence and Semiconductor Machinery as Structural Anchors
Defence manufacturing occupies a unique position in the current industrial cycle. Unlike consumer-facing industries whose fortunes track discretionary spending, defence procurement operates on multi-year budget authorisation cycles that are largely insulated from short-term economic volatility. This counter-cyclical characteristic makes defence-linked manufacturing activity a stabilising force within the broader PMI readings.
Semiconductor-related machinery demand functions as a structural tailwind tied to the ongoing buildout of domestic chip production infrastructure. As fabrication facilities commissioned in recent years move through construction toward operational phases, their demand for specialised manufacturing equipment translates directly into orders for US industrial machinery producers.
Industrial Machinery and the Reshoring Dynamic
The recovery in export orders coincides with a well-documented trend of supply chain localisation that has been redirecting capital equipment procurement toward domestic US sources. Manufacturers across automotive, aerospace, and electronics sectors have been investing in reshoring production capacity, and that investment creates sustained demand for industrial machinery, precision tooling, and advanced manufacturing systems.
This combination of domestic capital investment and recovering international export demand positions industrial machinery producers as among the most likely beneficiaries of sustained PMI strength through the second half of 2026.
Commodity Market Implications of a 55+ PMI Reading
Steel and Base Metals: Demand Signals From the Factory Floor
Historically, PMI readings above 55 correlate with measurable acceleration in demand for structural metals. Steel service centres, flat-rolled aluminium buyers, and copper wire rod consumers all track ISM data closely because production index strength typically precedes order volume increases by four to eight weeks as manufacturers translate confirmed orders into material procurement.
Mill utilisation rates, which had been running below optimal thresholds through much of 2023 and 2024, are now facing upward pressure from the convergence of strong domestic production requirements and recovering export order volumes.
Copper price growth drivers deserve specific attention as a leading indicator of manufacturing electrification trends. Capital equipment investment in advanced manufacturing — whether in semiconductor fabrication, defence electronics, or industrial automation — carries significant copper intensity, making copper consumption a useful proxy for the depth of the current manufacturing investment cycle.
The next major ASX story will hit our subscribers first
A Framework for Reading ISM Subindex Data Operationally
For procurement managers, supply chain directors, and industrial buyers, the ISM report is most valuable when its subindexes are read in combination rather than in isolation. The following step-by-step framework provides a structured approach:
- Assess headline PMI direction to determine whether the expansion is accelerating or moderating relative to the prior month.
- Examine the new orders-to-inventories ratio as a leading indicator of near-term production requirements and potential demand pull-through.
- Evaluate the employment subindex to determine whether manufacturers are adding capacity or conserving it.
- Monitor the prices index with sustained readings above 65 signalling margin compression and the need for contract renegotiation or commodity hedging strategies.
- Cross-reference export orders to assess whether international demand is providing incremental support beyond domestic consumption.
- Overlay geopolitical risk factors including freight cost trajectories and energy pricing in conflict-affected corridors that compound base commodity price movements.
Applying this multi-subindex lens to July 2026's data produces a clear picture: the expansion is real, it is broadening across demand channels, it is being supported by structural workforce commitment, and it is operating against a persistent and geopolitically amplified input cost backdrop that makes margin management the defining operational challenge of the current cycle.
Key Takeaways From Seven Consecutive Months of US Manufacturing Expansion
The data points that matter most from the July 2026 ISM report, and what they collectively signal, are outlined below. Furthermore, for broader historical context, reporting on US manufacturing activity highlights just how significant this sustained expansion streak has become relative to recent years.
- Headline PMI of 55.6 confirms the strongest factory growth reading since May 2022, with the expansion accelerating rather than plateauing
- Production index at 58.5 marks the highest output intensity since November 2021, anchored by defence, semiconductor machinery, and industrial equipment demand
- Employment returning to expansion after 33 months signals a fundamental shift in manufacturer confidence and a willingness to commit to fixed labour costs
- Export orders recovering from contraction to expansion opens a second demand channel alongside robust domestic consumption
- Prices index at 71.1 for the 22nd consecutive month confirms that input cost inflation is a structural feature of this cycle, not a transient condition
- Geopolitical risk tied to Middle East maritime disruptions continues to act as a cost multiplier across freight, energy, and commodity input categories, compounding underlying price pressures
US manufacturing grows for 7th month in July ISM data, and that sustained momentum — now reinforced by employment growth, accelerating production, and recovering export demand — represents a structurally significant shift that extends well beyond a single month's reading. However, the persistent elevation of the prices index at 71.1 serves as a reminder that expansion and margin pressure are not mutually exclusive conditions in the current industrial cycle.
Disclaimer: This article is intended for informational purposes only and does not constitute financial or investment advice. Forward-looking statements and economic forecasts referenced herein involve inherent uncertainty and should not be relied upon as predictions of future outcomes. Readers should conduct independent research and consult qualified advisors before making investment or procurement decisions.
Want to Capitalise on the Commodity Demand Signals Embedded in US Manufacturing Data?
When ISM PMI readings surge to multi-year highs and structural input cost pressures intensify across metals, semiconductors, and industrial materials, the window for identifying high-potential ASX mineral discoveries narrows quickly — Discovery Alert's proprietary Discovery IQ model delivers real-time alerts the moment significant discoveries are announced on the ASX, translating complex commodity demand dynamics into actionable investment opportunities. Explore historic discovery returns that demonstrate just how consequential early positioning can be, and begin a 14-day free trial at Discovery Alert to ensure you are positioned ahead of the broader market.