
July 21, 2026
Geopolitics at the Wellhead: Why Global Conflict Is Rewriting the U.S. Drilling Playbook
Energy markets have always operated at the intersection of geology, economics, and geopolitics, but rarely do all three forces converge with such force and speed as they have in mid-2026. When a critical maritime chokepoint controlling a substantial share of the world's seaborne crude supply becomes functionally inaccessible, the ripple effects extend far beyond tanker routes and spot price differentials. They reach into the sand and rock of West Texas, reshaping the investment calculus of every shale operator sitting on drilled-but-uncompleted wells and idle frac crews. Understanding what the U.S. oil rig count's largest weekly gain since 2022 actually signals requires looking well beyond the headline number itself.
When big ASX news breaks, our subscribers know first
The Baker Hughes Rig Count: What It Measures and Why Energy Markets Watch It Closely
Every Friday afternoon, energy traders, hedge fund managers, oil company executives, and government energy analysts converge around a single data release that has shaped upstream investment decisions for decades. The Baker Hughes weekly rig count, published without interruption since 1944, remains one of the most widely cited leading indicators in global commodity markets, functioning as a real-time pulse check on the willingness of operators to commit capital to new drilling programs.
Understanding the Rig Count as a Leading Indicator of Future U.S. Oil Production
The rig count's value as a forward-looking proxy lies in a fundamental production reality: oil does not flow from a decision to drill. It flows from a completed wellbore, perforated casing, hydraulic fracturing operations, gathering infrastructure connections, and separation equipment, all of which must be sequenced and executed before a single barrel reaches the surface. This sequence introduces a lag of roughly six to twelve months between an increase in active rigs and a measurable uplift in crude production volumes, making the weekly rig count one of the best early-warning systems available for anticipating supply changes well before they appear in production statistics.
When rig counts rise sharply, as they did during the post-COVID drilling rebound of 2021 and 2022, production analysts can begin modelling higher output scenarios for the following year with reasonable confidence. Conversely, prolonged rig count declines — such as those seen from late 2022 through mid-2025 — foreshadow eventual production plateaus or contractions regardless of how efficiently existing wells are being managed. The U.S. rig count decline over this period is a clear illustration of that dynamic.
How Baker Hughes Compiles Weekly Drilling Data and Why It Became the Industry Standard
Baker Hughes collects its rig count data through direct field surveys, tracking rigs physically rotating on drill pipe and actively engaged in either exploration or development drilling activity. Rigs that are moving between locations, undergoing maintenance, or stacked without active operations are excluded from the count, making it a measure of genuine real-time drilling engagement rather than total rig inventory.
The data's longevity and consistency across more than eight decades is a primary reason it became the de facto industry benchmark. Alternative tracking systems exist, but the Baker Hughes methodology's historical continuity enables direct comparisons across complete energy cycles, from the oil shocks of the 1970s through the shale revolution of the 2010s and into the geopolitically fractured landscape of the mid-2020s.
The Difference Between Oil-Directed, Gas-Directed, and Total Rig Counts
Not all rigs serve the same commodity. Baker Hughes segments its weekly count into oil-directed rigs, natural gas-directed rigs, and miscellaneous rigs, with the oil-directed figure receiving the most market attention given crude's dominant role in global energy pricing. This distinction matters enormously for interpreting weekly data, because simultaneous gains in oil rigs and declines in gas rigs can produce a relatively flat total count that obscures significant directional shifts occurring beneath the surface.
The current period offers a precise example of this dynamic: oil rig additions in West and South Texas are being partially offset by natural gas rig reductions elsewhere, meaning total rig count figures understate the genuine acceleration occurring in the crude-focused shale patch.
The weekly Baker Hughes rig count functions as one of the most closely watched forward-looking proxies for U.S. crude output. Rising rig numbers today typically translate into higher production volumes six to twelve months down the line, creating a structural preview of domestic supply that financial markets price into forward curves well in advance of actual barrels reaching the surface.
What the Latest Weekly Data Actually Shows
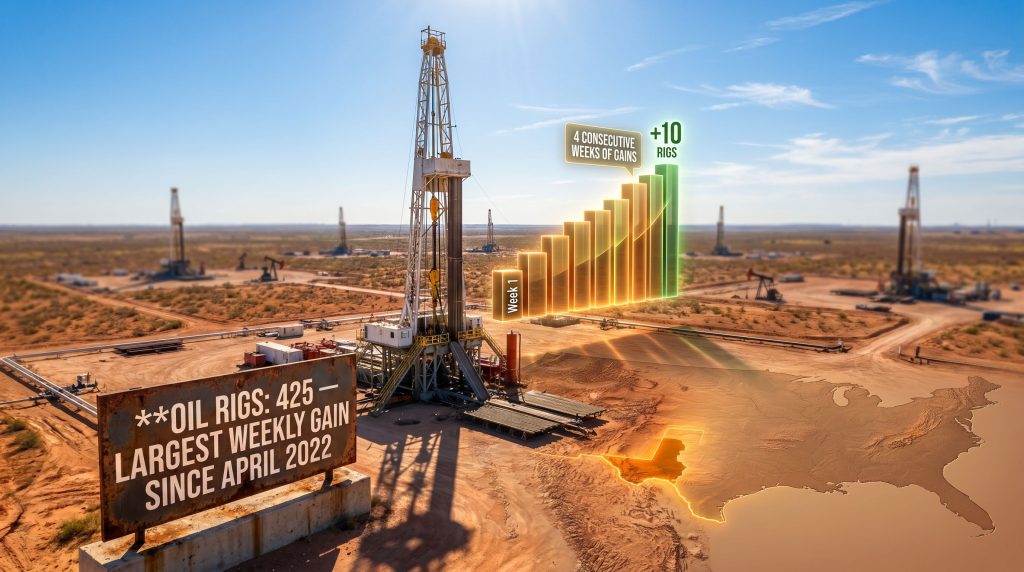
The numbers released on Friday, May 22, 2026, were not ambiguous. Oil-directed rigs rose by 10 in a single week, bringing the active count to 425, a figure confirmed by Baker Hughes and reported by Bloomberg. That single-week addition represents the U.S. oil rig count's largest weekly gain since April 2022, a milestone that immediately attracted attention across the upstream sector given the multi-year decline that had preceded it.
Breaking Down the Numbers: A 10-Rig Jump to 425 Oil Rigs
A gain of 10 rigs in a single week may appear modest in absolute terms, but its significance lies in both its velocity and its context. A move of this magnitude in a single reporting period signals coordinated operator decision-making across multiple basins and companies, suggesting the price environment has crossed a threshold at which capital deployment into new drilling programs becomes economically compelling across a broad range of cost structures — not just for the most efficient low-breakeven operators.
Four Consecutive Weeks of Gains: Is This a Trend Reversal or a Short-Term Spike?
The May 22 data point did not arrive in isolation. It represents the fourth consecutive week of rig count gains, a streak that begins to distinguish a genuine directional reversal from the type of single-week statistical noise that characterises normal weekly volatility in the series. Furthermore, four consecutive weeks of additions suggest operator behaviour is responding to a price signal perceived as durable rather than fleeting.
This aligns with analyst commentary suggesting shale producers may be treating the current oil price rally as structurally sustainable given the nature of its underlying driver. Crude oil price trends have become an increasingly important framework for contextualising these operator decisions.
| Metric | Current Reading (May 2026) | Prior Context |
|---|---|---|
| Oil Rigs Added (Weekly) | +10 | Largest single-week gain since April 2022 |
| Total Oil Rigs Active | 425 | Up from recent multi-year lows |
| Consecutive Weeks of Gains | 4 weeks | Sustained momentum signal |
| Permian Basin Contribution | Leading regional gainer | Primary U.S. shale engine |
| International Crude Price Change | +50% or more | Geopolitically-driven premium |
Geographic Concentration: Why West Texas and South Texas Are Leading the Recovery
Activity gains are concentrated in West and South Texas, the geographic heart of the Permian Basin and the Eagle Ford Shale respectively. These two regions collectively represent the most capital-efficient acreage in the U.S. shale sector, characterised by high initial production rates, multi-zone stacking potential, and well-developed infrastructure that reduces time-to-first-production.
Operators with acreage in these zones face lower per-barrel breakeven costs, meaning they respond to rising prices more quickly and confidently than operators in higher-cost formations. Critically, these gains are occurring against a backdrop of declining natural gas rig activity, which means the headline total rig count understates the true scale of the oil-focused resurgence underway.
How Did U.S. Drilling Activity Get Here? The Long Decline in Context
To properly evaluate the significance of the current rig count reacceleration, it is essential to understand the multi-year contraction that preceded it. The post-COVID drilling boom of 2021 and 2022 pushed total U.S. active rigs to approximately 750 by late 2022, a level that reflected both the extraordinary pace of demand recovery from pandemic-era lows and the capital reinvestment cycle that followed the near-collapse of the upstream sector in 2020.
From 750 Active Rigs in Late 2022 to 517 by October 2025: Mapping the Contraction
The subsequent three-year decline from that peak was both orderly and deliberate. By October 2025, total active rigs had contracted to approximately 517, reflecting a combination of moderating crude prices, investor pressure for capital discipline over growth, and the sector's continuing adaptation to the post-shale-revolution efficiency landscape.
This was not the kind of panicked rig collapse seen during the 2015–2016 oil price crash or the 2020 COVID shock; it was a methodical reduction driven by operators optimising returns rather than scrambling to survive. However, the scale of the contraction nonetheless set the stage for the sharp reversal now underway.
The Two Forces Behind the Multi-Year Rig Count Decline: Price Weakness and Efficiency Gains
Two distinct but complementary forces shaped this contraction:
- Moderating oil prices removed the economic justification for marginal drilling programs that required higher price decks to generate acceptable returns on capital.
- Drilling and completion efficiency improvements allowed operators to maintain or even grow production volumes from a smaller number of active rigs, fundamentally altering the relationship between rig count and output that had defined earlier decades.
The second force deserves particular emphasis because it represents a structural transformation in how the U.S. upstream sector operates, not merely a cyclical response to price movements.
How Improved Drilling Efficiency Allowed Operators to Maintain Output With Fewer Rigs
Modern U.S. shale operations bear little resemblance to the drilling programs of even a decade ago. Lateral lengths in the Permian Basin have extended from roughly 5,000 feet in the early 2010s to more than 15,000 feet in some recent programs, effectively tripling the reservoir contact surface of each wellbore without requiring an additional rig.
Simultaneous frac operations, advanced completion designs using higher proppant loadings, and data-driven well placement using 3D seismic and reservoir modelling have all contributed to per-well productivity gains that allow fewer rigs to move more rock. Consequently, the U.S. oil production outlook has remained more resilient than the rig count alone would suggest.
Even as rig counts fell sharply from their post-pandemic peaks, U.S. oil production remained surprisingly resilient, a direct result of operators drilling longer laterals, deploying advanced completions technology, and concentrating activity in the highest-productivity acreage. This efficiency premium means each new rig added to the count in 2026 carries more production potential per unit than its historical equivalent.
Comparing the 2022 Peak to Today's Recovery: A Statistical Snapshot
| Period | Total Active Rigs (Approx.) | Oil-Directed Rigs | Key Driver |
|---|---|---|---|
| December 2022 (Peak) | ~750 | Elevated | Post-COVID demand recovery |
| October 2025 | ~517 | ~397 | Capital discipline + efficiency |
| May 2026 (Latest) | Low-to-mid 500s | 425 | Geopolitical supply shock |
What Is Driving the Sudden Reacceleration in U.S. Drilling Activity?
The catalyst behind the current rig count surge is unusually clear-cut by the standards of energy market analysis, where multiple overlapping forces typically muddy causation. In this case, the Strait of Hormuz disruption stemming from the ongoing conflict in Iran has created a direct, sustained, and economically material price shock that shale operators can observe in real time on every crude price screen.
The Strait of Hormuz Disruption: How a Middle East Conflict Is Reshaping U.S. Shale Economics
The Strait of Hormuz has historically served as the most critical maritime energy corridor on earth, with a significant share of the world's seaborne oil shipments passing through its narrow waters. When that corridor becomes effectively inaccessible, the immediate effect on global oil supply is severe, as alternative routes are either unavailable, insufficient in capacity, or economically prohibitive for large-volume crude movements.
The resulting supply deficit commands a structural price premium that extends well beyond the typical short-duration spike associated with temporary geopolitical disruptions. This distinction is central to understanding operator behaviour. U.S. shale producers have learned, often painfully, to discount short-lived price spikes when making multi-year capital allocation decisions.
A 50%-Plus Surge in International Crude Prices: The Price Signal Operators Have Been Waiting For
International crude prices have risen by more than 50% since the Hormuz disruption intensified, according to reporting via Bloomberg and World Oil. This is not a modest incentive at the margin; it is a transformative repricing of the economic landscape for U.S. shale operators whose breakeven costs in the Permian Basin's highest-quality zones typically range between $40 and $60 per barrel on an all-in basis.
A 50%-plus price surge above pre-disruption levels moves virtually every producing formation in the U.S. shale sector into strongly economic territory and justifies reactivating idle capacity with urgency. In addition, the oil market trade-war impact on pricing dynamics has further complicated the planning environment for operators balancing near-term signals against longer-term uncertainty.
Unlike short-lived price spikes that operators typically discount in their capital planning, a prolonged disruption to a critical global chokepoint creates a fundamentally different investment calculus. Shale operators evaluating new drilling programs must now weigh not just current prices but the structural durability of the supply gap, and the scale of the Hormuz disruption argues for treating elevated prices as a base case rather than an upside scenario.
Why Shale Producers May Now View the Oil Price Rally as Structurally Sustainable
Bloomberg Intelligence analysis reported in World Oil suggests that shale operators may be interpreting the current rally as more enduring than typical geopolitical price spikes. This perception is critical because capital allocation in the upstream sector responds not to spot prices but to expected prices over the investment horizon of a drilling program.
If producers believe elevated prices will persist for 18 to 24 months, they will sanction programs that require that time horizon to generate returns. The four consecutive weeks of rig additions suggest the weight of operator opinion is tilting toward the structural sustainability thesis, at least for now.
The Offset Dynamic: Oil Rig Gains vs. Natural Gas Rig Declines
One analytically important wrinkle in the current data is that oil rig gains are partially offset by natural gas rig reductions occurring simultaneously. Natural gas prices have not benefited from the Hormuz disruption in the same way crude has, leaving gas-focused operators without equivalent incentive to expand activity.
This divergence between oil and gas drilling activity creates a situation where total rig count figures provide a misleading picture of directional momentum. Consequently, investors tracking only headline totals risk underestimating the scale of the oil-focused acceleration.
The Permian Basin's Outsized Role in the U.S. Rig Count Recovery
No geographic discussion of U.S. drilling trends can progress far without confronting the Permian Basin's dominance of the national data. Spanning West Texas and southeastern New Mexico, the Permian has been the engine of U.S. shale growth for more than a decade and remains so today.
Why the Permian Remains the Bellwether Basin for National Drilling Trends
The Permian's structural advantages over competing U.S. basins are substantial and durable:
- Multiple stacked pay zones within a single vertical drilling location, including the Spraberry, Wolfcamp, Bone Spring, and Dean formations, allow operators to generate multiple wells from a single surface pad.
- Extensive existing infrastructure, including pipelines, gas processing facilities, and crude gathering systems, reduces the time and capital required to bring new production online.
- Decades of geological data accumulation have enabled operators to drill with a precision that newer, less-characterised basins cannot match.
- The concentration of major operator acreage positions in the Permian means capital flows disproportionately to the basin when conditions improve.
West Texas vs. South Texas: Understanding the Regional Drilling Divergence
While the Permian Basin in West Texas leads the current recovery, South Texas — home to the Eagle Ford Shale — is also contributing meaningfully to the uptick in oil-directed activity. The Eagle Ford occupies a distinct competitive position as a lighter-oil, lower-complexity formation with somewhat different breakeven economics than the Permian's stacked-pay plays.
Its contribution alongside the Permian's suggests the current activity expansion is broad enough to engage multiple basin ecosystems rather than being narrowly concentrated in a single play type.
How Permian Efficiency Metrics Are Evolving Alongside Rising Activity
As activity picks up in the Permian, the basin's operational infrastructure is being stress-tested for the first time in several years. Oilfield service capacity — including available frac crews, pressure pumping equipment, and drilling rig supply chains — contracted during the multi-year activity reduction and may not expand instantaneously to meet rising demand.
This service capacity constraint represents both a practical bottleneck and a potential inflationary pressure on well-level economics as activity accelerates.
The next major ASX story will hit our subscribers first
What a Rising Rig Count Means for U.S. Oil Production Forecasts
The rig count data is only valuable as a forward indicator if it can be translated into credible production forecasts. Understanding how the current activity uptick propagates through the production system requires accounting for both temporal lags and the efficiency multiplier effect that modern shale technology introduces.
The Lag Effect: How Long Before New Rigs Translate Into Incremental Barrels?
The journey from rig mobilisation to first oil typically involves the following sequential steps:
- Rig mobilisation and pad construction (2 to 4 weeks)
- Drilling the vertical and lateral sections of the wellbore (2 to 6 weeks depending on depth and lateral length)
- Rig release and well preparation for completion (1 to 2 weeks)
- Hydraulic fracturing operations (1 to 3 weeks per well, depending on pad size)
- Flowback and cleanup (2 to 4 weeks)
- Pipeline connection and first production (variable, potentially 4 to 12 weeks depending on infrastructure availability)
Aggregating these steps across a typical Permian Basin horizontal well, first production can realistically be achieved within four to six months of initial rig mobilisation under favourable conditions, though the six-to-twelve month conventional estimate accounts for planning, permitting, scheduling, and completion crew availability across a portfolio of wells.
Production Efficiency as a Multiplier: More Rigs × Better Technology = Amplified Output Growth
Because today's rigs are operating with technology and techniques that are materially more productive than those used during the 2014–2016 drilling cycle, the production response to rising rig counts in 2026 will be amplified relative to historical norms. A rig operating with 15,000-foot laterals and advanced multi-stage completion designs generates substantially more production per dollar of capital than a rig drilling 5,000-foot laterals with conventional completion approaches.
This efficiency multiplier means the current 425-rig oil fleet, while materially below the 2022 peak, carries a production capacity that may rival or exceed what a significantly larger historical fleet could deliver.
Scenario Analysis: Three Possible Trajectories for U.S. Drilling Activity Through 2026
Scenario 1: Sustained Price Support
- Hormuz disruption persists through late 2026
- Crude prices maintain or extend the 50%-plus premium
- Rig count climbs toward 500 or more oil-directed units
- U.S. production growth accelerates meaningfully into late 2026 and early 2027
Scenario 2: Price Plateau and Cautious Stabilisation
- Crude prices hold elevated levels but do not continue rising
- Operators remain selectively capital-disciplined, avoiding aggressive over-commitment
- Rig count stabilises in the 425 to 460 range through the second half of 2026
- Production growth is real but moderate
Scenario 3: Conflict Resolution and Price Pullback
- Diplomatic resolution reopens the Strait of Hormuz
- Crude prices correct sharply as the geopolitical premium deflates
- Operators pause or reverse new rig deployments within eight to twelve weeks
- Partial reversal of the four-week gain streak occurs
Disclaimer: These scenarios are speculative projections based on publicly available information and should not be construed as investment advice or production forecasts. Energy markets are subject to rapid and unpredictable change.
How Does This Rig Count Surge Compare to Previous Drilling Cycles?
The U.S. oil rig count's largest weekly gain since 2022 invites direct comparison to the drilling environment that characterised the last comparable period of rapid activity expansion, as well as to longer historical cycles that shaped today's industry structure.
April 2022 vs. May 2026: What's Similar and What's Fundamentally Different
The April 2022 comparison point — which represents the last time a single weekly gain matched or exceeded the current +10 movement — occurred during the post-COVID demand recovery cycle when operators were rapidly reactivating capacity idled during 2020. The structural context today differs in important ways:
| Cycle | Primary Driver | Rig Count Trajectory | Operator Behaviour |
|---|---|---|---|
| 2020–2022 Recovery | Post-COVID demand rebound | Rapid ascent toward ~750 rigs | Aggressive reinvestment |
| 2022–2025 Contraction | Price normalisation + efficiency gains | Steady decline to ~517 rigs | Capital discipline prioritised |
| 2025–2026 Recovery | Geopolitical supply shock | Early-stage reacceleration | Selective, price-signal-driven |
Key Differences in Capital Discipline, Operator Consolidation, and Technology Between Cycles
The 2025–2026 recovery is emerging from a sector that has undergone significant consolidation since 2022. Major acquisitions including ExxonMobil's purchase of Pioneer Natural Resources and Chevron's acquisition of Hess have concentrated Permian acreage in the hands of operators with substantially stronger balance sheets, lower cost structures, and more sophisticated capital allocation frameworks.
This consolidation dynamic means the current rig count recovery is likely to be more measured and returns-focused than the 2020–2022 expansion, with larger operators less prone to chasing production growth at the expense of per-barrel economics. The result may be a slower but more structurally durable ramp-up than previous cycles delivered.
What Are the Broader Macro Implications of Rising U.S. Drilling Activity?
The domestic drilling numbers carry implications that extend well beyond U.S. borders, touching on global supply balances, OPEC+ strategy, and the energy security posture of America's allies.
U.S. Shale as a Geopolitical Counterweight to Middle East Supply Disruptions
The current episode provides one of the clearest demonstrations yet of U.S. shale's role as a swing supplier in global energy markets. Unlike conventional producers that require years-long development timelines to bring new supply to market, U.S. shale can respond to price signals within months, effectively functioning as a geopolitical buffer against supply shocks originating in politically unstable regions.
This responsiveness is itself a form of energy security infrastructure, providing consuming nations with confidence that extreme price spikes will trigger a supply response that moderates prices over a 12-to-18-month horizon.
How Increased Domestic Production Could Influence Global Oil Price Dynamics
If the current rig count acceleration translates into materially higher U.S. output through late 2026 and into 2027, the resulting supply addition could begin eroding the geopolitical price premium embedded in international crude even before the Hormuz situation is fully resolved. Historically, the prospect of rising U.S. supply has exerted a moderating influence on oil price rallies, with forward curves reflecting the anticipated supply response in advance of actual production increases. Furthermore, OPEC's market influence over global pricing adds another layer of complexity to how these supply additions will ultimately be absorbed.
The OPEC+ Response Question: Will Higher U.S. Output Trigger a Supply Strategy Shift?
OPEC+ has repeatedly demonstrated its willingness to adjust production targets in response to shifts in non-OPEC supply, particularly U.S. shale growth. A sustained rig count recovery that signals a credible U.S. production increase of several hundred thousand barrels per day could prompt OPEC+ to reassess its own output strategy.
The interaction between rising U.S. activity and OPEC+ strategic decisions will be one of the most consequential commodity market dynamics to monitor through the remainder of 2026.
Key Risks That Could Derail the U.S. Rig Count Recovery
No rig count analysis is complete without an honest assessment of the forces that could interrupt or reverse the current trajectory.
Risk 1: Rapid Conflict Resolution Collapsing the Price Premium
The most acute near-term risk is a faster-than-expected diplomatic resolution to the Middle East conflict that removes the Hormuz supply disruption. Crude prices would likely correct sharply on such a development, potentially eliminating the economic rationale for continued rig additions almost overnight. Operators who have sanctioned new drilling programs based on elevated price assumptions could find themselves with unfavourable economics before wells reach production.
Risk 2: Operator Capital Discipline Overriding the Price Signal
Institutional investor pressure for capital returns over production growth has been a defining feature of the U.S. shale sector since 2018. Even with oil prices at elevated levels, major operators may choose to return incremental cash to shareholders through buybacks and dividends rather than deploying it into new drilling programs, capping the rig count recovery well below what price signals alone would imply.
Risk 3: Supply Chain Constraints Limiting Rig Deployment Speed
The oilfield services sector contracted meaningfully during the 2022–2025 drilling reduction, with some equipment retired, crews dispersed, and manufacturing capacity reduced. Rapidly scaling activity in response to higher prices requires available frac spreads, drill bits, tubular goods, and skilled personnel — all of which have finite supply in the near term.
Bottlenecks in any of these areas can delay the translation of rig count gains into production growth and increase per-well costs in ways that reduce the economic attractiveness of the programs being sanctioned.
Risk 4: Regulatory and Permitting Headwinds in Key Shale Basins
Federal and state permitting processes, environmental review requirements, and potential regulatory changes affecting flaring, water disposal, and emissions management can introduce delays and cost increases that affect the pace of drilling activity. These considerations are particularly relevant for operators with significant federal acreage positions who depend on Bureau of Land Management permitting timelines.
Frequently Asked Questions: U.S. Oil Rig Count and Drilling Activity
What does the Baker Hughes rig count measure?
The Baker Hughes weekly rig count tracks the number of drilling rigs actively exploring for or developing oil and natural gas in the United States. Published every Friday, it is widely used as a forward-looking proxy for future domestic energy production, with rising counts typically preceding higher output by six to twelve months.
Why did the U.S. oil rig count post its largest weekly gain since 2022?
The single-week increase of 10 rigs, bringing the total oil rig count to 425 as of May 22, 2026, was primarily driven by a significant rise in international crude prices resulting from ongoing disruptions to the Strait of Hormuz caused by the conflict involving Iran. According to recent reporting on U.S. drillers, activity has been picking up across multiple basins as operators respond to this sustained price environment.
Which regions in the U.S. are seeing the most drilling activity?
West Texas and South Texas, anchored by the Permian Basin and Eagle Ford Shale respectively, are leading the current oil-directed drilling acceleration, whilst natural gas rig activity is declining in other parts of the country.
How long does it take for new rigs to impact U.S. oil production?
There is typically a lag of six to twelve months between an increase in active rig count and a measurable rise in crude output, as wells must be drilled, completed, and connected to infrastructure before production can begin.
Is the current rig count recovery sustainable?
Sustainability depends primarily on whether elevated crude prices persist. If shale operators believe the current price environment reflects a structural rather than temporary shift, capital deployment into new programs is likely to continue. The four-week streak of consecutive gains suggests operators are currently leaning toward that assessment.
How does today's rig count compare to historical highs?
Despite recent gains, the U.S. oil rig count at 425 remains materially below the post-pandemic peak of approximately 750 total active rigs recorded in late 2022, indicating significant spare capacity exists within the domestic drilling industry if economic conditions continue to improve.
Key Takeaways: What the U.S. Rig Count Surge Tells Us About the Energy Landscape in 2026
The U.S. oil rig count's largest weekly gain since 2022 is not a statistical anomaly or a temporary blip in an otherwise stagnant drilling market. It is the visible expression of a broad recalibration of upstream economics driven by one of the most consequential supply disruptions the global oil market has experienced in years.
Three Signals Investors and Energy Analysts Should Watch in the Coming Weeks
- Crude price trajectory: Whether the geopolitical premium embedded in oil prices holds, expands, or fades will determine whether the current rig count momentum continues to build or stalls. This is the single most important variable in the near-term outlook.
- Permian Basin weekly data: As the dominant U.S. shale engine, Permian rig additions or reductions will set the directional tone for national totals. Basin-level data from Baker Hughes, broken out weekly, provides the clearest signal of whether the recovery has genuine breadth.
- Operator guidance and capital budget revisions: Mid-year earnings calls and capital allocation updates from major U.S. producers will reveal whether the current activity uptick is being institutionally endorsed across the sector or treated as an opportunistic, short-duration response to temporary price conditions.
The largest single-week jump in U.S. oil rig activity since April 2022 reflects a genuine recalibration of drilling economics in response to a geopolitical supply shock of unusual magnitude. Whether this momentum compounds or fades will ultimately depend on the durability of the price signal and the strategic patience of U.S. shale operators navigating one of the most uncertain global energy environments of the past decade.
This article is intended for informational purposes only and does not constitute financial or investment advice. Forward-looking statements, scenarios, and production projections are speculative in nature and subject to material change based on evolving market, geopolitical, and operational conditions. Readers should conduct independent research before making any investment decisions.
Want to Stay Ahead of the Next Major Resource Discovery Driving Global Commodity Markets?
While geopolitical supply shocks reshape U.S. drilling economics, savvy investors are simultaneously watching ASX-listed exploration companies positioned to benefit from shifting commodity dynamics — and Discovery Alert's proprietary Discovery IQ model delivers real-time alerts the moment a significant mineral discovery hits the exchange, transforming complex geological data into actionable investment insights. Explore historic discoveries and their remarkable market returns, then begin a 14-day free trial at Discovery Alert to ensure you're positioned ahead of the market when the next major find is announced.