July 13, 2026
Reading the US Drilling Rig Count: What 558 Active Rigs Tell Us About the Future of American Oil
Every major shift in global energy supply begins not with a pipeline rupture or a political announcement, but with a quiet decision made thousands of feet underground. Before a single barrel of oil reaches a refinery, someone has to commit capital, deploy equipment, and put a drill bit into the earth. The US drilling rig count tracks exactly that commitment, and right now, it is telling a story that is more nuanced, more technically sophisticated, and more geopolitically charged than it first appears.
When big ASX news breaks, our subscribers know first
What the Baker Hughes Rig Count Actually Measures
Published every Friday afternoon, the Baker Hughes weekly rig count is one of the most closely tracked datasets in global commodity markets. It tallies the number of rotary drilling rigs actively boring wellbores across US oil and gas basins at any given moment. Energy analysts, commodity traders, institutional investors, and policymakers all treat it as a leading indicator of upstream capital deployment.
The critical distinction to understand is that the rig count measures intent to produce, not actual output. Because a newly drilled well typically takes weeks to months before it reaches first production, movements in the rig count today are effectively a forward-looking signal about supply conditions three to six months down the road. That lag is what gives the data its forecasting power.
When rig counts and frac spread counts rise simultaneously, the production response timeline compresses significantly, suggesting output gains can materialise within weeks rather than months.
Where the US Rig Count Stands Right Now
The Latest Baker Hughes Snapshot (Late May 2026)
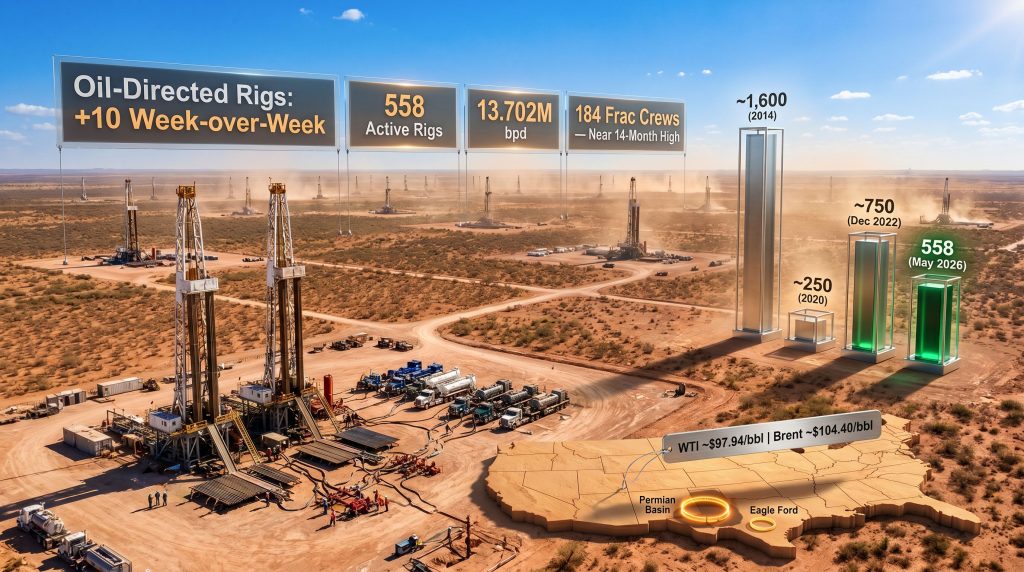
The most recent weekly Baker Hughes data places total active US drilling rigs at 558, a net addition of seven rigs week-over-week. Breaking that figure down by category reveals a divergence between oil and gas activity that carries meaningful implications for near-term supply dynamics.
| Rig Category | Current Count | Week-over-Week Change | Year-over-Year Change |
|---|---|---|---|
| Total Active Rigs | 558 | +7 | -8 |
| Oil-Directed Rigs | 425 | +10 | -30 |
| Gas-Directed Rigs | 125 | -3 | +17 |
| Miscellaneous Rigs | 8 | 0 | — |
The ten-rig addition in oil-directed activity represents the most significant single-week gain for that category in recent months. Gas rigs, by contrast, shed three units, reflecting softer Henry Hub economics relative to crude. Cross-referencing mid-April 2026 data, which showed 543 total rigs with 410 oil rigs and 125 gas rigs, the trajectory from mid-April to late May represents approximately 15 additional rigs over a five-week window — modest in absolute terms but directionally meaningful.
A Decade of Cyclicality: The Historical Context
To properly interpret the current US drilling rig count, it must be placed within the context of one of the most extreme boom-bust cycles in modern energy history. US drilling activity decline patterns over the past decade illustrate just how dramatically the industry has contracted and expanded in response to shifting economics.
| Period | Approximate Rig Count | Primary Driver |
|---|---|---|
| 2014 Peak (Shale Boom) | ~1,600+ rigs | WTI above $100/bbl; aggressive shale expansion |
| Mid-2020 Low (COVID Crash) | ~250 rigs | Demand collapse; WTI briefly turned negative |
| December 2022 Post-Pandemic High | ~750 rigs | Supply recovery; elevated commodity prices |
| October 2025 | ~517 rigs | Price moderation and efficiency-driven optimisation |
| May 2026 (Current) | 558 rigs | Oil price recovery; Hormuz supply disruption premium |
EIA data confirms the Lower 48 average fell from approximately 750 rigs in December 2022 to 517 rigs by October 2025, a contraction of roughly 31% over three years. The current recovery to 558 rigs represents only a partial reversal of that decline, and that restraint is deliberate.
Why Drillers Are Responding to High Prices, But Not Aggressively
The New Capital Discipline Framework
WTI crude is currently trading at approximately $97.94 per barrel, with Brent at $104.40 per barrel. In prior cycles, price levels approaching $100/bbl would have triggered a far more aggressive surge in drilling activity. Furthermore, the muted response reflects a structural transformation in how US exploration and production companies approach capital allocation. Tracking crude oil price trends helps contextualise why operators remain cautious despite historically elevated prices.
Three interconnected forces explain the restrained rig response:
-
Shareholder primacy over volume growth — Public E&P companies face sustained pressure from institutional investors to prioritise free cash flow generation, dividend payments, and share buybacks over raw production expansion.
-
Drilling efficiency improvements — Operators are consistently extracting more production per rig through extended lateral lengths, optimised completion designs, and data-driven well placement, meaning fewer rigs are needed to sustain the same output.
-
Physical supply chain constraints — Labour availability, frac sand logistics, and equipment procurement lead times create practical ceilings on how quickly the rig count can scale, regardless of price incentives.
The EIA has noted that production efficiency improvements have been a key structural reason why US output can be sustained at near-record levels with materially fewer rigs than in prior cycles. This is not a temporary anomaly. It is the new baseline.
Which Basins Are Leading the Recovery
Basin-Level Breakdown: Where the Drilling Action Is Concentrated
| Basin | Current Rig Count | Week-over-Week Change | Year-over-Year Change |
|---|---|---|---|
| Permian Basin (TX/NM) | 250 | +4 (second consecutive week) | -29 |
| Eagle Ford (TX) | 44 | +2 | +2 |
| Cana Woodford (OK) | — | +2 | — |
| Barnett (TX) | — | -1 | — |
| Haynesville (LA/TX) | — | -1 | — |
The Permian Basin: America's Upstream Engine
At 250 active rigs, Permian Basin activity commands roughly 45% of total US rig activity, an extraordinary concentration that reflects the basin's unmatched combination of geology and economics. Its stacked pay zones, meaning multiple productive formations accessible from a single wellbore trajectory, give Permian operators options unavailable in single-zone basins. Proximity to Gulf Coast export infrastructure further enhances well economics by reducing transport costs.
Despite consecutive weekly gains, the Permian remains 29 rigs below year-ago levels, a gap driven by two converging forces: major operator consolidation following a wave of mergers and acquisitions, and efficiency-driven rig reductions where individual rigs are now doing work that previously required two or three units.
Eagle Ford: A Quiet Reversal
The Eagle Ford's recovery to 44 rigs, now two above year-ago levels, marks a meaningful reversal after years of declining activity. Higher crude prices are rehabilitating the economics of acreage that was previously considered marginal, and the basin's proximity to Texas refining and export infrastructure provides a competitive logistics advantage. For investors tracking second-order beneficiaries of elevated oil prices, the Eagle Ford's revival is worth monitoring.
Gas Basin Softness
Both the Haynesville and Barnett formations each shed one rig, consistent with near-term natural gas price weakness. While long-term LNG export demand provides structural support for gas-directed drilling, elevated storage levels and softer Henry Hub pricing are creating near-term headwinds that operators are actively managing by redeploying capital toward oil targets.
The next major ASX story will hit our subscribers first
What Frac Spreads Reveal That Rig Counts Cannot
The Completion-Side Signal: Primary Vision Data
A subtle but important distinction separates the rig count from another closely watched indicator: the frac spread count. Where a drilling rig bores the wellbore, a hydraulic fracturing crew completes it, pumping fluid and proppant under pressure to crack the reservoir rock and unlock the hydrocarbons. The frac spread count, published weekly by Primary Vision, tracks how many of these completion crews are actively working.
As of the week ending May 15, the Primary Vision Frac Spread Count reached 184 active crews, the highest level since June of the prior year, with a week-over-week increase of five crews mirroring the acceleration seen in oil rig additions.
Why this convergence matters:
- Rising frac spreads signal that operators are not only drilling new wells but actively converting their inventory of drilled-but-uncompleted (DUC) wells into producing assets
- DUC well drawdowns represent a reservoir of near-term supply that can reach market faster than newly spudded wells, compressing the usual production lag
- When both rig counts and frac spread counts trend upward simultaneously, the production response arrives faster than historical lead times would suggest
The simultaneous rise in drilling and completion activity is arguably the most bullish near-term signal in the current US upstream dataset, suggesting production gains could materialise within weeks rather than the typical multi-month lag.
US Crude Production and the Efficiency Paradox
Getting More From Less: The Rig-to-Output Inversion
Perhaps the most structurally significant data point in the current US upstream landscape is this: weekly US crude oil production for the week ending May 15 averaged 13.702 million barrels per day, just 160,000 bpd below the all-time production record, according to EIA data. The broader US oil production outlook suggests this efficiency-driven plateau may be difficult to sustain without a meaningful rig count expansion. Notably, this is being achieved with a rig count roughly 25% below the December 2022 peak.
| Metric | 2022 Peak Period | Current Period (May 2026) |
|---|---|---|
| Active Rig Count | ~750 rigs | ~558 rigs |
| US Crude Production | ~12.0-12.5 million bpd | ~13.702 million bpd |
| Implied Output per Rig | Lower | Significantly Higher |
This inverse relationship represents one of the most consequential structural shifts in US upstream history. The key efficiency drivers reshaping this relationship include:
- Extended lateral lengths exceeding 15,000 feet, contacting significantly more reservoir rock per well than earlier generation drilling programs
- Pad drilling techniques, where multiple wells are drilled from a single surface location, reducing rig mobilisation time and shared infrastructure costs
- Real-time downhole telemetry and AI-assisted drilling optimisation that reduce non-productive time and improve wellbore placement accuracy
- Enhanced completion designs using higher proppant volumes and precision-engineered perforation clusters to maximise initial production rates
The implications for OPEC+ strategy are profound. If the US can sustain or grow production with fewer rigs, the traditional assumption that high oil prices will automatically trigger a US supply response large enough to rebalance global markets no longer holds in the same way.
The Geopolitical Dimension: Hormuz and the Price Floor
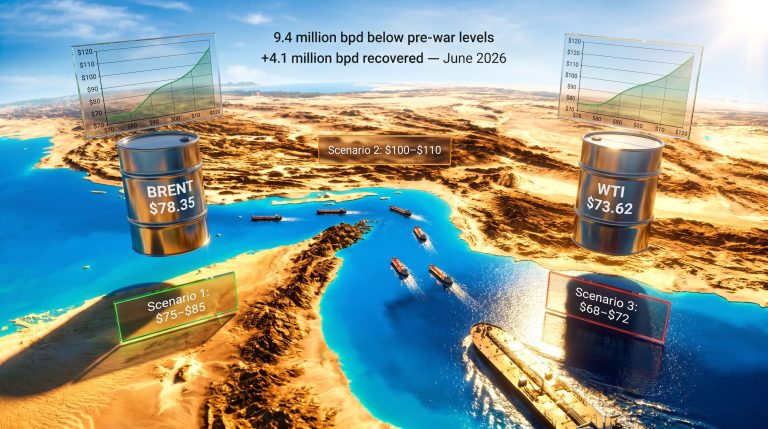
Oil prices are currently elevated partly because market participants are pricing in a sustained geopolitical risk premium tied to supply disruption concerns around the Strait of Hormuz. The oil market geopolitical risks stemming from Hormuz transit uncertainty have consequently become one of the most consequential variables shaping US upstream investment decisions. Industry participants have indicated that the effects of supply disruptions are expected to persist beyond any resolution of Hormuz transit restrictions, a view that is supporting Brent crude above $100/bbl and providing a meaningful economic floor for marginal well development.
Scenario Analysis: How Oil Prices Shape the Rig Count Outlook
| Price Scenario | Likely Rig Count Trajectory (6-Month Outlook) |
|---|---|
| WTI sustains above $95/bbl | Gradual increase toward 580-620 rigs |
| WTI retreats to $75-85/bbl | Stabilisation or modest decline toward 520-540 rigs |
| WTI drops below $70/bbl | Accelerated rig reductions; operators revert to defensive capital discipline |
Disclaimer: Price scenario projections are illustrative and speculative. Actual rig count trajectories depend on a wide range of variables including operator-level decisions, supply chain capacity, financial market conditions, and geopolitical developments. This is not financial advice.
Frequently Asked Questions: US Drilling Rig Count
What is the current US rig count?
As of late May 2026, the total active US drilling rig count stands at 558 rigs, comprising 425 oil-directed rigs, 125 gas-directed rigs, and 8 miscellaneous rigs, per Baker Hughes weekly data.
Who publishes the US rig count?
Baker Hughes publishes the weekly US rig count every Friday. The EIA also tracks and publishes related rig activity and production data at eia.gov.
What was the highest US rig count ever recorded?
The US rig count reached its modern-era peak of approximately 1,600+ rigs in 2014 during the height of the shale drilling boom, when WTI crude was trading above $100 per barrel.
Why is the rig count lower now than in 2022 despite high oil prices?
A combination of investor-driven capital discipline, improved drilling efficiency, and operator consolidation has structurally reduced the number of rigs required to sustain production. Operators are prioritising shareholder returns over volume growth, and per-rig output has risen substantially.
What is the difference between a rig count and a frac spread count?
A rig count measures active drilling operations. A frac spread count measures active hydraulic fracturing crews completing wells. Both are leading indicators of future production, but frac spreads have a shorter lead time to first output, making them a more immediate precursor to production additions.
Key Takeaways for Energy Market Watchers
- The US drilling rig count recovery to 558 total rigs reflects a measured, price-responsive expansion of upstream activity, not an exuberant production land grab
- Oil-directed rigs are leading the recovery while gas rigs soften amid near-term natural gas price weakness
- The Permian Basin at 250 rigs accounts for roughly 45% of national activity, with the Eagle Ford showing renewed momentum as a secondary beneficiary of elevated crude prices
- Frac spread counts at a near-14-month high of 184 suggest completion-side activity is accelerating, compressing the usual production response lag
- US crude production at 13.702 million bpd is just 160,000 bpd from an all-time record, achieved with far fewer rigs than the 2022 peak, demonstrating that efficiency gains have fundamentally altered the rig-to-output relationship
- Geopolitical risk around Hormuz transit is providing a sustained price floor that supports continued, if gradual, rig count expansion
For ongoing reference, readers can track weekly US drilling rig count updates and upstream production data through the US Energy Information Administration, Baker Hughes weekly releases, and OilPrice.com's live rig count tracker.
Want to Capitalise on the Next Major Resource Discovery Before the Broader Market Reacts?
While US drilling trends shape global commodity dynamics, Discovery Alert's proprietary Discovery IQ model scans ASX announcements in real time, instantly identifying significant mineral discoveries and delivering actionable alerts to subscribers ahead of the market — just as historic discoveries like those from De Grey Mining and WA1 Resources demonstrated the transformative returns that early positioning can generate. Begin your 14-day free trial at Discovery Alert today and position yourself at the forefront of the next major ASX mineral discovery.