
July 21, 2026
The Rig Count Paradox: More Drilling, Smarter Output, Tighter Margins
Across the long arc of American energy history, few relationships have been as closely watched, misread, or misunderstood as the connection between drilling activity and crude oil production. For decades, the assumption was straightforward: more rigs meant more oil, fewer rigs meant less. That linear logic has been systematically dismantled over the past decade, and the data emerging from mid-2026 offers one of the clearest illustrations yet of how profoundly the US upstream sector has been transformed.
Understanding where drilling stands today requires looking beyond the headline number. The US oil and gas rig count, as measured and published weekly by Baker Hughes every Friday at noon US Central Time, is not a real-time measure of output. It is a forward-looking signal, a census of active drilling rigs that tells analysts where production is likely to be heading six to twelve months from now, not where it sits today. That distinction matters enormously when interpreting what the latest data is communicating.
When big ASX news breaks, our subscribers know first
What the Baker Hughes Rig Count Actually Measures
Baker Hughes has tracked active drilling rigs across American hydrocarbon basins continuously since 1944, making this one of the longest-running datasets in the global energy industry. Each week, the count captures rigs that are actively drilling, excluding those that are stacked, idle, or undergoing maintenance. The dataset is broken into three main categories: oil-directed rigs, gas-directed rigs, and miscellaneous rigs, each tracking a distinct segment of upstream capital deployment.
The classification of a rig as oil-directed or gas-directed is based on the operator's stated primary target, not necessarily the composition of what ultimately comes out of the ground. This is an important nuance because many wells in liquids-rich formations produce associated natural gas alongside crude oil, meaning gas output can grow even in periods when gas-directed rig counts are declining. The Baker Hughes methodology captures intent, not outcome.
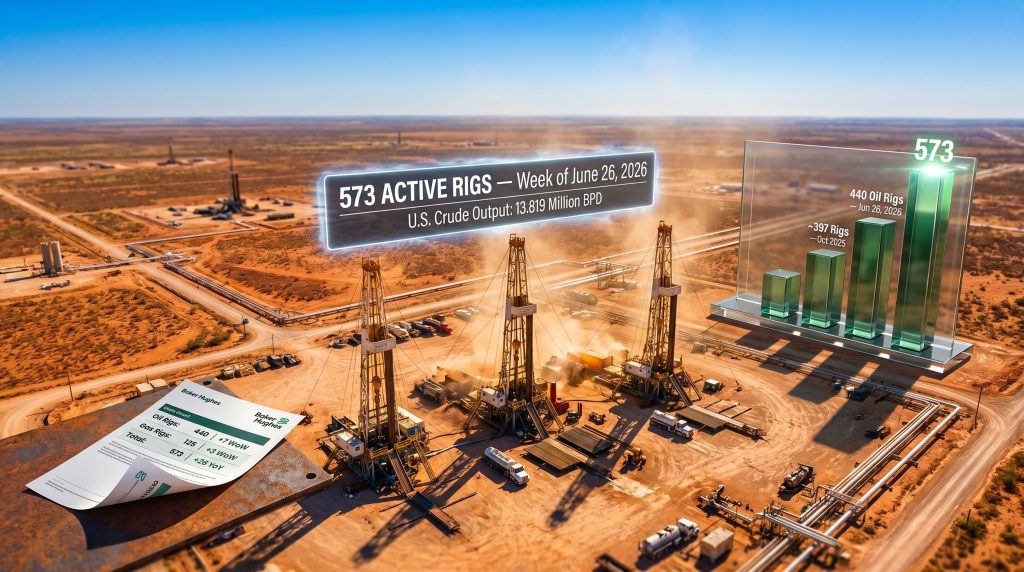
Current US Oil and Gas Rig Count: Week of June 26, 2026
The latest Baker Hughes data, released on Friday, June 26, 2026, confirmed a meaningful uptick across all major rig categories. The total US oil and gas rig count reached 573 active rigs, representing a gain of 26 rigs compared to the same period one year earlier, according to Baker Hughes weekly data.
| Rig Category | Count (Week of Jun 26, 2026) | Week-on-Week Change | Year-on-Year Change |
|---|---|---|---|
| Oil Rigs | 440 | +7 | +8 |
| Gas Rigs | 125 | +3 | +16 |
| Miscellaneous Rigs | 8 | Unchanged | — |
| Total Active Rigs | 573 | +10 | +26 |
The week-on-week acceleration in oil-directed activity is particularly noteworthy. Oil rigs climbed from 433 during the week of June 19 to 440 by June 26, a gain of seven units representing approximately a 1.6% sequential increase. For context, the oil rig count had been relatively static through mid-June, holding at 433 for the week ending June 19 after a period of flat activity around the June 12 count of approximately 562 total rigs.
The jump to 440 oil rigs in a single week marks one of the sharper single-period moves observed in recent months. Furthermore, the US rig count decline observed through much of 2024 and early 2025 makes this recovery all the more significant for market observers tracking upstream momentum.
Gas-directed drilling also gained momentum, with the gas rig count rising by three to reach 125. Year-on-year, gas rigs are running 16 units above the prior year's comparable period, a trend that reflects the sustained commercial pull of LNG export demand from the Gulf Coast.
Why Drillers Are Adding Rigs Despite Falling Oil Prices
The timing of this rig count expansion creates an analytical tension that is worth examining carefully. On the same day Baker Hughes reported rising drilling activity, both WTI and Brent crude were trading sharply lower. WTI crude was changing hands near $69.43 per barrel, while Brent had declined to approximately $71.90 per barrel, a week-on-week loss of roughly $15 per barrel for the international benchmark.
That kind of price drop, in a single week, would historically have triggered caution among upstream operators. However, the explanation lies in the fundamental mismatch between how crude oil price trends move and how drilling decisions are actually made.
Upstream capital allocation is not a reactive process tied to weekly spot prices. Operators commit drilling budgets months, sometimes quarters, in advance, based on hedged price assumptions that often bear little resemblance to where crude is trading on any given Friday. Well before a rig is mobilised, operators have typically locked in a significant portion of their forward production through futures contracts and options strategies that protect cash flows at predetermined price floors.
Beyond hedging, long-cycle project commitments and rig contract obligations create a structural inertia in drilling programmes. Once a rig contract is signed, the cost of releasing the rig early can exceed the cost of continuing to drill, particularly for shorter-term contracts in competitive basin markets. Consequently, a sharp spot price decline in late June 2026 would be unlikely to materially change the rig count until well into the third quarter, if at all.
The Geopolitical Backdrop: Hormuz, Risk Premiums, and the US Drilling Response
The broader context for late June 2026 drilling activity includes the resolution of the Strait of Hormuz disruption that had shaped oil market dynamics through much of the month. The Hormuz crisis, which temporarily impaired crude transit through one of the world's most critical chokepoints, had inserted a meaningful supply-risk premium into global oil prices. As tanker traffic through the strait began recovering, that geopolitical premium began unwinding, contributing directly to the sharp week-on-week price decline observed.
The paradox is instructive for investors. US drillers were adding rigs at precisely the moment that Hormuz-related risk premiums were being stripped out of the oil price. This simultaneous occurrence underscores a key dynamic in upstream capital behaviour: geopolitical volatility in Persian Gulf supply corridors historically strengthens the long-term investment case for domestic US production, reinforcing energy security arguments that carry weight in multi-year capital planning cycles, even when near-term prices are moving in the opposite direction.
Basin-Level Activity: Where US Drilling Is Concentrated
Permian Basin: Efficiency Over Volume
The Permian Basin of West Texas and southeastern New Mexico remains the undisputed centre of American upstream activity. As of the week ending June 26, 2026, the Permian hosted 258 active drilling rigs, an increase of two from the prior week, and the highest concentration of any single US basin by a wide margin.
Yet the Permian's current count sits 12 rigs below year-ago levels, a deficit that might seem concerning on the surface but actually tells a more nuanced story. The basin's operator landscape has been reshaped by a wave of major mergers and acquisitions activity since 2023, which has placed more acreage under the control of larger, better-capitalised operators. These companies tend to optimise for capital efficiency rather than raw rig count growth, leveraging technology to extract more from fewer wells.
A lower Permian rig count does not translate directly to lower output. Extended lateral lengths, now regularly exceeding 15,000 feet in the most productive Permian sub-plays, combined with pad drilling efficiencies and AI-assisted subsurface modelling, have dramatically improved the output per rig deployed. Fewer rigs, strategically placed and better equipped, can sustain or even grow production volumes that would have required significantly more drilling capacity a decade ago.
Eagle Ford: Steady and Predictable
The Eagle Ford Shale of South Texas held its rig count steady at 44 active rigs during the week of June 26, unchanged from the prior period. Year-on-year, the Eagle Ford is running three rigs above the comparable 2025 level, signalling stable operator commitment to this mature but consistently productive basin.
Unlike the Permian, which offers substantial upside for growth-oriented operators, the Eagle Ford has matured into a cash-flow-generation play. Operators with established infrastructure across the South Texas formation benefit from lower incremental well costs and faster cycle times, making the basin an efficient contributor to portfolio-level production targets without requiring aggressive rig additions.
Gas-Directed Basins: The LNG Demand Tailwind
The 16-rig year-on-year increase in gas-directed drilling reflects broader structural demand forces. Haynesville Shale in Louisiana and East Texas has been a primary beneficiary of the expanding US LNG export infrastructure along the Gulf Coast. As terminal capacity has grown and long-term supply contracts with international buyers have been signed, producers with acreage in gas-focused basins have responded accordingly. The Marcellus and Utica formations of the Northeast have similarly benefited, though logistical constraints on takeaway capacity remain a consideration for operators in those regions.
US Crude Production: The Output Story Behind the Rig Count
The most important context for interpreting the mid-2026 US oil and gas rig count is the production data sitting alongside it. According to the US Energy Information Administration, crude oil output for the week ending June 19, 2026 averaged 13.819 million barrels per day (bpd), up from 13.806 million bpd the prior week and running 384,000 bpd above the comparable period in 2025.
These production figures tell a story that the rig count alone cannot fully convey. In addition, US oil production trends suggest this efficiency-driven growth is likely to continue. Consider the following comparison across the recent history of US upstream activity:
| Metric | 2022 Peak | October 2025 | June 2026 |
|---|---|---|---|
| Oil Rig Count | ~620+ | ~397 | 440 |
| US Crude Output (approx.) | ~12.0 mbpd | ~13.4 mbpd | ~13.8 mbpd |
| Implied Rig Productivity | Baseline | Significantly Higher | Highest on Record |
The oil-directed rig count declined approximately 33% from its December 2022 peak to a trough of around 397 rigs in October 2025. Over that same period, US crude production continued climbing. This divergence between rig deployment and production volume is arguably the defining operational story of American shale from 2023 through 2026 and represents a structural shift that reshapes how investors should interpret every weekly Baker Hughes release.
The technological drivers behind this efficiency revolution include:
- Extended lateral well lengths, now routinely exceeding 15,000 feet in premier Permian locations compared to 5,000 to 7,000 feet common in the early shale era
- Pad drilling, where multiple wells are drilled from a single surface location, dramatically reducing the time and cost between individual wellbores
- AI-assisted subsurface modelling that improves target precision and reduces the proportion of wells that underperform geological expectations
- Faster drill times, with modern rigs completing well sections in days that previously required weeks
The next major ASX story will hit our subscribers first
Frac Spread Count: The Completion Metric That Complements the Rig Count
The rig count measures drilling activity, but it does not capture the critical final step that transforms a drilled wellbore into a producing asset. That is the role of the frac spread count, tracked by Primary Vision, which measures the number of hydraulic fracturing crews actively completing wells at any given time.
As of the week ending June 19, 2026, the Primary Vision Frac Spread Count held steady at 192 active crews. This figure carries significant interpretive weight alongside the rising rig count. When drilling activity accelerates but completion crew numbers remain flat, the natural consequence is a build in the drilled-but-uncompleted, or DUC, well inventory.
Drilled wells accumulate faster than crews are available to hydraulically fracture and complete them, creating a reservoir of future production that can be drawn down when economics improve. The flat frac spread count at 192 suggests that near-term production additions are proceeding at a measured pace, consistent with the observed output plateau near 13.8 million bpd.
A Decade of US Drilling History: The Structural Transformation
Placing the current 573-rig total in its historical context reveals how completely the US upstream sector has been re-engineered:
- 2011 to 2014 shale boom era: Total rig counts regularly exceeded 1,800 active units as operators prioritised acreage capture and production growth, often without regard for capital returns
- 2015 to 2016 price collapse: Rig counts fell below 400, a level that would have implied catastrophic production decline under conventional expectations but instead demonstrated the growing resilience of shale economics
- 2020 COVID trough: Total US rigs briefly collapsed below 250 units, the lowest level in recorded history, before an aggressive recovery began in 2021
- 2021 to 2023 recovery arc: A sharp rebound to over 750 total rigs followed the price recovery, before efficiency gains allowed operators to sustain growth at progressively lower rig counts
- 2024 to 2026 consolidation phase: Rig counts have stabilised in the 550 to 580 range as the industry operates under sustained institutional investor pressure for capital discipline, prioritising returns over growth
The 573 rigs active in late June 2026 are delivering production volumes that would have required more than 900 rigs under the drilling technology standards of 2014. This is not a marginal improvement. It represents a fundamental restructuring of the capital intensity model for American oil production.
What Rising Rig Counts Signal for Markets and Investors
How the Baker Hughes Data Moves Markets
The weekly Baker Hughes release is a legitimate market-moving event. Traders, analysts, and OPEC+ policymakers monitor the data because it functions as a leading indicator of US supply trajectory roughly six to twelve months into the future. OPEC's market influence on global price formation means that the cartel's decisions on output quotas are partly calibrated around expectations for American supply growth.
The asymmetric market interpretation is worth understanding: a rig count increase in a falling price environment is frequently read as a bearish signal, because it implies that US supply growth is resilient even when margins are being compressed. This can reinforce downward price pressure by signalling that American production is less price-sensitive than markets had assumed. Furthermore, this means the Baker Hughes dataset effectively has a two-way influence on global oil markets, informing both price formation and the policy responses that shape supply.
Investment Implications
For investors tracking the US upstream energy sector, the rig count expansion carries several layered implications:
- Oilfield services companies including drilling contractors, pressure pumping providers, and specialised technology firms are the most direct short-term beneficiaries of rising rig counts, as their revenue is tied to utilisation rates
- Exploration and production companies with low breakeven costs, particularly Permian-focused operators, are better positioned to maintain drilling programmes during price softness than higher-cost producers in less productive formations
- The rig count-to-production ratio has emerged as a critical efficiency metric for institutional investors assessing capital intensity trends across the sector. A sector that can grow output with a declining rig count is structurally more attractive from a return-on-capital perspective
- Gas-directed drilling growth benefits midstream operators with exposure to LNG export demand volumes, as sustained Haynesville and Marcellus activity supports long-term throughput commitments
Disclaimer: This article is intended for informational and educational purposes only and does not constitute financial or investment advice. Energy market forecasts, rig count projections, and production estimates carry inherent uncertainty and should not be relied upon as the basis for investment decisions. Readers should conduct independent research and consult qualified financial advisors before making investment decisions.
Frequently Asked Questions: US Oil and Gas Rig Count
What is the current US oil and gas rig count?
As of the week ending June 26, 2026, the total US oil and gas rig count stands at 573 active rigs, comprising 440 oil rigs, 125 gas rigs, and 8 miscellaneous rigs, according to Baker Hughes weekly data.
Who publishes the US rig count and how often?
Baker Hughes publishes the US rig count every Friday at noon US Central Time. The dataset has been maintained continuously since 1944, making it one of the most enduring market tracking tools in the global energy industry.
What does a rising rig count mean for oil production?
A rising rig count generally signals that operators anticipate production growth over the following six to twelve months. However, dramatic improvements in drilling efficiency since 2015 have broken the previously linear relationship. Fewer rigs today routinely deliver more production than equivalent numbers did a decade ago.
What is the Permian Basin rig count right now?
The Permian Basin hosted 258 active drilling rigs as of the week ending June 26, 2026, the highest concentration of any US basin, though this figure remains 12 rigs below year-ago levels.
What is the difference between the rig count and the frac spread count?
The rig count measures active drilling of new wellbores. The frac spread count, published by Primary Vision, tracks how many hydraulic fracturing crews are completing drilled wells. Both metrics together provide a more complete picture of upstream activity and near-term production trajectory.
Why did the rig count rise even as oil prices fell in late June 2026?
Drilling decisions are typically finalised weeks or months in advance, anchored to hedged price assumptions and multi-year capital plans rather than weekly spot market movements. The simultaneous occurrence of a rig count increase and a sharp price decline during the week of June 26, 2026 is a textbook illustration of the lagged nature of upstream capital deployment.
Want to Know Which ASX Discoveries Could Deliver the Next Major Return?
While the US upstream sector navigates the complex relationship between rig counts, efficiency, and commodity prices, Discovery Alert's proprietary Discovery IQ model cuts through the noise for ASX investors — delivering real-time alerts the moment significant mineral discoveries are announced, so subscribers can act ahead of the broader market. Explore historic discovery returns on Discovery Alert's dedicated discoveries page and begin your 14-day free trial today to secure a market-leading edge.