July 8, 2026
How Geopolitical Risk Becomes an Economic Shock: The Transmission Mechanism Investors Must Understand
Every few years, a single stretch of water reminds global financial markets just how fragile the modern energy architecture truly is. The mechanics of how a regional military confrontation transforms into a broad equity selloff are not accidental — they follow a predictable transmission pathway that runs from physical geography through commodity pricing, into inflation expectations, and finally into the valuations of every risk asset on the planet.
Understanding this chain is far more valuable to investors than reacting to any individual headline. The question of why is the US stock market down today oil surges on Iran tensions cannot be answered with a single sentence. It requires examining the full transmission mechanism from the ground up.
The Strait of Hormuz: Why One Waterway Can Move Global Markets
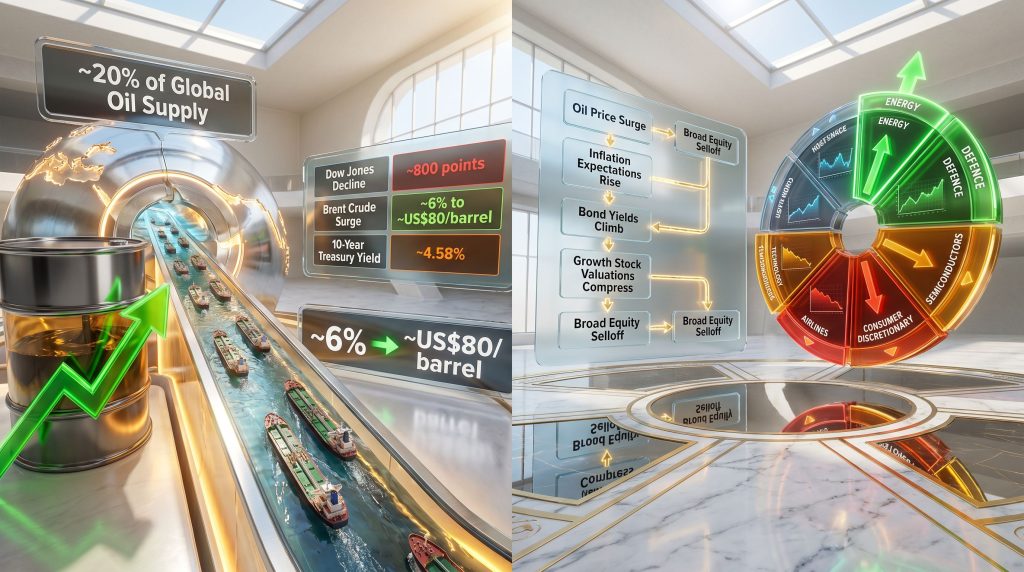
The Strait of Hormuz is a narrow maritime corridor running between the southern coast of Iran and the northern tip of Oman. At its narrowest point it measures roughly 33 kilometres across, yet this sliver of water carries approximately 20% of the world's daily crude oil supply — making it arguably the single most consequential geographic chokepoint in the global economy.
To put this in context, consider how the major global oil transit routes compare:
| Chokepoint | % of Global Oil Transit | Primary Risk Scenario |
|---|---|---|
| Strait of Hormuz | ~20% | US-Iran military escalation |
| Strait of Malacca | ~16% | Piracy and territorial disputes |
| Suez Canal | ~12% | Regional conflict spillover |
| Bab-el-Mandeb | ~9% | Proxy conflict and Houthi activity |
What makes the Strait of Hormuz uniquely dangerous from a market perspective is the combination of its volume significance and the political reality that Iran controls the northern shoreline. This is not a passive geographic constraint — it is an actively contested geopolitical pressure point that Iran has previously threatened to close, and has partially disrupted through proxy actions and direct naval harassment of commercial shipping.
The financial concept that emerges from this dynamic is the geopolitical risk premium — a component of the crude oil price that reflects not current supply disruption but the probability of future disruption. When that probability rises sharply, markets reprice crude futures within hours, not days. Furthermore, the geopolitical risks in mining and broader commodities sectors face similar repricing pressures whenever this corridor is threatened.
From Regional Conflict to Global Price Signal: How Oil Markets Reprice Risk in Real Time
Crude oil futures markets operate continuously across time zones, and they respond to geopolitical signals with a speed that equity markets rarely match. When a credible escalation event occurs near the Strait of Hormuz, the repricing mechanism activates through several channels simultaneously:
- Speculative positioning shifts as algorithmic traders and commodity funds rapidly increase long exposure to front-month crude contracts
- Options markets see a surge in call buying at strike prices well above the spot price, reflecting traders paying to hedge against a severe supply shock
- Physical market participants — refiners and importers — begin bidding more aggressively for near-term cargoes as a precaution against potential route disruption
The result of this simultaneous activity is a price spike that occurs before any barrel of oil is actually withheld from the market. In the current episode, Brent crude surged approximately 6% toward US$80 per barrel following the breakdown of ceasefire negotiations and the US revocation of Iran's oil export licence. For context, comparable historical escalations near the Strait have pushed Brent above US$107 per barrel, and WTI crude has exceeded US$101 per barrel in severe supply shock scenarios.
Key Insight: Oil markets do not wait for supply disruptions to actually occur — they price in the probability of disruption. A credible military escalation near the Strait of Hormuz is sufficient to trigger a 5–7% crude price move within a single trading session.
When big ASX news breaks, our subscribers know first
Why the US Stock Market Is Down Today: Unpacking the Multi-Layer Selloff
The equity market reaction to today's events is not a single-cause phenomenon. It is a layered selloff driven by at least three distinct but interconnected mechanisms, each reinforcing the others. Indeed, the trade war impact on oil prices has already primed markets for heightened sensitivity to any additional supply-side disruption.
Layer 1: The Direct Equity Shock
The most visible element of the selloff is the headline index movement. The Dow Jones Industrial Average declined by more than 800 points in a single session, with the S&P 500 and Nasdaq Composite both retreating as broad risk-off sentiment took hold across asset classes.
An 800-point decline in the Dow, while numerically dramatic, needs to be contextualised in percentage terms — but the directional signal is unambiguous. Institutional investors and algorithmic trading systems respond to geopolitical escalation with immediate de-risking activity, compressing valuations across sectors that have no direct connection to the Middle East at all.
This is the mechanism that market practitioners call headline risk — the capacity of a single political declaration to trigger synchronised selling across thousands of securities simultaneously, regardless of their individual fundamental outlooks.
Layer 2: The Bond Market Signal
The more technically significant development accompanying the equity selloff is the movement in US Treasury yields. The 10-year US Treasury yield climbed to approximately 4.58%, reaching its highest level in several weeks — and this number matters enormously for equity valuations. The gold and bond volatility playing out simultaneously adds another dimension to the complexity investors must navigate.
The mechanics are straightforward but frequently misunderstood by retail investors:
- Oil prices surge on Strait of Hormuz escalation risk
- Higher oil feeds inflation expectations across the broader economy
- Bond markets price in the reduced likelihood of Federal Reserve rate cuts
- The 10-year Treasury yield rises, increasing the discount rate applied to future corporate earnings
- Growth stocks — priced on earnings expected years or decades into the future — suffer disproportionate valuation compression
- The broad equity market declines as institutions rotate away from high-multiple positions
This chain explains why technology and semiconductor names including Nvidia, Palantir, and IBM fell sharply despite having no direct operational exposure to Middle Eastern oil markets.
Layer 3: The Inflation Feedback Loop
The most durable and potentially most damaging element of today's selloff is the inflation transmission risk. Oil is not simply an energy commodity — it is an input cost embedded throughout virtually every sector of the global economy.
The sectors facing the most direct exposure to an oil-driven cost surge include:
- Airlines and logistics — jet fuel constitutes 20–30% of airline operating costs, meaning a sustained US$10/barrel increase in crude can materially compress carrier margins
- Manufacturing and industrials — energy-intensive production processes see immediate cost pressure
- Consumer staples — transportation and packaging costs rise, squeezing margins on everyday goods
- Retail — supply chain cost pass-through affects pricing dynamics across the entire sector
Warning for Investors: This is not a standard geopolitical selloff. The secondary inflation transmission effect — where higher energy costs feed into broader CPI — means the market disruption may outlast the immediate conflict headlines by weeks or months.
The Capital Rotation Map: Which Sectors Win and Lose When Oil Surges
Not every portfolio is impaired by an oil price spike. Capital rotation during energy shocks follows identifiable patterns that long-term investors can use to navigate the volatility.
Sector Winners in an Oil Shock Environment
Energy producers are the most direct beneficiaries. Companies including ExxonMobil, Chevron, and ConocoPhillips see higher crude realisation prices flow directly into earnings. Historically, the energy sector has outperformed the S&P 500 by an average of 8–12% in the month following a major oil price spike.
Defence and aerospace companies benefit from the market expectation that geopolitical escalation will translate into increased government defence procurement. Commodities and hard assets including gold and natural gas attract safe-haven capital flows, and the gold safe-haven dynamics of the current environment are already drawing significant institutional interest. Counterintuitively, renewable energy names also tend to attract interest, as sustained high oil prices strengthen the long-term economic case for energy transition investments — a dynamic visible in the session where clean-energy names like Sunrun moved higher alongside traditional energy producers.
Sector Losers: Where Capital Is Fleeing
| Sector | Oil Shock Impact | Typical Short-Term Direction | Key Mechanism |
|---|---|---|---|
| Energy Producers | Strongly Positive | ↑ | Higher crude realisation prices |
| Defence | Positive | ↑ | Elevated geopolitical spending expectations |
| Technology / Semiconductors | Negative | ↓ | Rising yields compress growth valuations |
| Airlines | Strongly Negative | ↓ | Jet fuel cost surge |
| Consumer Discretionary | Negative | ↓ | Reduced household purchasing power |
| Utilities | Mildly Positive | → / ↑ | Safe-haven rotation and cost pass-through |
How Does a US-Iran Escalation Differ From Other Geopolitical Market Shocks?
A Historical Comparison of Geopolitical Oil Shocks and Market Recovery Timelines
Placing the current event within a historical framework is essential for calibrating the appropriate investor response.
| Event | Oil Price Spike | S&P 500 Peak Drawdown | Recovery Timeline |
|---|---|---|---|
| 1990 Gulf War | ~+100% | ~-17% | ~6 months |
| 2003 Iraq Invasion | ~+25% | ~-8% | ~3 months |
| 2019 Saudi Aramco Attack | ~+15% (single day) | ~-1% | ~2 weeks |
| 2022 Russia-Ukraine Invasion | ~+40% | ~-13% | ~5 months |
| 2026 US-Iran Escalation | ~+6% (initial) | TBD | Monitoring |
The pattern that emerges from this data is instructive: pure sentiment-driven geopolitical shocks without a persistent supply disruption tend to resolve within weeks. Shocks that embed into inflation expectations or trigger genuine central bank policy shifts can persist for three to six months or longer.
What Makes the Iran Scenario Structurally Different
Several features of the current situation differentiate it from a typical war scare. According to Investopedia's analysis of the market volatility triggered by the Iran developments, this episode carries characteristics that set it apart from routine geopolitical noise:
- Iran is a significant oil exporter — the US revocation of Iran's oil export licence represents a direct supply tightening measure, not merely a fear-driven market reaction
- The Strait of Hormuz closure risk has historical precedent — Iran has previously threatened and partially executed shipping disruptions in this waterway
- The event carries a dual-risk structure: simultaneous supply shock from export licence revocation and potential demand destruction from the broader economic growth slowdown that sustained high energy costs create
Analytical Note: Most geopolitical selloffs are driven by sentiment alone — markets recover once fear subsides. The Iran scenario carries a structural supply-side component that could sustain elevated oil prices independently of whether active conflict continues.
What Does This Mean for the Federal Reserve and Interest Rate Expectations?
The Fed's Dilemma: Inflation Resurgence vs. Growth Slowdown
The Federal Reserve operates under a dual mandate covering price stability and maximum employment. A sustained oil-driven inflation surge creates a genuine policy dilemma: cutting rates risks entrenching higher inflation, while holding rates risks compressing economic growth at a time when geopolitical uncertainty is already dampening business and consumer confidence.
Prior to the escalation, market consensus had been leaning toward rate cuts in the second half of the year. The oil shock has caused traders to reprice these expectations, with the probability of rates remaining elevated or even moving higher now increasing meaningfully. The 10-year Treasury yield reaching approximately 4.58% is bond market shorthand for this recalibration.
The most challenging scenario that this dynamic could produce is stagflation — a combination of rising inflation and slowing economic growth that leaves the Federal Reserve with no clean policy response. It is the environment that historically produces the deepest and most prolonged equity market drawdowns, because neither rate cuts nor rate hikes resolve both problems simultaneously.
How Rate Expectations Are Shifting in Real Time
The impact on different asset classes if the higher-for-longer rate scenario materialises:
- Equities — multiple compression, particularly severe for long-duration growth stocks
- Bonds — short-duration instruments become relatively more attractive as rate risk decreases
- Real estate — higher mortgage rates suppress transaction volumes and valuations
- Gold — mixed outlook; inflation positive but rising real rates create headwinds for non-yielding assets
Should Investors Buy the Dip? A Framework for Decision-Making Under Geopolitical Uncertainty
The Historical Case for Staying Calm
The empirical record of geopolitical market events strongly favours investors who resist the impulse to liquidate during the initial shock phase. Markets have recovered from virtually every geopolitical event within a 6–12 month window, and investors who exited quality positions during geopolitical dips have consistently underperformed those who held their positions through the volatility.
The critical analytical distinction is between noise and signal. Geopolitical headlines generate enormous noise. The signal that warrants genuine portfolio repositioning comes from structural shifts in the underlying earnings environment, not from military declarations or diplomatic breakdowns.
The Case for Caution: Why This Dip Is More Complex
Three specific conditions would warrant upgrading this situation from routine geopolitical volatility to a more serious portfolio risk event:
- Brent crude sustaining above US$90 per barrel for more than four to six consecutive weeks
- The 10-year Treasury yield breaking decisively above the 4.75–5.0% range
- Federal Reserve communications shifting to explicitly acknowledge a return to rate hike bias
A Decision Framework for Long-Term Investors
Rather than reacting to headlines, a structured approach to navigating this environment involves:
- Assess portfolio energy exposure — sufficient allocation to energy producers provides a natural hedge against the oil shock impact on other holdings
- Review growth stock valuations — high-multiple technology and semiconductor names face the greatest near-term pressure from rising yields
- Monitor the oil price trajectory — this is the single most important variable determining whether the current disruption lasts two weeks or six months
- Watch Federal Reserve communications — any shift in language around inflation will be the most significant market signal to emerge in the coming weeks
- Maintain liquidity — preserving optionality is more valuable than deploying aggressively until the macro picture clarifies around both oil prices and Fed policy direction
Strategic Principle: Geopolitical volatility is not the same as fundamental deterioration. Before repositioning a portfolio, investors should distinguish between a temporary risk premium repricing and a genuine shift in the underlying earnings or growth outlook for the companies they hold.
The next major ASX story will hit our subscribers first
Frequently Asked Questions: US Stock Market Decline and Oil Price Surge
Why is the US stock market down today?
A breakdown in US-Iran ceasefire negotiations triggered a sharp selloff across major US indices, with the Dow Jones Industrial Average falling more than 800 points. The selloff reflects both immediate geopolitical fear and a secondary concern about oil-driven inflation reigniting, which could delay or reverse Federal Reserve rate cut expectations. The market volatility from tariffs earlier in the year had already left investor sentiment fragile, making markets more susceptible to fresh shocks.
Why did oil prices surge today?
Brent crude jumped approximately 6% toward US$80 per barrel following military escalation near the Strait of Hormuz — a waterway responsible for approximately 20% of global crude oil transit daily — combined with the US revocation of Iran's oil export licence, which directly tightened global supply availability.
Which stocks typically rise when oil prices surge?
Energy producers including integrated oil majors, defence contractors, commodity-linked equities, and selectively renewable energy names tend to outperform during oil price spikes. The capital rotation dynamic is consistent across historical oil shock episodes.
Which stocks fall hardest when oil prices spike?
Airlines, technology companies, semiconductor manufacturers, and consumer discretionary stocks experience the greatest pressure — airlines from direct fuel cost exposure, and technology names from the yield-driven valuation compression that accompanies oil-driven inflation expectations.
How long do geopolitical stock market selloffs typically last?
Pure sentiment-driven geopolitical selloffs have historically resolved within 2–8 weeks. Selloffs that embed into inflation expectations or trigger central bank policy shifts have historically persisted for 3–6 months or longer, which is why the inflation dimension of the current event warrants closer monitoring than a typical war scare.
What is the Strait of Hormuz and why does it matter to investors?
The Strait of Hormuz is a narrow maritime passage between Iran and Oman through which approximately 20% of the world's daily oil supply transits. Any credible threat to shipping through this waterway produces immediate upward pressure on global crude prices, with cascading effects across equity, bond, and currency markets worldwide. As MarketWatch reports, failed negotiations between the US and Iran have historically been sufficient to push oil well above US$100 per barrel in previous escalation cycles.
The Macro Takeaway: Distinguishing Noise from Structural Risk
Key Data Points From Today's Market Movement
| Metric | Value | Market Significance |
|---|---|---|
| Dow Jones Decline | ~800 points | Broad equity risk-off signal |
| Brent Crude Surge | ~6% to ~US$80/barrel | Supply disruption premium priced in |
| 10-Year Treasury Yield | ~4.58% | Inflation and rate expectations rising |
| Strait of Hormuz Oil Transit | ~20% of global daily supply | Structural geographic vulnerability |
| Iran Oil Export Licence | Revoked by US | Direct supply tightening measure |
What to Watch in the Coming Days and Weeks
- Oil price trajectory — whether Brent crude consolidates below US$85 or pushes toward the US$90+ range will determine the durability of the inflation narrative
- Federal Reserve communications — any shift toward renewed hawkishness represents the most significant market signal investors should monitor
- Diplomatic developments — progress or collapse in any ceasefire or negotiation framework will drive the near-term oil price direction
- Earnings guidance revisions — airlines, industrials, and consumer companies updating cost outlooks in response to sustained fuel price increases will be the first fundamental signal of lasting damage
The key analytical principle for long-term investors navigating this environment is temporal perspective. The geopolitical noise will eventually subside. The question that determines portfolio outcomes is whether the secondary inflation transmission effect — which is the core reason why is the US stock market down today oil surges on Iran tensions — becomes embedded enough to shift Federal Reserve policy. That answer will become clear over weeks, not hours.
This article is intended for general informational purposes and does not constitute financial advice. All data and figures referenced reflect conditions at the time of writing. Investors should conduct their own independent research and consider seeking professional financial advice before making investment decisions.
Want to Stay Ahead of the Next Major Market-Moving Discovery?
While geopolitical shocks ripple through equity markets, significant ASX mineral discoveries continue to create substantial opportunities for informed investors — and Discovery Alert's proprietary Discovery IQ model delivers real-time alerts the moment these discoveries are announced, turning complex data across 30+ commodities into clear, actionable insights. Explore how historic discoveries have generated exceptional returns on Discovery Alert's dedicated discoveries page, and begin your 14-day free trial today to ensure you're positioned ahead of the broader market.