July 8, 2026
The Geopolitical Fault Line Rewriting Global Growth Projections
Every major global recession since the 1970s has been preceded or accompanied by an energy supply shock. From the Arab oil embargo to the Gulf War, disruptions to the flow of hydrocarbons through critical maritime corridors have reliably transmitted economic pain across borders, sectors, and income levels. What makes the current environment distinctive is not merely the scale of the disruption, but the precision with which it targets the single most consequential shipping lane on earth: the Strait of Hormuz.
Understanding the Iran war and IMF global growth outlook requires more than tracking headlines. It demands a structural analysis of how a 33-kilometre-wide waterway can determine whether the global economy expands at 3.4% or contracts toward recessionary territory, and what the divergent pathways forward look like across realistic conflict scenarios. Furthermore, the global recession risks embedded in this analysis extend well beyond the immediate energy shock.
Why the Strait of Hormuz Is the World's Most Economically Sensitive Chokepoint
The Strait of Hormuz sits between the Persian Gulf and the Gulf of Oman, connecting the hydrocarbon-rich producing nations of the Middle East to global energy markets. At its narrowest navigable point, vessels must transit through shipping lanes barely a few nautical miles wide in each direction.
Approximately 20 to 21% of global oil trade passes through this single corridor, alongside meaningful volumes of liquefied natural gas. For context, no pipeline network, no alternative maritime route, and no strategic petroleum reserve release programme can fully replicate the throughput capacity of Hormuz at scale. The Cape of Good Hope rerouting option adds weeks of transit time and significantly increases shipping costs, insurance premiums, and carbon intensity per barrel delivered.
When US-Iran hostilities escalated from late February 2026, this theoretical vulnerability became a live economic shock mechanism. Iran began asserting control over the strait, attacking commercial vessels and effectively reducing Hormuz transit traffic to a fraction of its pre-war throughput. The consequences did not remain confined to energy markets. They propagated through inflation expectations, fiscal balances, monetary policy frameworks, and sovereign creditworthiness across dozens of economies simultaneously.
From Ceasefire to Collapse: The Conflict Timeline That Defines the Forecast
The chronological architecture of the US-Iran conflict matters enormously for understanding why the IMF's July 2026 projections carry embedded uncertainty that may already be outdated.
Key structural milestones include:
- Late February 2026: Active hostilities commence between US and Iranian forces, triggering immediate disruption to Hormuz commercial shipping
- 18 June 2026: An interim deal is signed, committing both parties to halt the use of force and progressively reopen the strait to commercial traffic
- 22 June 2026: OFAC issues an authorisation permitting purchases of Iranian crude, refined products, and petrochemicals, providing Tehran with partial sanctions relief as a confidence-building measure
- Late June to early July 2026: Iranian forces resume attacks on commercial vessels transiting the southern portions of Hormuz, including strikes on an LNG tanker and a very large crude carrier (VLCC)
- 7 July 2026: The US military resumes strikes on Iranian targets following the renewed vessel attacks; the US Treasury's OFAC revokes the authorisation for Iranian oil purchases; both Washington and Tehran publicly declare the interim deal framework void
Critically, Hormuz transit traffic had only recovered to approximately 30% of pre-war levels in the week before the latest escalation. WTI crude futures crossed above $72 per barrel following the renewed Iranian vessel attacks, signalling that energy markets were repricing the risk premium upward before the US military response had even begun.
The IMF's July 2026 World Economic Outlook was calibrated against conditions as of late June, before the latest round of hostilities. This creates a meaningful gap between the published forecast and the current risk environment, making scenario modelling essential for any forward-looking analysis.
When big ASX news breaks, our subscribers know first
What Did the IMF Actually Forecast? Breaking Down the Numbers
The Headline Figures and the Assumption Embedded Within Them
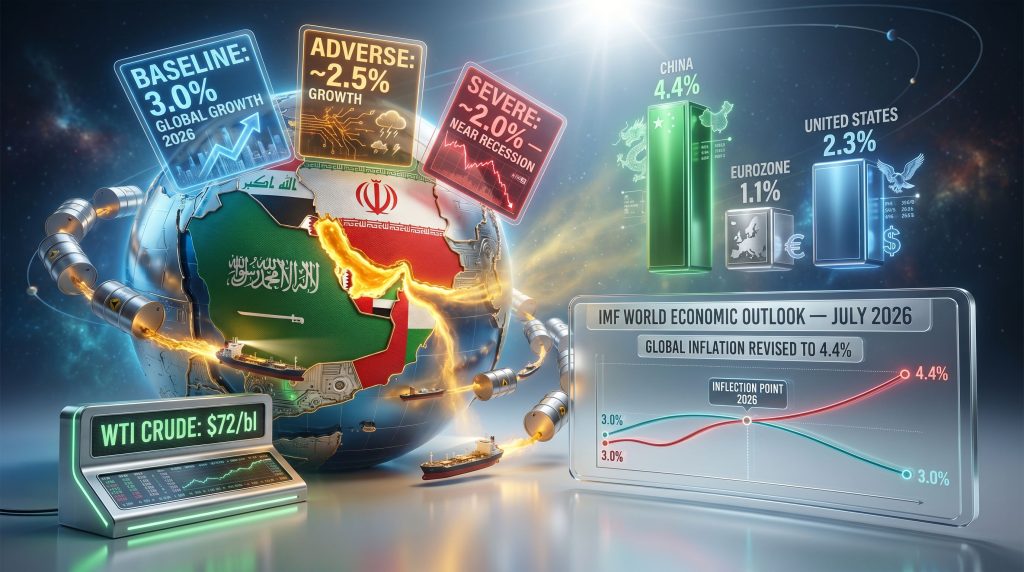
The IMF's July 2026 World Economic Outlook projects global GDP growth at 3.0% for 2026 and 3.4% for 2027. Compared to the April 2026 forecast of 3.1% for 2026 and 3.2% for 2027, this represents a modest downward revision for the current year and a materially higher recovery projection for 2027.
The 2027 upgrade is explicitly framed as a V-shaped recovery, contingent on two specific assumptions:
- Hormuz shipping begins normalising from July 2026
- Full pre-war throughput is restored by March 2027
Both assumptions were already under significant stress at the time of publication, given the renewed military exchanges in early July. The IMF's revised outlook also revised its 2026 global inflation forecast upward to 4.4%, reflecting the pass-through of elevated energy and food prices into consumer price indices across both advanced and developing economies.
IMF Growth Forecast Comparison: April vs July 2026
| Economy / Region | April 2026 Forecast | July 2026 Forecast | Direction | Key Driver |
|---|---|---|---|---|
| Global | 3.1% | 3.0% | Downward | Energy shock, Hormuz disruption |
| United States | ~2.4% | 2.3% | Downward | Consumer inflation from energy costs |
| Eurozone | ~1.2% | 1.1% | Downward | Natural gas price exposure |
| China | ~4.2% | 4.4% | Upward | Trade deal benefits, domestic stimulus |
| Sub-Saharan Africa | ~4.5% | 4.3% | Downward | Fuel import cost escalation |
| Global Inflation | ~4.0% | 4.4% | Upward | Energy and food price transmission |
Source: IMF World Economic Outlook, April and July 2026 updates
What the table above does not capture is the asymmetric risk profile surrounding each figure. The IMF's own commentary acknowledged that the global economy performed better than feared through the initial shock phase, with limited evidence of compounding second-order effects. However, this assessment was made before the interim deal's collapse, and before Iran resumed indiscriminate vessel attacks in early July.
The practical implication: the published 3.0% figure represents the best defensible estimate given late-June data, not a confident central forecast for the rest of the year.
How Conflict Duration Determines Economic Outcomes: A Three-Scenario Framework
The relationship between the Iran war and IMF global growth outlook is not a single-point forecast. It is a probability distribution across divergent pathways, each anchored to a different assumption about Hormuz normalisation.
Scenario 1: Baseline Resolution (Conflict Contained by Q3 2026)
This pathway assumes a new diplomatic framework is established before August 2026, with Hormuz shipping recovering progressively from mid-July and reaching full pre-war throughput by March 2027.
Key parameters under this scenario:
- Oil price increase absorbed over the conflict: approximately 19% above pre-war baseline, then partially reversing
- Global growth: 3.0% in 2026, recovering to 3.4% in 2027
- Global inflation: peaking at 4.4% in 2026, moderating as energy prices ease in 2027
- The OPEC influence on oil markets has been significant, with the seven-member coalition (Saudi Arabia, Russia, Iraq, Kuwait, Kazakhstan, Algeria, and Oman) approving five consecutive output ceiling increases since the war began; a sixth increase of 188,000 b/d is scheduled for August 2026, with only 188,000 b/d of voluntary cuts remaining — meaning full unwind is possible by September 2026
This scenario is now the least probable given the collapse of the interim deal framework and the resumption of active hostilities in early July 2026.
Scenario 2: Adverse Prolongation (Conflict Extends Through Late 2026)
Under this pathway, intermittent Hormuz disruptions persist beyond the August 2026 deadline. Diplomatic resolution is delayed, energy markets reprice for sustained supply risk, and financial conditions tighten.
Key parameters:
- Energy prices spike materially beyond the baseline 19% increase as risk premiums compound
- Global growth falls to approximately 2.5% in 2026, approaching the IMF's informal recession threshold
- Inflation accelerates to approximately 5.4%, creating a genuine policy dilemma for central banks
- Eurozone exposure becomes acute: potential growth losses of 0.2 to 0.6 percentage points with inflation increases exceeding 1 full percentage point above baseline
- Emerging market stress intensifies: fuel-importing nations face balance-of-payments pressure and are expected to seek expanded IMF financial assistance
Scenario 3: Severe Escalation (Multi-Year Conflict with Infrastructure Damage)
The most adverse pathway involves hostilities extending into 2027, with critical hydrocarbon extraction and export infrastructure sustaining significant damage, and Hormuz remaining partially or fully inaccessible for an extended period.
Key parameters:
- Global growth collapses to approximately 2.0% for both 2026 and 2027, meeting the IMF's functional definition of a global recession (below 2.5%)
- Inflation exceeds 6.0%, creating genuine stagflation across advanced and developing economies
- The structural supply deficit deepens: OPEC+ production from Saudi Arabia, Iraq, and Kuwait was already approximately 8.5 million b/d below target in May 2026; extended conflict prevents meaningful recovery
- Russia emerges as a relative beneficiary through elevated hydrocarbon revenues, complicating Western policy coordination
The IMF's severe scenario does not require a total Hormuz closure. Sustained uncertainty, elevated war-risk insurance premiums, and systematic rerouting costs are sufficient to maintain energy price pressure and suppress business investment confidence globally.
Which Economies Bear the Greatest Exposure?
The Highest-Vulnerability Tier: Energy Importers
Not all economies face the same transmission mechanism. The depth of exposure depends on three variables: energy import dependency, fiscal capacity to absorb price shocks, and the proportion of household income spent on energy and food.
- Eurozone: Already operating at compressed growth of 1.1% in the baseline, the region faces acute natural gas price sensitivity. A prolonged conflict scenario carries stagflation risk that would challenge the European Central Bank's dual mandate simultaneously.
- Sub-Saharan Africa: Growth revised down to 4.3% from a pre-war trajectory closer to 4.6%. Foreign exchange reserves are being consumed by elevated fuel import bills, compressing fiscal space for development spending.
- South and Southeast Asia: Regional growth headwinds accumulate from both higher energy import costs and supply chain disruption created by shipping rerouting. Freight cost increases add a secondary inflationary layer beyond direct energy price transmission.
Partial Insulation with Structural Caveats: Energy Exporters
- Gulf producers (Saudi Arabia, Iraq, Kuwait): Paradoxically, these nations suffer near-term output and export losses despite benefiting from higher oil prices. Their ability to monetise elevated prices is contingent on resolving the very conflict that created those prices.
- Russia: Elevated oil and gas prices support fiscal revenues at a time when military expenditure in Ukraine remains elevated. The complexity of Russia's relative "winner" status in this conflict creates significant tensions within EU sanctions architecture.
- United States: A modest growth downgrade to 2.3% reflects domestic shale production providing meaningful insulation, though consumer inflation from gasoline prices creates both political pressure and Federal Reserve policy complications.
China's Divergent Trajectory
China represents the single most analytically interesting outlier in the IMF's July 2026 update. Its growth forecast was revised upward by 0.2 percentage points to 4.4%, the only major economy to receive an upgrade.
Three factors drive this divergence:
- Reduced US tariff pressure following bilateral trade negotiations, with US-China trade tensions easing somewhat following recent diplomatic engagement
- Domestic fiscal and monetary stimulus measures supporting consumer demand
- China's demonstrated ability to source discounted energy from alternative suppliers outside Hormuz-dependent channels
The caveat is that China's export competitiveness faces secondary headwinds if global demand deteriorates materially under Scenario 2 or 3. A world economy growing at 2.0% generates structurally weaker demand for manufactured exports, regardless of China's domestic policy response.
The OPEC+ Response Strategy and the Production Recovery Paradox
Five Increases, One Fundamental Problem
Since hostilities began in late February 2026, the seven core OPEC+ members have approved five consecutive increases to their collective production ceiling. The most recent decision adds 188,000 b/d effective August 2026, leaving only a matching 188,000 b/d of voluntary cuts remaining. Full unwind of all conflict-era production restrictions could theoretically occur by September 2026.
Before the war, overall OPEC+ output had fallen approximately 9.6 million b/d below pre-war levels, an historically unprecedented supply withdrawal driven not by strategic cartel discipline but by the physical impossibility of exporting through a disrupted strait.
The gap between OPEC+ production targets and actual deliverable supply is the single most important variable determining whether the IMF's baseline or adverse scenario materialises. Hormuz transit volumes, currently sitting at roughly 30% of pre-war levels, function as the leading real-time indicator of which scenario is unfolding.
The fundamental paradox is straightforward but consequential: production target increases approved in Riyadh, Moscow, Baghdad, and Kuwait City are only economically meaningful if tankers can physically load and depart. While Hormuz remains disrupted, each successive OPEC+ output decision is largely symbolic from a market supply perspective.
This dynamic introduces an important distinction that energy market participants often miss. The relevant signal is not the OPEC+ meeting outcome itself, but the weekly Hormuz transit volume data that follows it. Rising throughput confirms that approved production increases are being physically realised. Stagnant or declining throughput confirms that the targets remain theoretical.
How Policymakers Are Responding to the Dual Threat of Growth and Inflation
The IMF, IEA, and Strategic Reserve Coordination
The IMF and the International Energy Agency have activated a coordinated response involving strategic petroleum reserve releases designed to moderate near-term energy price spikes without permanently altering market structure. The IMF is simultaneously preparing for what it anticipates will be a significant wave of financial assistance requests from fuel-importing developing economies.
These loans are expected to differ structurally from typical IMF facilities in three ways:
- Larger size relative to borrowing country GDP, reflecting the systemic and externally-imposed nature of the shock
- Extended repayment periods, acknowledging that recovery timelines depend on geopolitical resolution rather than domestic policy adjustment
- Concessional interest rates, reducing the debt service burden on countries that have limited ability to absorb additional fiscal stress
The Stagflation Policy Trap
Central banks across both advanced and emerging economies face a particularly difficult operating environment. Supply-driven inflation argues for tighter monetary policy to prevent expectations from becoming entrenched. Deteriorating growth argues for accommodation to prevent unemployment from rising. These two imperatives directly contradict each other.
The IMF's guidance to governments emphasises temporary and narrowly targeted fiscal interventions, specifically designed to protect vulnerable households from acute energy cost increases without broadly stimulating energy demand. Blanket energy subsidies are explicitly discouraged: they would amplify global oil consumption at precisely the moment when constrained supply is the core problem, worsening the very price pressures governments are attempting to offset.
The Sanctions Architecture Tightening
The US Treasury's OFAC revoked the authorisation for Iranian crude, refined product, and petrochemical purchases effective immediately in early July 2026. Buyers who had contracted for Iranian oil following the 22 June authorisation window have until 17 July 2026 to wind down those transactions, with all outstanding payments required to be deposited into escrow accounts rather than transferred directly to Tehran.
This sanctions re-imposition removes the incremental supply that had briefly re-entered global markets during the interim deal period, tightening the physical supply balance at exactly the moment when geopolitical uncertainty is simultaneously suppressing Gulf producer export capacity. The broader geopolitical mining landscape is consequently facing similar pressures, with critical mineral supply chains exposed to analogous disruption risks.
The next major ASX story will hit our subscribers first
Long-Term Structural Risks Beyond the Forecast Horizon
Infrastructure Damage and the Non-Reversible Supply Deficit
The IMF's V-shaped recovery scenario carries an embedded assumption that no material hydrocarbon infrastructure damage occurs during the conflict. This assumption becomes progressively less defensible as conflict duration extends.
Unlike price shocks, which reverse relatively quickly once supply normalises, physical damage to extraction facilities, processing plants, pipeline networks, and export terminals creates multi-year supply deficits. Rebuilding offshore production platforms or onshore processing infrastructure is measured in years and billions of dollars, not months. If key Gulf infrastructure sustains significant damage under a prolonged conflict scenario, the 2027 recovery trajectory built into the IMF's baseline becomes structurally unreachable regardless of diplomatic resolution.
Historical Parallels: 1973, 1979, and Why 2026 Is Different
The combination of supply-side inflation and demand-suppressing growth shocks has clear historical precedent. The 1973 Arab oil embargo and the 1979 Iranian Revolution both generated stagflation episodes that took years and significant monetary tightening to resolve.
Key distinctions in the current episode include:
- Greater global energy efficiency and more diversified supply sources, including US shale production capacity that did not exist in 1979
- Stronger multilateral institutional coordination mechanisms through the IEA and IMF
- Higher baseline sovereign debt levels across both advanced and emerging economies, reducing fiscal headroom for response
- More complex financial system interconnections, meaning that risk premium increases transmit more rapidly across asset classes
Under Scenario 3, the combination of approximately 2.0% global growth and inflation exceeding 6.0% would represent the most severe peacetime stagflation episode since the early 1980s, occurring against a backdrop of structurally weaker fiscal positions than existed during that era. The oil price market impact of sustained conflict at this scale would furthermore compound these structural vulnerabilities in ways that standard macroeconomic models struggle to fully capture.
Frequently Asked Questions: Iran War and IMF Global Growth Outlook
What is the IMF's current global growth forecast for 2026?
The IMF's July 2026 World Economic Outlook projects global GDP growth at 3.0% for 2026 and 3.4% for 2027. The 2027 figure is conditional on progressive normalisation of Hormuz energy flows beginning in mid-2026 and completing by March 2027.
How does the Iran war affect oil prices and global inflation?
The conflict disrupted shipping through the Strait of Hormuz, which handles approximately one-fifth of global oil trade. This supply disruption contributed to an estimated 19% increase in energy prices under the baseline scenario, pushing the IMF's 2026 global inflation forecast to 4.4%. Under more severe conflict scenarios, inflation could exceed 6.0%. The IMF's own analysis confirms that sustained Hormuz disruption represents the single most consequential upside risk to its inflation projections.
Which economies are most exposed to the Iran war's economic impact?
The Eurozone faces the greatest advanced economy exposure due to natural gas import dependency, with growth projected at just 1.1% in 2026. Sub-Saharan Africa faces a downgrade to 4.3% growth. China is the notable exception, with its forecast revised upward to 4.4% due to trade normalisation and domestic stimulus. The US faces a modest downgrade to 2.3% growth.
What happens to global growth if the Iran conflict escalates further?
Under a severe escalation scenario involving extended conflict and significant energy infrastructure damage, global growth could fall to approximately 2.0% for both 2026 and 2027, with inflation exceeding 6.0%. This would represent near-recessionary conditions by IMF definitions, which use 2.5% as the functional recession threshold.
What is OPEC+ doing in response to the Iran war?
Seven core OPEC+ members have approved five consecutive production ceiling increases since the war began, with a further 188,000 b/d increase scheduled for August 2026. However, the practical impact remains constrained by Hormuz shipping disruptions, which prevent Gulf producers from physically delivering higher output volumes to international markets.
Is the IMF providing financial assistance to countries affected by the energy shock?
The IMF is anticipating a significant increase in financial assistance requests from fuel-importing developing economies. These facilities are expected to be structured with larger sizes relative to borrower GDP, longer repayment terms, and concessional interest rates, reflecting the externally-imposed and systemic nature of the economic stress.
The Fork in the Road for Global Growth
Three Paths, One Leading Indicator
The divergence between a 3.0% recovery, a 2.5% slowdown, and a 2.0% near-recession is determined by a single observable variable: weekly Hormuz transit throughput. Every diplomatic development, every military exchange, and every OPEC+ production decision ultimately resolves into whether more or fewer tankers are successfully transiting that 33-kilometre waterway each week.
The Iran war and IMF global growth outlook convergence point is clear: the published 3.0% figure may already be optimistic given conditions on the ground in early July 2026. The collapse of the interim deal framework, the resumption of Iranian vessel attacks, the US military response, and the revocation of the OFAC authorisation all occurred after the forecast's data cutoff.
For policymakers, central banks, and market participants, the practical framework is straightforward even if the geopolitics are not. Watch Hormuz throughput data weekly. Monitor whether it is recovering from its current 30% of pre-war baseline, holding steady, or deteriorating further. That single data series carries more predictive power for the 2026 global growth outcome than any combination of PMI surveys, consumer confidence indices, or central bank communications.
Disclaimer: This article is intended for informational and analytical purposes only. It does not constitute financial, investment, or policy advice. Economic forecasts and scenario projections involve inherent uncertainty and may differ materially from actual outcomes. Readers should conduct independent research and consult qualified professionals before making investment or policy decisions based on the information presented here.
Want to Stay Ahead of the Next Major Mineral Discovery Amid Global Market Volatility?
While macroeconomic shocks reshape investment landscapes, Discovery Alert's proprietary Discovery IQ model cuts through the noise by delivering real-time alerts on significant ASX mineral discoveries — transforming complex data across 30+ commodities into clear, actionable opportunities. Explore historic discoveries and their remarkable returns, then begin your 14-day free trial at Discovery Alert to position yourself ahead of the market before the next major find is announced.