June 15, 2026
The Architecture of Global Currency Markets: Why Scale and Structure Define Everything
Most investors understand that exchange rates move. Far fewer understand why they move, what forces drive those movements, and how USD and AUD currency trading — involving a country the size of Australia — ends up representing roughly 5% of all daily global forex volume. That disproportionate footprint is not accidental. It reflects something deeper about how trade, geography, and commodity cycles intersect in the modern financial system.
The foreign exchange market is the largest financial market on earth by a significant margin. With over $7.5 trillion in daily transactions flowing through it, forex dwarfs global equity and bond markets combined. Unlike stock exchanges, there is no central venue. Trading occurs through a decentralised network of banks, institutional desks, brokers, and increasingly, algorithmic systems operating across overlapping sessions in Sydney, Tokyo, London, and New York.
Within this architecture, major currency pairs always feature the US dollar on one side. That is not convention for convention's sake. It reflects the USD's structural role as the world's reserve currency, the benchmark for commodity pricing, and the default settlement medium for international trade contracts.
When big ASX news breaks, our subscribers know first
Why the USD Holds a Structural Grip on Global Finance
The US dollar's dominance is not purely a product of US economic size. It is the result of decades of institutional entrenchment. Approximately 58% of global foreign exchange reserves are held in USD, according to International Monetary Fund data. Central banks from Frankfurt to Jakarta hold dollar-denominated assets as a matter of financial architecture, not preference.
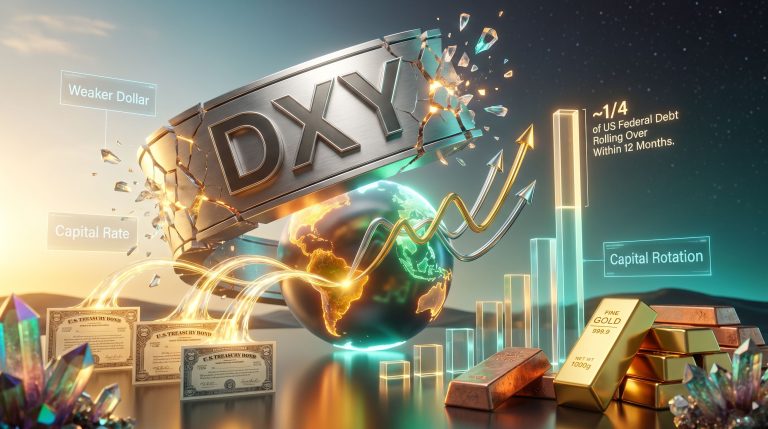
This creates what economists call the exorbitant privilege: the US can borrow cheaply, run persistent current account deficits, and still see its currency strengthen during global crises because capital instinctively flows toward dollar assets when uncertainty rises. Military conflict, energy shocks, banking stress, and pandemic-level disruptions all tend to produce the same reflex: buy dollars.
The US Federal Reserve amplifies this dynamic through interest rate policy. When the Fed adopts a hawkish posture, holding rates elevated or signalling further tightening, yield-seeking capital migrates toward USD-denominated assets, strengthening the greenback. As of mid-2026, the Fed's sustained high-rate environment has reinforced that dynamic, contributing to gold prices approaching $4,000 per ounce. The gold price forecast for the remainder of the year remains closely tied to broader macro uncertainty, even as the dollar maintains elevated strength.
The USD does not merely reflect the health of the US economy. It functions as a global risk barometer. Paradoxically, US economic weakness can sometimes strengthen the dollar if global conditions deteriorate faster.
What Actually Drives the Australian Dollar
Australia's Commodity Export Engine
The AUD is universally classified as a commodity currency, and this classification carries real analytical weight. Australia's export base is heavily concentrated in raw materials: iron ore, metallurgical coal, thermal coal, gold, and agricultural products. When global commodity prices rise, export revenues increase, the trade surplus widens, and demand for AUD strengthens as buyers of Australian goods convert foreign currency into dollars.
The inverse also holds. When commodity prices fall, or when demand from major importing nations weakens, the AUD tends to depreciate quickly. This makes the Aussie more volatile than currencies backed by diversified, services-driven economies, but also more reactive to real-time global demand signals. Furthermore, shifts in global commodity market tariffs can directly influence the export environment, adding another layer of complexity to AUD valuation.
The China Proximity Factor
No single relationship shapes AUD/USD dynamics more consistently than the trade and economic link between Australia and China. China iron ore demand is a particularly critical driver — when Chinese industrial production accelerates, infrastructure spending expands, or manufacturing output rises, demand for Australian iron ore, coal, and copper surges. That export demand flows back through the AUD.
Conversely, periods of Chinese economic slowdown, policy tightening, or property sector stress translate into AUD weakness, often within days of the underlying data release. Traders monitoring AUD/USD would be well served watching Chinese PMI readings, fixed asset investment figures, and property construction data as leading indicators. In addition, the broader China steel and iron ore landscape in 2025 and beyond presents both challenges and opportunities that flow directly into AUD pricing.
It was this combination of stable domestic fundamentals, strong export revenues, and geographic proximity to Asian manufacturing hubs that saw the Australian dollar recognised earlier in 2026 as the best-performing currency among its major peers. That status reflected real structural advantages, not speculative momentum.
RBA Policy and Interest Rate Dynamics
The Reserve Bank of Australia (RBA) sets the official cash rate that anchors short-term borrowing costs across the Australian economy. As of mid-2026, the RBA maintains a hawkish policy stance in response to persistent domestic inflation, providing yield support for AUD-denominated assets.
The interest rate differential between the RBA and the Federal Reserve is one of the most closely watched variables in AUD/USD pricing. When Australian rates offer relatively higher yields than US rates, capital flows toward AUD assets. When the Fed leads with more aggressive tightening, the differential narrows or reverses, and the Aussie faces headwinds.
AUD/USD Exchange Rate: A Mid-2026 Snapshot
Current Rate Data (June 2026)
| Direction | Rate | Interpretation |
|---|---|---|
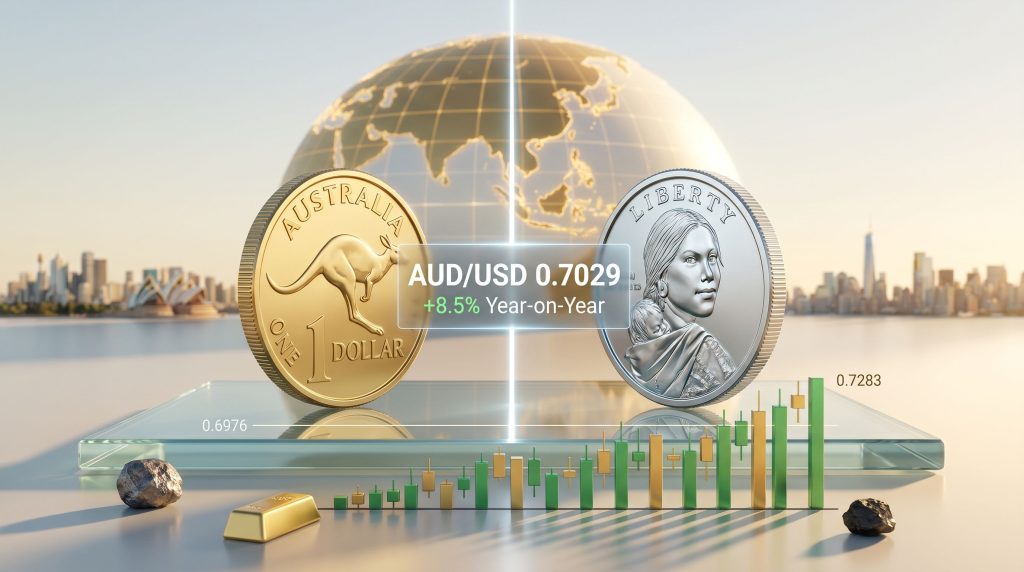
| AUD to USD | 0.7029 | 1 AUD buys approximately 70.29 US cents |
| USD to AUD | 1.458 | 1 USD buys approximately $1.46 AUD |
| Monthly Change | -3.0% | AUD has softened over the past 30 days |
| 12-Month Change | +8.5% | AUD remains meaningfully stronger year-on-year |
Sources: Reserve Bank of Australia, Trading Economics, June 12-14, 2026
Despite the strong 12-month performance, the AUD pulled back to 0.7041 on June 12, 2026, a 0.12% decline in a single session. The 3% monthly retreat reflects a confluence of factors: rising oil prices connected to Middle East geopolitical tensions, renewed USD strength from the Fed's sustained hawkish positioning, and a broader rotation into safe-haven assets that disadvantages commodity currencies.
What makes this pullback interesting from an analytical perspective is that it does not necessarily signal a fundamental deterioration in Australia's economic position. Rather, it reflects how risk-off sentiment in global markets temporarily overrides commodity-driven structural support for the AUD.
How USD and AUD Currency Trading Actually Works
The Four Primary Access Points
For Australian investors and traders looking to engage in USD and AUD currency trading, there are four primary structures available:
-
Spot Forex Contracts — The most direct method: buying or selling AUD/USD at the current prevailing market price for near-immediate settlement. This is the domain of institutional traders, banks, and experienced retail participants with access to interbank pricing through a forex brokerage. You can track live AUD/USD rates to monitor current market conditions.
-
Forward Contracts — An agreement to lock in a specific exchange rate today for a transaction that settles at a defined future date. Forward contracts are widely used by Australian businesses with USD-denominated invoice obligations, allowing them to hedge against adverse currency movements before settlement.
-
Contracts for Difference (CFDs) — Allow participants to speculate on AUD/USD price direction without taking physical ownership of either currency. Profit and loss are calculated on the price difference between entry and exit. Understanding CFD risks and benefits is essential before engaging, as standard margin requirements typically sit around 1% of total notional position value, though this varies by broker and regulatory jurisdiction.
-
Directional Positioning — Whether through spot forex or CFDs, traders can take either a long position (expecting AUD appreciation against the USD) or a short position (expecting AUD to weaken). Position sizing, leverage, and stop-loss placement are the three critical risk management variables regardless of direction.
Technical Levels Defining AUD/USD Direction in Mid-2026
Key Price Level Reference Table
| Level | Price | Significance |
|---|---|---|
| Primary Support | 0.6976 | 23.6% Fibonacci retracement, critical floor |
| Immediate Resistance | 0.7147 | Recent swing high |
| Key Resistance Barrier | 0.7158 | Horizontal resistance zone |
| Bullish Extension Target | 0.7283 | Next upside objective on 0.7158 break |
| Extended Bull Target | 0.7661 | Multi-month bullish scenario |
| Bearish Support 1 | 0.6897 | First downside cluster below 0.6976 |
| Bearish Support 2 | 0.6450 | Intermediate downside level |
| Deep Bear Target | 0.6178 | Significant structural support |
The prevailing short-term technical bias is mildly bullish, with price holding above the 23.6% Fibonacci retracement at 0.6976. A confirmed close above 0.7158 would open a path toward 0.7283 and potentially a longer-term rally toward 0.7661. A breakdown below 0.6976, however, would shift the technical picture bearish, with the next meaningful support cluster at 0.6897 and 0.6450.
Fibonacci retracement levels deserve a brief explanation for newer participants: they are derived from the Fibonacci sequence and represent percentage retracements of a prior price move. Traders use them to identify potential support and resistance zones where momentum may stall or reverse. The 23.6% level is considered a shallow retracement, meaning the trend remains relatively intact when price holds above it.
The next major ASX story will hit our subscribers first
Long-Term Historical Context: The AUD's Full Range
| Milestone | Rate | Approximate Date |
|---|---|---|
| All-Time High | 1.49 | December 1973 |
| All-Time Low | 0.4855 | March 2001 |
| Current Level | ~0.7029 | June 2026 |
| 12-Month Forecast | ~0.72 | Analyst consensus |
| End of Q2 2026 Estimate | ~0.71 | Near-term consolidation |
The AUD's 1973 high of 1.49 against the USD reflected a fundamentally different global monetary regime, one that preceded the full adoption of floating exchange rates and occurred against the backdrop of the commodity price supercycle following the oil shock. The March 2001 low of 0.4855 coincided with the collapse of the dot-com bubble and severe commodity price weakness. At approximately 0.70, the Aussie sits in a historically mid-range position, consistent with balanced but uncertain macro conditions.
When and How to Trade AUD/USD Most Effectively
Session Timing and Volatility Windows
| Trading Session | GMT Hours | Relevance to AUD/USD |
|---|---|---|
| Sydney Open | 21:00 – 06:00 GMT | Initial AUD liquidity injection |
| Tokyo Session | 23:00 – 08:00 GMT | Asian demand signals, China data |
| Peak Trading Window | 19:00 – 04:30 GMT | Sydney-Tokyo-early European overlap |
| London Open | 07:00 GMT | Expanded participation, increased volatility |
The tightest spreads and highest liquidity for USD and AUD currency trading typically occur during the 19:00-04:30 GMT window, when Sydney, Tokyo, and early European sessions overlap. Average daily price volatility for AUD/USD runs approximately 0.33%, making it a relatively stable but genuinely tradeable pair with meaningful intraday ranges.
Scheduled events that routinely generate above-average volatility include:
- RBA interest rate decisions and accompanying statements
- US Non-Farm Payrolls releases
- Australian monthly employment data
- Chinese trade balance and PMI reports
- US Consumer Price Index (CPI) releases
- Federal Open Market Committee (FOMC) meeting minutes
Five Macro Signals Every AUD/USD Trader Should Monitor in 2026
1. Interest Rate Differentials
The spread between RBA and Fed rates drives capital flow decisions for institutional and retail participants alike. A widening differential in Australia's favour supports AUD appreciation. Conversely, a narrowing spread favours USD strength.
2. Commodity Price Cycles
Iron ore, gold, and coal price movements remain primary leading indicators for AUD direction. Gold approaching $4,000/oz in USD terms simultaneously reflects safe-haven demand and USD strength, a dynamic that can support gold-linked AUD export revenues while still capping AUD/USD upside.
3. Chinese Economic Activity Data
Monthly releases on Chinese industrial production, retail sales, fixed asset investment, and PMI readings function as forward indicators for Australian export demand. Weakness in Chinese data typically precedes AUD softness within days to weeks.
4. Geopolitical Risk Premiums
Escalating tensions in the Middle East have elevated oil prices and triggered risk-off positioning across global markets, a consistent headwind for commodity currencies like the AUD. A meaningful de-escalation scenario, such as a formalised peace agreement between regional parties, could rapidly reverse risk sentiment and provide a tailwind for AUD recovery.
5. US Dollar Index (DXY) Movements
The DXY measures USD strength against a basket of major currencies. AUD/USD tends to move inversely to DXY trends. Monitoring both simultaneously clarifies whether AUD price moves reflect Australia-specific developments or broader shifts in USD appetite.
Frequently Asked Questions: USD and AUD Currency Trading
What is the AUD/USD rate as of mid-June 2026?
One Australian dollar purchases approximately 0.7029 USD, while one US dollar buys approximately 1.458 AUD. Rates shift continuously during market hours.
Why is the AUD classified as a commodity currency?
Because Australia's economy derives a substantial proportion of its export earnings from raw materials including iron ore, coal, gold, and agricultural products. Rising global commodity prices tend to increase export revenues, boosting demand for AUD.
What is the optimal time window for trading AUD/USD?
The 19:00-04:30 GMT period, covering the Sydney-Tokyo-early European overlap, offers the highest liquidity and tightest bid-ask spreads for the pair.
How does Federal Reserve policy affect the AUD?
A hawkish Fed strengthens the USD by attracting yield-seeking capital, which places downward pressure on AUD/USD. Dovish Fed signals or rate cuts, however, tend to weaken the USD and support the Aussie.
What margin is typically required for AUD/USD CFD trading?
Standard CFD margin requirements for AUD/USD typically sit around 1% of notional position value, though broker-specific terms and regulatory requirements vary.
What is the 12-month analyst consensus for AUD/USD?
As of mid-2026, the consensus projection places AUD/USD around 0.72 over the following 12 months, reflecting modest Aussie appreciation underpinned by continued RBA hawkishness and stable Australian export fundamentals.
Synthesising the AUD/USD Picture for Australian Investors
USD and AUD currency trading sits at the intersection of some of the most powerful macro forces operating in the global economy: US monetary policy, Chinese industrial demand, commodity price cycles, and geopolitical risk premiums. Understanding how each of these forces interacts is not just useful for active forex traders. It is equally relevant for any Australian investor with exposure to international equities, US-denominated assets, or companies whose earnings are influenced by the AUD/USD exchange rate.
As of mid-2026, the pair trades around 0.7029, holding above key technical support at 0.6976 with a mildly bullish near-term bias. The 12-month outlook reflects modest appreciation, supported by RBA hawkishness and Australia's structural role as a critical commodity supplier to Asian industrial economies.
The key variables to track moving forward are the RBA and Fed rate calendars, iron ore and gold price movements, Chinese economic data releases, and the DXY as a real-time proxy for broader USD appetite.
Disclaimer: This article is intended for educational and informational purposes only and does not constitute financial or investment advice. Currency trading involves significant risk of loss. Past performance is not indicative of future results. Readers should consult a licensed financial adviser before making any trading or investment decisions. Rate data sourced from the Reserve Bank of Australia and Trading Economics for the period June 12-14, 2026.
Readers looking to deepen their understanding of currency markets and related investor education topics can explore The Market Online's Wiser Wealth series at themarketonline.com.au.
Want to Capitalise on the Commodity Discoveries Driving Australia's Export Economy?
Discovery Alert's proprietary Discovery IQ model delivers real-time alerts on significant ASX mineral discoveries — the very commodities underpinning AUD dynamics — instantly converting complex geological data into actionable investment insights for traders and investors at every experience level. Explore historic mineral discovery returns on Discovery Alert's dedicated discoveries page and begin a 14-day free trial to position yourself ahead of the broader market.