August 23, 2026
When the Big Picture Speaks, Traders Who Ignore It Pay the Price
Most market participants spend the majority of their analytical time focused on what happened today, or at best, this week. Intraday charts generate constant signals, news events trigger knee-jerk reactions, and the pressure to act quickly often overrides the discipline to step back and assess structural context. Yet experienced technical analysts consistently emphasise that the weekly timeframe is where the most durable and reliable market signals reside.
The mechanics behind this are straightforward. A single daily candle reflects roughly six to eight hours of price discovery. A weekly candle, by contrast, absorbs five full trading sessions, filtering out the noise generated by algorithmic responses to individual data prints, earnings surprises, and geopolitical headlines. What remains on a weekly chart is the distilled consensus of institutional positioning, macro sentiment shifts, and genuine supply-demand imbalances.
Examining weekly charts for the dollar, palladium, and copper simultaneously in mid-July 2026 reveals three markets that are each, in their own way, approaching technically critical junctures. The resolutions of these setups carry implications not only for short-term traders but for investors with multi-month positioning horizons.
When big ASX news breaks, our subscribers know first
The U.S. Dollar Index: A Fibonacci Crossroads With Far-Reaching Consequences
Understanding the DXY as a Commodity Pricing Anchor
The U.S. Dollar Index (DXY) measures the greenback against a trade-weighted basket of six major currencies: the euro, Japanese yen, British pound, Canadian dollar, Swedish krona, and Swiss franc. Because virtually every globally traded hard commodity, from crude oil to copper to palladium, is priced in U.S. dollars on international futures markets, movements in the DXY create a structural tailwind or headwind for commodity prices regardless of underlying supply-demand dynamics.
This inverse relationship is not incidental. When the dollar weakens, non-U.S. buyers can acquire the same quantity of commodities for fewer units of their local currency, effectively expanding the pool of demand. When the dollar strengthens, the reverse occurs, compressing foreign buying power and creating downward pricing pressure. This mechanical linkage is why forex strategists, commodity traders, and macro portfolio managers all track the DXY chart as a foundational input. Furthermore, a solid commodities investment guide will always account for dollar dynamics as a core variable.
Reading the Weekly Dollar Chart
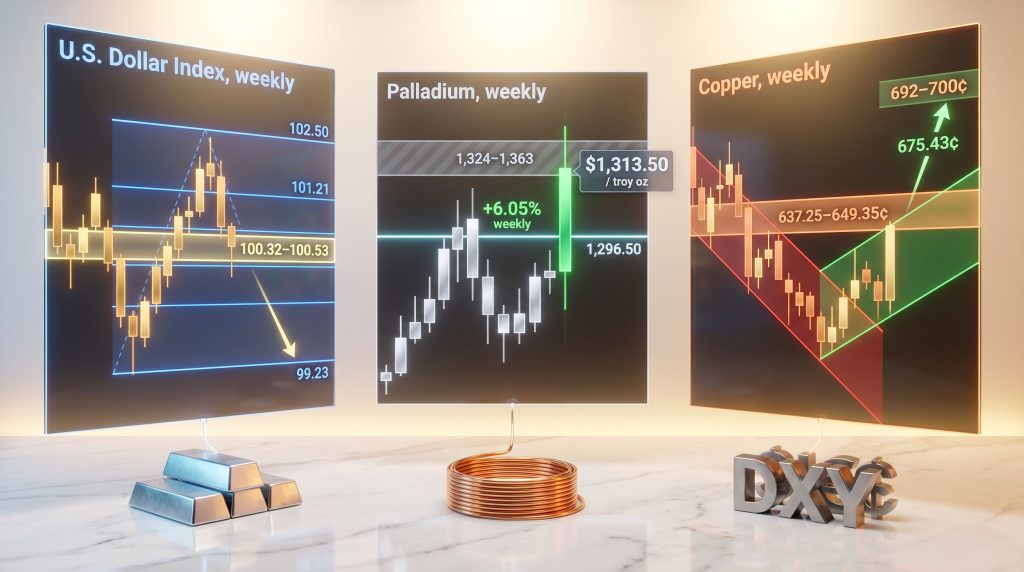
As of mid-July 2026, the weekly DXY chart presents what technical analysts would describe as a high-conviction confluence zone. Price is testing two overlapping technical structures simultaneously: a horizontal resistance line derived from multiple prior swing highs, and the 38.2% Fibonacci retracement measured from a significant prior advance. The simultaneous presence of these two reference points at the same price area creates a zone of heightened technical significance.
The critical support range to monitor sits between 100.32 and 100.53. A sustained weekly close below this area, particularly a confirmed break beneath the 100.32 level, would materially increase the probability of a deeper corrective move. Based on the measured move methodology applied to the current consolidation's height, the next logical downside target falls near 99.23, an area that also coincides with a bullish engulfing formation printed on the weekly chart in June, which may provide a floor if selling pressure intensifies.
On the upside, a recovery and confirmed hold above 101.21 would preserve the short-term recovery structure. If buyers were to fully reassert control from this Fibonacci support zone, the 50% Fibonacci retracement near 102.50 represents the next meaningful resistance barrier. You can track live dollar movements to monitor how these levels are being respected in real time.
Dollar Weekly Chart Scenario Table
| Scenario | Trigger Level | Projected Target | Implication for Commodities |
|---|---|---|---|
| Bullish continuation | Close above 101.21 | ~102.50 (50% Fib) | Headwind for palladium and copper |
| Range-bound | Hold 100.32–100.53 | Consolidation persists | Neutral commodity pricing environment |
| Bearish breakdown | Close below 100.32 | ~99.23 (measured move) | Potential tailwind for hard commodities |
"The dollar's position at a weekly Fibonacci and swing-high confluence is one of the most technically significant macro setups across global markets right now. Its directional resolution will likely act as a catalyst for both palladium and copper pricing in the weeks ahead."
Palladium Weekly Chart Analysis: Structural Improvement, But Confirmation Pending
Palladium's Recent Price Performance
Palladium (PA.F front-month futures) closed at approximately $1,313.50 per troy ounce on July 15, 2026, representing a daily gain of around +0.42% and a weekly advance of approximately +6.05%. The weekly trading range spanned roughly $1,231 to $1,344 per ounce.
To contextualise this move, palladium's 52-week range stretches from $1,093.50 to $2,172.50 per troy ounce, a spread of nearly $1,080 per ounce. This extreme volatility profile reflects palladium's unique market structure: it is a relatively thinly traded market compared to gold or silver, with pricing heavily influenced by automotive catalyst demand and concentrated mine supply in Russia and South Africa.
What Drove the Weekly Gain and What It Signals
The +6% weekly advance was not arbitrary. Buyers successfully defended the $1,248 level, which represented the previously broken upper boundary of a multi-week consolidation range. In technical analysis, when a prior resistance level is broken to the upside and price subsequently retests that level from above, the former resistance is expected to act as new support. The fact that buyers held this level under pressure constitutes a classic retest-and-hold confirmation pattern, one of the higher-probability setups in structural technical analysis.
Beyond price action, momentum indicators on the weekly chart are generating buy signals, adding a layer of confluence to the structural case for continued upside. However, price has now reached a zone reinforced by the upper boundary of a rising green channel on the weekly chart, a resistance structure that demands respect regardless of recent strength. You can monitor live palladium prices to track how this resistance zone is being tested.
The Critical Threshold: Why 1,296.50 Is the Line in the Sand
Despite the encouraging weekly gain, the analysis is clear: a confirmed weekly close above 1,296.50 is the validation trigger for the bullish continuation thesis. Without this confirmation, any intraday advance risks being a trap for premature longs.
Failure to achieve this weekly close threshold would open the door to a retest of the $1,250 support zone, where sellers would be expected to reassert pressure. If the bullish weekly close is secured, the next meaningful upside target zone sits between $1,324 and $1,363 per ounce, aligning with the resistance band at the channel's upper boundary.
Palladium Key Level Summary
| Level | Role | Implication |
|---|---|---|
| ~$1,231/oz | Weekly low / recent support | Near-term demand zone |
| $1,248 | Prior consolidation upper boundary | Must-hold for bullish structure |
| $1,296.50 | Weekly close confirmation level | Bullish validation trigger |
| $1,324–$1,363 | Resistance band / channel boundary | Next upside target zone |
| $1,093.50 | 52-week low | Structural floor reference |
"Palladium's +6% weekly gain is meaningful, but the metal has a well-documented history of sharp reversals within broader downtrends. The 52-week range alone illustrates how violent these reversals can be. Weekly close confirmation above key levels, not intraday spikes, is the more reliable signal for positioning decisions."
Palladium's Unique Market Structure: What Most Investors Miss
A factor that compounds palladium's technical picture is its fundamental supply structure. Roughly 40% of global palladium supply comes from Russia, with South Africa contributing the majority of the remainder. Unlike gold or copper, where dozens of producing countries provide supply diversification, palladium's concentrated source base means the metals and mining geopolitics of key producing regions can create sharp, asymmetric price responses that amplify technical moves in either direction.
Additionally, palladium is a primary byproduct metal in many mining operations, meaning its production cannot be easily scaled in response to price signals. This supply inelasticity is a structural feature that makes demand-side shifts particularly impactful on pricing and reinforces why institutional participants treat weekly chart signals with significant weight.
Copper Weekly Chart Analysis: The Red Metal's Structural Recovery Takes Shape
Copper's Current Market Position
Copper (HG.F front-month futures) was trading at approximately $5.76 per pound in mid-July 2026, reflecting a weekly gain of around +2.93%. The metal's 52-week range spans $4.33 to $6.72 per pound, placing current prices in the upper half of the annual range. For reference, the June 2026 monthly benchmark was approximately $13,552 per metric tonne, consistent with sustained global industrial demand. Understanding the broader copper market trends helps contextualise why these levels matter structurally.
Analysts should note that copper futures data can produce divergent readings across different contract specifications and price sources. Using the HG.F front-month futures contract consistently is essential for accurate technical analysis and level-to-level comparisons.
From Descending Channel to Breakout: The Technical Narrative
Copper had been constrained within a well-defined descending red channel for multiple weeks, a bearish continuation structure characterised by successively lower highs and lower lows. The critical inflection point arrived when buyers reclaimed the upper boundary of this channel near 634.78 cents per pound. This breakout, when it holds, typically signals that the downward momentum that defined the prior trend has been exhausted.
Following this reclaim, price advanced into the next major obstacle: a bearish gap zone spanning approximately 637.25 to 649.35 cents per pound. Bearish gaps on futures charts represent price levels where no transactions occurred during a rapid decline, creating what analysts call an unfilled gap that often acts as resistance when price rallies back toward it from below.
The 650 Resistance Cluster: A Convergence of Technical Factors
The approximately 650 cents per pound level represents an unusual convergence of multiple independent technical factors:
- The upper boundary of the unfilled bearish gap sits in this area, creating natural resistance from overhead supply.
- An ABCD harmonic pattern measured move completes at the same price level. Harmonic patterns use specific Fibonacci ratios to identify potential reversal zones, and their completion near independent resistance adds analytical weight.
- On the four-hour (H4) chart, momentum oscillators have entered overbought territory with early signs of bearish divergence, suggesting buying pressure may be decelerating before a sustained push through this level is achieved.
This multi-factor convergence makes the 637.25 to 650 cents range the most technically significant near-term resistance cluster in copper's price structure.
Copper's Weekly Chart and the Longer-Term Picture
Stepping back to the weekly timeframe provides a more constructive perspective. Copper has reclaimed the upper boundary of a green rising channel, a structurally positive development that reverses the short-term bearish narrative. Price now trades above the upper boundary of an orange consolidation zone on the weekly chart, a meaningful improvement in the longer-term technical picture.
The key weekly confirmation level is 640.35 cents per pound. A sustained weekly close above this threshold would open the measured path toward 675.43 cents (the 161.8% Fibonacci extension). Beyond that, the 692 to 700 cents per pound zone represents a broader medium-term target if bullish momentum is sustained and the gap zone is fully resolved. Consequently, understanding the copper price growth drivers becomes essential context for interpreting these weekly chart signals.
Copper Scenario Framework
| Scenario | Trigger | Next Target | Broader Implication |
|---|---|---|---|
| Bullish confirmation | Weekly close above 640.35¢ | 675.43¢ (161.8% Fib ext.) | Signals industrial demand recovery |
| Extended bull run | Break and hold above 675¢ | 692–700¢ zone | Potential multi-month trend resumption |
| Pullback scenario | Rejection near 650¢ | Healthy retracement | Consolidation before next leg higher |
| Bearish reversal | Break below channel support | Gap fill lower | Reassessment of structural recovery thesis |
"Copper's price trajectory is widely regarded as a leading indicator of global industrial activity. A sustained weekly close above the 640 to 650 cent resistance cluster would signal improving expectations for manufacturing, construction, and electrification demand beyond what daily charts alone could confirm."
Copper's Industrial Demand Profile: The Context Behind the Chart
Copper's sensitivity to global growth expectations is more pronounced than virtually any other base metal. The electrification of transportation and energy infrastructure has added a structural demand layer that did not exist in prior commodity cycles. Electric vehicles require approximately two to four times more copper than equivalent internal combustion engine vehicles, and grid-scale battery storage and renewable energy installations require substantial copper wiring per megawatt of capacity installed.
This structural demand shift means that a copper breakout in the current environment carries different qualitative implications than a comparable breakout in, say, 2010. The base demand floor is arguably more resilient, which makes technically confirmed breakouts above weekly chart resistance levels more likely to represent genuine trend resumption rather than noise-driven spikes. In addition, exploring copper investment strategies can help investors align their positioning with these structural demand realities.
How the Dollar, Palladium, and Copper Interact: A Multi-Market Framework
The Macro Relationship in Practice
The three markets discussed in the context of weekly charts for the dollar, palladium, and copper are not independent. They share a common pricing currency (the U.S. dollar) and respond to overlapping macro inputs including global growth expectations, central bank policy signals, and risk appetite shifts. Understanding their interplay is what separates multi-market analysis from isolated chart reading.
The most actionable cross-market scenario framework breaks down as follows:
- Dollar weakness + palladium weekly close above $1,296.50 produces the highest-probability bullish confluence for the metal, with both the macro tailwind and the technical confirmation aligning simultaneously.
- Dollar weakness + copper weekly close above 640.35 cents would be structurally significant for the entire industrial commodity complex, signalling that foreign buying demand is expanding at the same time as technical resistance is being resolved.
- Dollar recovery above 101.21 creates a cross-market headwind that could limit upside in both metals even if their individual technical setups remain intact. This scenario underscores why monitoring all three charts simultaneously produces more reliable signals than reading any single market in isolation.
Timeframe Alignment: The Most Reliable Confirmation Signal
Technical analysts frequently reference the concept of timeframe alignment, where signals across multiple chart intervals point in the same direction simultaneously. When a daily momentum signal, a weekly structural breakout, and a macro cross-market tailwind all converge, conviction in a directional trade increases substantially.
This is also why the distinction between a weekly close and a daily close matters so much. An intraday high or even a daily close above a key resistance level can be reversed within one or two subsequent sessions. A weekly close, by contrast, represents five days of price discovery and reflects sustained directional pressure that is far more likely to produce follow-through in subsequent weeks. Acting on intraday breakouts before weekly confirmation is one of the most common and costly errors in technical trading.
FAQ: Weekly Charts for the Dollar, Palladium, and Copper
What Does the Weekly Chart for the U.S. Dollar Index Currently Show?
The DXY is testing a technically critical zone defined by a prior swing high resistance line and the 38.2% Fibonacci retracement level. Bulls are defending the 100.32 to 100.53 support area while sellers are capping upside near 101.21. Resolution of this range will likely determine the medium-term directional bias for USD-denominated commodities.
Why Did Palladium Rise Approximately 6% in One Week?
Palladium's weekly gain reflected buyers successfully defending a structural support level near $1,248 and closing a prior bearish gap. Improving momentum indicators on the weekly chart suggest genuine buying interest rather than short-covering alone. However, the $1,296.50 weekly close level remains the critical confirmation threshold before sustained directional positioning is warranted.
What Is the Most Important Resistance Level for Copper Right Now?
The 637.25 to 649.35 cents per pound gap zone, and specifically the 650 cent area, represents the most significant near-term obstacle. This level combines an unfilled bearish gap, an ABCD harmonic pattern completion, and overbought H4 momentum readings. A weekly close above 640.35 cents would be the first meaningful confirmation of buyer dominance.
How Does the U.S. Dollar Affect Palladium and Copper Prices?
Both metals are priced in U.S. dollars on global futures markets. A weakening dollar reduces the effective purchase cost for non-USD buyers, supporting demand and price. Conversely, dollar strength creates a pricing headwind by making commodities more expensive in local currency terms.
What Is the Significance of a Weekly Close Versus a Daily Close?
Weekly closes represent five full trading days of price discovery and carry significantly more weight in identifying genuine trend changes. A daily close above resistance can be reversed the following session, whereas a weekly close above a key level reflects sustained buying pressure and is far more likely to generate follow-through.
What Are the 52-Week Ranges for Palladium and Copper?
Palladium's 52-week range spans approximately $1,093.50 to $2,172.50 per troy ounce. Copper's 52-week range sits between approximately $4.33 and $6.72 per pound, with current prices in the upper half of that range.
The next major ASX story will hit our subscribers first
Key Takeaways: What Weekly Charts for the Dollar, Palladium, and Copper Are Telling Us
- U.S. Dollar: Sitting at a high-stakes Fibonacci and swing-high confluence. Bulls need to hold the 100.32 to 100.53 support zone; a confirmed close below opens a measured move toward approximately 99.23. The 50% retracement near 102.50 caps upside if buyers regain control.
- Palladium: The weekly structure has improved materially following a +6% gain, but the $1,296.50 weekly close remains the non-negotiable confirmation level. Without it, a retest of $1,250 remains the base case risk scenario.
- Copper: Reclaiming both the descending channel and the rising channel boundary on the weekly chart is constructive. The 637.25 to 650 cent resistance cluster must be resolved before the path toward 675.43 cents and the 692 to 700 cent zone opens meaningfully.
- The unifying principle: Across all three markets, weekly closes rather than intraday moves are the signals that carry genuine directional conviction for medium-term positioning.
Disclaimer: This article is for informational and educational purposes only and does not constitute financial or investment advice. All price levels, technical targets, and scenario projections discussed represent analytical frameworks, not guaranteed outcomes. Past price patterns do not guarantee future results. Commodity and currency markets carry significant risk, and readers should conduct their own due diligence before making any investment decisions.
Want to Stay Ahead of the Next Major Mineral Discovery on the ASX?
While weekly chart analysis of the dollar, palladium, and copper offers valuable macro context for commodity investors, Discovery Alert's proprietary Discovery IQ model delivers real-time notifications the moment significant ASX mineral discoveries are announced — instantly translating complex data across 30+ commodities into clear, actionable insights. Explore Discovery Alert's discoveries page to see how historic finds have generated substantial returns, and begin a 14-day free trial to position yourself ahead of the broader market.