July 16, 2026
The Hidden Architecture of Oil Market Risk: Why Two Chokepoints Matter More Than One
Most conversations about oil price volatility focus on supply volumes, OPEC market influence, and demand forecasts. Rarely do they examine the physical geography of energy transit with the granularity it deserves. The global oil market is not simply a network of producing nations and consuming economies. It is, at its most fundamental level, a system of narrow maritime passages through which the majority of the world's seaborne crude must travel. When those passages face credible disruption risk, futures markets do not wait for confirmation. They price the threat immediately.
That dynamic is precisely what has been playing out across global energy markets in mid-July 2026, as oil prices rise after US strikes on Iran for a fourth consecutive session, pushing both major benchmarks toward one-month highs and forcing investors, policymakers, and energy importers to confront a scenario that had previously existed only in worst-case planning documents.
When big ASX news breaks, our subscribers know first
What Is Driving the Four-Day Oil Price Rally in July 2026?
The immediate catalyst is a significant escalation in US-Iran hostilities. Following the collapse of a fragile ceasefire established in June, US forces conducted fresh strikes targeting Iranian coastal defence infrastructure and missile installations in mid-July. Simultaneously, Washington reinstated a naval blockade on Iranian ports, effectively tightening the pressure on Tehran's ability to export crude through conventional channels.
Iran's response framing matters enormously here. Rather than characterising the conflict in tactical or diplomatic terms, Iranian leadership described the confrontation as an existential war with the United States. This rhetorical escalation is not simply political theatre. It signals a shift in the conflict's psychological architecture, from a bounded skirmish where de-escalation remains the expected outcome, to an open-ended confrontation where the ceiling on retaliatory action has been raised significantly. For a broader crude market overview, the context of this escalation is essential to understanding current pricing dynamics.
Crude Benchmark Snapshot: Where Prices Stand
As of July 16, 2026, both major crude benchmarks reflected a market pricing in elevated and sustained risk rather than a temporary spike.
| Benchmark | Price (July 16, 2026) | Change | Context |
|---|---|---|---|
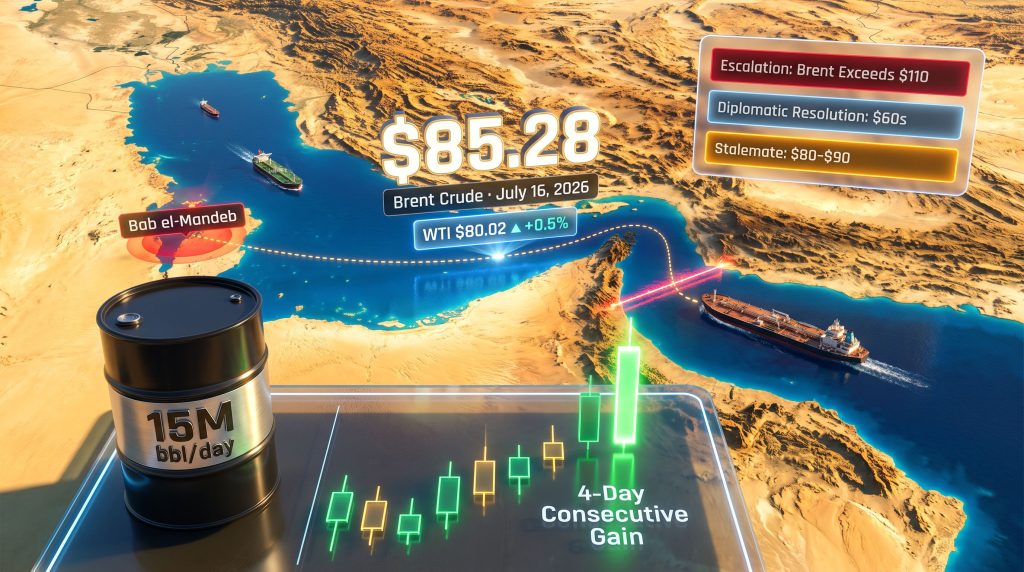
| Brent Crude | $85.28/barrel | +$0.33 (+0.4%) | Near one-month highs |
| WTI (West Texas Intermediate) | $80.02/barrel | +$0.42 (+0.5%) | Fourth consecutive daily gain |
| Brent (earlier surge peak) | ~$79.07 to $79.26/barrel | +5% to +6.6% | Triggered by ceasefire collapse |
| WTI (earlier surge range) | $73.89 to $74.71/barrel | +4.9% to +6.1% | Post-strike reaction |
Four consecutive sessions of price gains, with both benchmarks hovering near monthly highs, is a pattern that historically reflects structural risk-premium pricing rather than a short-term speculative reaction. The difference matters enormously for forward positioning.
How Does the Strait of Hormuz Closure Risk Reshape Global Energy Supply?
The Strait of Hormuz: Why Geography Is Destiny
To understand why oil prices rise after US strikes on Iran, you have to understand the physical constraint that makes Iranian escalation uniquely dangerous to global markets. The Strait of Hormuz, a narrow waterway between Iran and Oman at its southern entrance, handled approximately one-fifth of the world's oil and liquefied natural gas trade before hostilities intensified. That figure represents somewhere in the vicinity of 15 million barrels per day of crude oil alone, with additional volumes of LNG passing through the same corridor.
There is no pipeline network, no alternative maritime route, and no existing infrastructure capable of substituting for Hormuz throughput at that scale. The roughly 33-kilometre-wide navigable channel is one of the few places on Earth where a single geographic feature functions as a systemic constraint on the global economy.
What makes partial disruption particularly insidious is that futures markets respond disproportionately to probability of closure, not just actual closure. Even a 10 to 15 percent credible probability of significant throughput reduction is sufficient to embed a substantial risk premium into oil prices, because the asymmetry of a full-closure outcome is catastrophic enough to justify defensive pricing well in advance. Furthermore, these oil market disruption risks compound when combined with wider geopolitical pressures already weighing on global energy supply chains.
The Bab el-Mandeb Dimension: A Second Front Opening?
Perhaps the most strategically significant development in the current escalation cycle is the signalling from Iran that it may activate Houthi allies in Yemen to threaten the Bab el-Mandeb strait, the narrow chokepoint connecting the Red Sea to the Gulf of Aden at its southern end.
This matters for several interconnected reasons:
- The Bab el-Mandeb handles a substantial portion of Europe-bound cargo from Asia and the Middle East, making it a critical artery for energy and general trade
- A simultaneous disruption to both Hormuz and Bab el-Mandeb would place two of the world's most critical maritime energy corridors under threat at the same time, a scenario with no modern precedent in terms of combined throughput impact
- Cargo rerouting around the Cape of Good Hope, while technically feasible, adds approximately 10 to 14 days of transit time and significant fuel costs per voyage
- Marine war-risk insurance premiums for vessels transiting the Persian Gulf and Red Sea have already begun escalating, a leading indicator of how shipping markets are pricing the threat
The compounding effect of dual-chokepoint pressure is non-linear. Two corridors under threat does not simply double the supply risk. It multiplies the logistical complexity, insurance costs, and market anxiety in ways that are difficult to model with standard supply-demand frameworks.
Nations most acutely exposed to a dual-chokepoint disruption scenario include European importers dependent on Suez Canal routing, South Asian economies including India and Pakistan, and East Asian manufacturing hubs in China, Japan, and South Korea, all of which receive the majority of their crude imports via these two corridors. Al Jazeera's reporting on the US-Iran conflict has documented how rapidly markets responded to the initial strike announcements.
What Are the Three Scenarios for Oil Prices Through Q4 2026?
Goldman Sachs has framed the current uncertainty with unusual precision, offering a scenario range that captures the extraordinary spread of possible outcomes. Understanding these scenarios is essential for anyone attempting to position portfolios or manage energy procurement risk through the remainder of 2026.
Scenario 1: Escalation Deepens (Brent Exceeds $110)
Goldman Sachs has projected that Brent crude could exceed $110 per barrel in Q4 2026 if Gulf export disruptions persist and the current trajectory continues. The conditions required for this outcome include:
- Iranian export capacity remaining effectively zeroed out due to sanctions and naval blockade enforcement
- Hormuz throughput sustaining meaningful reductions due to security risk
- Houthi activation confirmed at Bab el-Mandeb, closing the second corridor
- OPEC+ spare capacity proving insufficient to offset the combined supply loss
At $110 Brent, the inflationary transmission effects on energy-importing economies would be severe. Petrochemical feedstock costs, aviation fuel prices, and fertiliser production costs would all escalate sharply within weeks.
Scenario 2: Diplomatic Resolution (Brent Falls to the $60s)
Goldman Sachs's downside case envisions Brent retreating to the $60s by year-end if tensions ease and Iranian production recovers faster than anticipated. Regional mediation efforts are ongoing, and the consensus view among market participants currently holds that full-scale war remains unlikely.
This scenario carries its own risks for investors. Traders holding significant long positions in crude futures face substantial reversal exposure if diplomatic progress accelerates unexpectedly. Historical analogies from prior Middle East tension cycles, including the 2019 Abqaiq attack and various 2020 US-Iran flashpoints, demonstrate that oil price spikes driven by geopolitical fear can correct sharply and rapidly once the fear premium deflates.
Scenario 3: Prolonged Stalemate (Brent Anchored at $80 to $90)
Hiroyuki Kikukawa, chief strategist of Nissan Securities Investment, offered a more granular near-term assessment, suggesting WTI could rise to $85 to $87 depending on how the conflict develops. This middle-path scenario assumes no full-scale war and no full resolution, with the conflict remaining contained but unresolved over an extended period.
This prolonged stalemate scenario may actually represent the most structurally damaging outcome for global energy-importing economies, precisely because it offers no clear timeline for resolution. Oil sustained at $85 to $90 per barrel over two to three quarters feeds persistently into consumer price indices, complicating central bank rate-cutting cycles in the US, EU, and across Asia-Pacific.
How Are Sanctions and Supply Fundamentals Compounding the Price Pressure?
The Sanctions Revocation Factor
Beyond the physical supply disruption risk, a parallel legal mechanism is simultaneously removing Iranian crude from the global supply pool. The US Treasury's revocation of the 60-day waiver on Iranian oil sanctions eliminates Tehran's legal export pathways, cutting off volumes that had been flowing into global markets under the temporary waiver arrangement.
Nations that had been purchasing Iranian oil under that waiver now face the prospect of secondary sanctions exposure, meaning restrictions on access to the US financial system. This creates a chilling effect on Iranian oil purchases that extends well beyond the direct sanction targets, as third-party buyers calculate whether the commercial benefit of discounted Iranian crude outweighs the compliance and reputational risk. Consequently, the intersection of oil trade and geopolitics has rarely been more acutely felt across global procurement desks.
What the EIA Inventory Data Actually Tells Us
The US Energy Information Administration reported that crude oil inventories fell by 1.7 million barrels in the week ending July 10, 2026. That number looks bullish in isolation, but the context matters: analysts had expected a draw of 2.6 million barrels.
The inventory draw coming in roughly 35 percent below expectations is a nuanced signal. In a purely supply-demand framework, it suggests US domestic demand may be moderating even as geopolitical supply fears intensify. This creates a partially offsetting dynamic that helps explain why the rally, while sustained over four sessions, has been measured rather than explosive.
The inventory trajectory over the next four to six weeks will function as a real-time referendum on whether US demand is genuinely softening or whether the below-expectation draw was a one-week anomaly. A return to draws meeting or exceeding analyst expectations would remove the demand-softening counterargument and potentially accelerate upward price movement.
What Are the Broader Macroeconomic Consequences of Sustained High Oil Prices?
Inflation and Central Bank Dilemma
Oil prices above $85 to $90 per barrel historically begin feeding into headline inflation within six to twelve weeks, as transportation costs, energy-intensive manufacturing inputs, and petrochemical derivatives reprice upward. This creates a particularly uncomfortable scenario for central banks that had been navigating toward rate-cutting cycles on the basis of declining inflation trends.
Emerging market economies face the sharpest exposure. Nations with limited foreign exchange reserves and high oil import dependency, including several South Asian and Sub-Saharan African economies, face acute fiscal stress as their import bills escalate in dollar terms simultaneously with potential currency depreciation pressure. In addition, revised OPEC demand forecasts have done little to reassure markets that the supply side can absorb the current geopolitical shock without significant price consequences.
Global Shipping and Trade Economics Under Pressure
The effects of the current escalation extend well beyond crude oil pricing itself:
- Tanker rate premiums for Persian Gulf routes have begun rising as vessels demand higher compensation for war-risk exposure
- Marine insurance war-risk premiums for vessels transiting the Persian Gulf are escalating, adding direct cost to every barrel moved through the region
- Petrochemical feedstock costs are rising in tandem with crude, affecting plastics, synthetic fibres, and chemical manufacturing globally
- Aviation fuel pricing is tightening, with implications for airfare costs and airline profitability across the current peak Northern Hemisphere summer travel season
- Fertiliser production faces disruption risk, given that natural gas, which is closely linked to LNG transit through Hormuz, is the primary feedstock for ammonia-based fertilisers
However, as the BBC has noted, oil prices rise after US strikes on Iran has become a recurring pattern throughout the conflict's escalatory phases, with each new development resetting the baseline for market risk assessment.
The next major ASX story will hit our subscribers first
Frequently Asked Questions: Oil Prices and the US-Iran Conflict
Why do oil prices rise after US strikes on Iran?
Military action against Iran raises the probability of supply disruptions through the Strait of Hormuz, which handled approximately one-fifth of global oil and LNG trade before hostilities escalated. When physical supply routes face a credible security threat, futures markets immediately embed a geopolitical risk premium into price discovery, even before any actual supply disruption occurs.
How high could oil go if Hormuz throughput is significantly reduced?
Goldman Sachs has modelled Brent crude exceeding $110 per barrel in Q4 2026 under a sustained disruption scenario. A full Hormuz closure affecting up to 15 million barrels per day would represent an unprecedented supply shock with no available substitute routing at equivalent scale.
What is the significance of the Bab el-Mandeb threat?
If Iran activates Houthi allies to threaten the Bab el-Mandeb simultaneously with Hormuz disruptions, it places two of the world's most critical maritime energy corridors under threat at the same time. The compounding logistical and insurance cost impact of this dual-chokepoint scenario would amplify supply risk pricing non-linearly.
What does the EIA inventory figure reveal about market dynamics?
The reported draw of 1.7 million barrels against an expected draw of 2.6 million barrels suggests US domestic demand may be moderating. This demand-softening signal provides a partial counterweight to the geopolitical supply risk premium, helping explain the measured rather than explosive nature of the current rally.
What is the Goldman Sachs downside scenario?
If tensions ease and Iranian production recovers faster than anticipated, Goldman Sachs projects Brent could retreat to the $60s by year-end. The speed and durability of any diplomatic resolution, and the pace of supply normalisation, would determine how quickly prices correct toward that lower range.
Disclaimer: This article contains forward-looking scenario analysis, price projections, and geopolitical risk assessments sourced from third-party analysts including Goldman Sachs and Nissan Securities Investment. These projections involve significant uncertainty and should not be interpreted as investment advice. Oil markets are subject to rapid change driven by geopolitical, macroeconomic, and logistical factors that are inherently unpredictable. Readers should conduct independent research and consult qualified financial advisers before making investment decisions.
Want to Capitalise on the Next Major Resource Discovery Before the Market Does?
While geopolitical forces reshape global energy markets, Discovery Alert's proprietary Discovery IQ model scans ASX announcements in real time, instantly identifying significant mineral discoveries and turning complex data into actionable investment opportunities — whether you're a short-term trader or a long-term investor. Explore how historic discoveries have generated substantial returns and begin your 14-day free trial today to position yourself ahead of the broader market.