June 30, 2026
The Monetary System Gold Actually Lives In
Most conversations about why gold is so expensive begin and end in the wrong place. They reach for geology, they gesture at scarcity, and they stop there. Gold is rare, the argument goes, therefore it is valuable. This explanation is accurate in the way that describing the ocean as wet is accurate: technically correct, operationally useless.
The real answer to why gold commands the price it does in 2026 sits inside the architecture of the global monetary system itself. Gold does not exist in isolation. It competes, continuously, against every other asset class available to sovereign institutions, pension funds, retail investors, and central banks worldwide. Understanding gold in the monetary system means understanding the terms of that competition, and why those terms have fundamentally shifted since 2022.
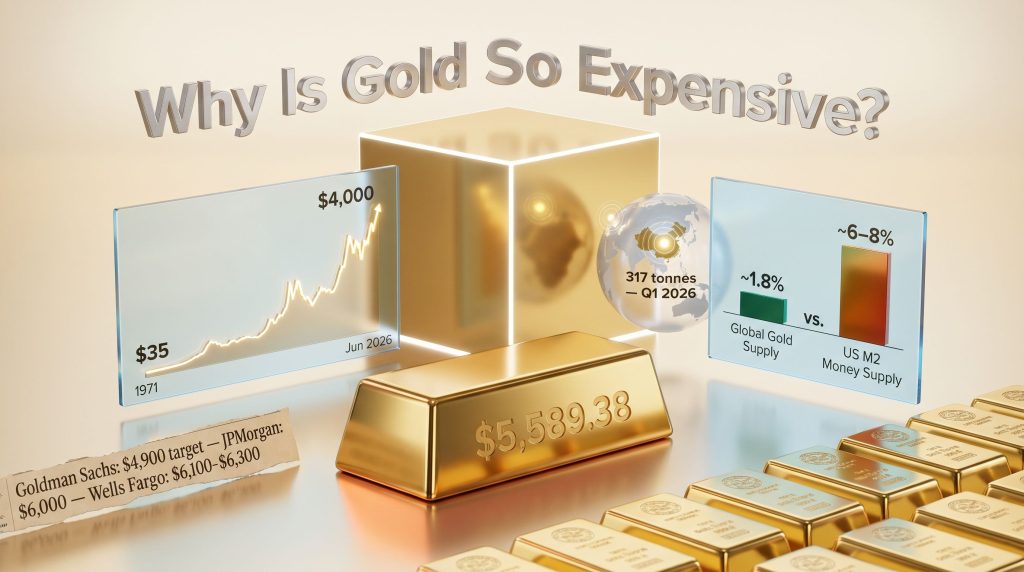
Five interlocking forces shape the gold price: physical supply constraints, the real interest rate mechanism, structural central bank demand, US dollar dynamics, and long-run monetary debasement. Each reinforces the others. Together, they drove gold to an all-time high of $5,589.38 per ounce on 28 January 2026 and they explain why gold trades near $4,000 per ounce in June 2026, still far above its inflation-adjusted historical averages.
When big ASX news breaks, our subscribers know first
The Geological Ceiling That Capital Cannot Break
Begin with a number almost nobody knows: approximately 220,000 tonnes. That is the total estimated volume of gold ever extracted from the earth across the entirety of human history, according to the World Gold Council's 2025 figures. Compressed into a single geometric shape, this quantity would form a cube roughly 22 metres per side, roughly the height of a six-storey building.
Five thousand years of cumulative human effort, captured in a space smaller than many suburban warehouses.
Why Mine Production Cannot Close the Gap
Global gold mine output reached a record 3,672 tonnes in 2025, according to the World Gold Council's Gold Demand Trends Full Year 2025 report. Expressed as a proportion of existing above-ground stock, that represents an annual supply growth rate of approximately 1.8%. This constraint is geological, not economic. No combination of capital investment, advanced drilling technology, or corporate ambition can meaningfully accelerate the natural processes that concentrate gold ore in economically recoverable deposits.
This distinction matters enormously when comparing gold to other commodities. For oil, copper, or lithium, a sustained period of high prices triggers massive capital deployment that eventually produces new supply. The feedback loop constrains prices over medium-term cycles. For gold, however, the feedback loop is severely attenuated. Higher prices attract more exploration, but the geology does not cooperate on demand. Deposits of economically viable grade are finite, difficult to find, and take a decade or more to bring into production.
Consider the contrast below:
| Metric | Annual Growth Rate (Approx.) |
|---|---|
| Global gold mine supply | ~1.8% |
| US M2 money supply (2020-2024 average) | ~6-8% |
| Global GDP (nominal, 2024) | ~5-6% |
| US federal debt (2020-2025 average) | ~8-10% |
The asymmetry is striking. The monetary system expands at multiples of the rate at which new gold enters the world. This is the foundational supply-demand dynamic that makes why gold is so expensive not a moment in time, but a structural condition.
The Reserve Function Other Metals Cannot Access
Silver, platinum, and palladium are all scarce relative to base metals. However, their pricing is overwhelmingly driven by industrial demand cycles, and they remain exposed to substitution risk as technologies evolve. Gold occupies a categorically different position. Central banks globally hold approximately 37,755 tonnes of gold as official monetary reserves (World Gold Council, 2025). No equivalent institutional reserve function exists for any other precious metal, and none ever has.
| Metal | Primary Price Driver | Central Bank Reserve Holdings | Annual Mine Supply |
|---|---|---|---|
| Gold | Monetary reserve + store of value | ~37,755 tonnes | ~3,672 tonnes |
| Silver | Industrial demand (60%+) | Negligible | ~25,000+ tonnes |
| Platinum | Automotive/industrial | Negligible | ~180 tonnes |
| Palladium | Automotive catalysts | Negligible | ~210 tonnes |
This institutional demand category is entirely inaccessible to industrial metals. It is also, as the next section explains, precisely why gold's price trajectory since 2022 has defied the predictions of traditional valuation models. For a deeper look at how gold and bond dynamics interact within these valuation frameworks, the relationship between real yields and reserve demand is equally instructive.
Real Yields, Not Nominal Rates: The Correct Analytical Framework
A persistent error among investors approaching gold for the first time is comparing its zero yield against the nominal coupon on a government bond. At 4-5% nominal yields, the comparison appears straightforward and unflattering for gold. This framing is analytically incorrect.
The relevant comparison is gold versus real yields: what a bond actually pays after the erosive effect of inflation is subtracted. The cleanest available proxy for this figure is the 10-year Treasury Inflation-Protected Securities (TIPS) yield in the United States.
What the TIPS Yield Actually Measures
When real yields approach zero or turn negative, government bonds are no longer preserving purchasing power for their holders. In that environment, gold's zero nominal yield becomes genuinely competitive, because at least gold does not actively destroy the real value of savings held in it. PIMCO's regression analysis covering 2004 through 2025 confirms this relationship with statistical precision: a 100-basis-point increase in 10-year real yields has historically corresponded to approximately an 18% decline in the inflation-adjusted gold price (PIMCO, Understanding Gold Prices).
The Federal Reserve's near-zero rate environment following the 2008 financial crisis pushed real yields deeply into negative territory. The gold market's response was unambiguous: from roughly $250 per ounce in 2001, the price climbed to over $1,900 by 2011 as real returns on bonds evaporated.
The 2022-2026 Anomaly: When One Model Became Insufficient
By mid-2026, the 10-year TIPS yield had climbed to approximately 2%, a level the historical data would predict to be meaningfully suppressive for gold. Instead, gold reached its all-time nominal high in January 2026. The real yield model did not break down. It remained valid. However, a second force of considerably greater structural magnitude entered the market and overrode its near-term signal.
The real yield framework is best understood as a necessary but no longer sufficient explanation for gold pricing in the current cycle. A structural demand shift has emerged that the yield model was not designed to capture, and conflating the two produces systematically wrong conclusions.
Central Banks and the Structural Demand Revolution
The single most consequential change in the gold market over the past four years is not a shift in retail sentiment, ETF flows, or jewellery demand. It is the behaviour of sovereign institutions. Furthermore, central bank gold demand has fundamentally altered the structural floor beneath the market in ways that traditional models were not designed to anticipate.
The Scale of Sovereign Accumulation
Central banks globally purchased more than 1,000 tonnes of gold per year across 2022, 2023, and 2024, according to World Gold Council data. This pace is approximately double the average annual purchases of the prior decade. To appreciate the magnitude: global annual mine production runs at roughly 3,600 tonnes. At peak institutional buying, sovereign entities alone were absorbing close to 30% of all newly mined gold before any retail buyer, ETF, or jewellery manufacturer participated.
In 2025, central bank purchases moderated to 863 tonnes as elevated prices prompted some caution. Even at this reduced pace, sovereign buying ran at nearly double the pre-2022 baseline of approximately 473 tonnes per year (World Gold Council, Central Banks Full Year 2025).
Why Sovereign Demand Creates a Qualitatively Different Price Floor
Not all gold buyers are equal in their effect on price. The table below illustrates why central bank demand is uniquely powerful as a structural floor mechanism:
| Buyer Type | Price Sensitivity | Typical Holding Horizon | Liquidation Trigger |
|---|---|---|---|
| Retail investor | High | Months to years | Price decline, liquidity need |
| Gold ETF holder | Medium-High | Months to years | Risk-off rotation |
| Central bank | Very Low | Decades | Strategic policy reversal |
Central banks pursue multi-decade reserve diversification mandates. They do not liquidate positions when prices dip 10% in a week. Their demand does not respond to quarterly earnings guidance or short-term macro signals. This price-insensitivity makes sovereign buying structurally different from every other category of gold demand, and it is why the World Gold Council's 2026 survey of 76 central banks carries significant forward-looking weight: 89% of those surveyed expected global gold reserves to increase, a record high reading.
The Geopolitical Catalyst Behind the Shift
The acceleration in central bank buying traces to a single event in February 2022: the freezing of Russia's foreign currency reserves by Western governments. The sum involved was approximately $300 billion in offshore dollar-denominated assets. The institutional conclusion drawn by sovereign reserve managers globally was precise and consequential: assets held in foreign jurisdictions in foreign currencies carry confiscation risk that domestically vaulted physical gold does not.
The People's Bank of China's response was systematic. By April 2026, it was purchasing approximately 8 tonnes of gold per month in net terms. Chinese net gold imports reached 317 tonnes in Q1 2026 alone, approximately three times the pace of the preceding quarter, according to JPMorgan Global Research data from May 2026. This is not speculative portfolio rotation driven by macro sentiment. It is deliberate reserve architecture responding to a documented and permanent shift in the geopolitical risk calculus surrounding dollar-denominated assets.
Dollar Dynamics: The Mechanical Transmission Channel
Because gold is globally priced in US dollars, the dollar's strength or weakness functions as an automatic multiplier on international gold demand. A weaker dollar simultaneously makes gold more affordable for every non-US buyer in the world, whether that buyer is a Japanese pension fund, a European central bank, or an Indian household. This multiplier effect means dollar weakness amplifies demand from dozens of directions at once.
Quantifying the Federal Reserve's Influence
Goldman Sachs Global Investment Research has quantified this transmission channel directly: every 50 basis points of Federal Reserve rate easing adds approximately $120 per ounce of gold price support (Goldman Sachs Global Investment Research, June 2026). The mechanism operates through two simultaneous channels: rate cuts weaken the dollar, and they compress real yields. Both forces act on gold in the same direction at the same time, creating a compounded effect that exceeds what either channel would produce independently.
The fiscal backdrop reinforces this dynamic on a structural timescale. US federal debt exceeded $36 trillion as of June 2026, with annual interest payments surpassing $1 trillion. This fiscal trajectory creates persistent pressure on the dollar's long-run purchasing power that operates independently of any single rate decision.
Goldman Sachs identifies three structural pillars of its bullish gold thesis: central bank buying, de-dollarisation across emerging market reserve portfolios, and what it terms the debasement trade. These three forces are not independent. They compound each other, and all three point in the same direction.
Monetary Debasement: The Engine Beneath Every Cycle
Monetary debasement is a structural condition, not a cyclical event. It describes the progressive erosion of a currency's purchasing power through persistent deficit financing and monetary expansion, and it is the long-run engine that underlies every gold price cycle regardless of where real yields sit at any given moment.
The 1971 Baseline and What It Reveals
August 1971 provides the essential reference point. The end of the gold standard under President Nixon severed the US dollar's convertibility to gold, removing the last institutional constraint on monetary expansion that had existed in the post-war financial architecture. What followed is empirically documented.
The dollar has lost approximately 87% of its purchasing power since 1971, according to Bureau of Labor Statistics CPI data. What $1 purchased in 1971 requires approximately $8.22 to replicate today. Gold in 1971 traded at roughly $35 per ounce. Gold in June 2026 trades at approximately $4,000 per ounce, a nominal increase exceeding 11,000%.
Gold's nominal price increase is the product of two compounding forces acting simultaneously: genuine scarcity relative to growing demand, and a shrinking monetary measuring stick. Separating these two forces is essential for determining whether gold is truly expensive or whether the dollar has simply become less capable of measuring value accurately.
Purchasing Power Stability Across Centuries
The most enduring empirical observation about gold is not its price performance in any single decade. It is the remarkable stability of its purchasing power across centuries. One ounce of gold has historically purchased approximately the same basket of quality goods across dramatically different historical periods, from classical antiquity through the industrial revolution to the present.
Quality clothing, professional services, and staple commodities have all maintained rough parity with an ounce of gold across timescales that render any paper currency comparison meaningless. This stability is not coincidence. It reflects the interaction of fixed supply growth, universal cultural recognition, and the absence of any issuing authority capable of diluting it. For further context on why gold retains its value across such extended timeframes, the historical record provides compelling evidence.
The next major ASX story will hit our subscribers first
Valuation Models: Three Lenses on the Current Price
Determining whether gold is expensive requires specifying the measuring framework, because different valuation models produce different conclusions simultaneously. Three frameworks currently relevant are:
| Valuation Model | Current Signal | Implication |
|---|---|---|
| 10-Year TIPS Real Yield | ~2% (historically suppressive) | Structural demand overriding yield signal |
| Gold-to-M2 Money Supply Ratio | Below historical average | Potential undervaluation relative to monetary expansion |
| Gold-to-Dow Ratio | Above 1:1 threshold | Not at historical cycle peak levels |
The inflation-adjusted comparison is equally instructive. The 1980 gold price peak of $850 per ounce equates to approximately $3,200 in today's dollars using Bureau of Labor Statistics CPI data. The current price of around $4,000 has already surpassed that level in real terms, yet relative to the expansion of US equity market valuations, M2 money supply growth, and federal debt since 1971, gold has not proportionally tracked the expansion of financial assets, an argument frequently cited by analysts positioning for continued structural upside.
What Major Institutional Forecasts Imply
Every major financial institution with a published gold price target for 2026 sits meaningfully above the current spot price:
- Goldman Sachs: year-end 2026 target of $4,900 per ounce (revised June 2026, citing softening ETF inflows)
- JPMorgan: $6,000 per ounce target for Q4 2026
- Wells Fargo: $6,100-$6,300 per ounce range
- Bank of America: $6,000 per ounce target
These institutions are not collectively arguing that gold is cheap. They are arguing that the structural forces behind its current pricing have further to run. Forecasts of this nature carry inherent uncertainty and should not be interpreted as guarantees of future performance.
How the Gold Price Is Actually Set
Gold's price is not determined by any single authority, government, or institution. It emerges from the aggregate of buy and sell orders flowing through a decentralised global market with two primary venues. The LBMA and COMEX markets together form the backbone of global gold price discovery, processing enormous volumes daily across both physical and derivatives markets.
The London over-the-counter market processes approximately $180 billion in daily trading volume. The COMEX futures exchange in New York handles approximately $114 billion per day (World Gold Council, Gold Market Primer 2025). The London Bullion Market Association publishes the LBMA Gold Price benchmark twice daily, and this figure serves as the reference rate for gold contracts, ETFs, mining company revenue calculations, and central bank reserve valuations worldwide.
Arbitrage mechanisms ensure prices remain consistent across venues and time zones. The decentralised nature of this market means no single actor can sustainably manipulate the price, because any deviation from fair value immediately creates profit opportunities that market participants close.
What Would Reverse the Current Price Architecture
Understanding why gold is so expensive also requires understanding what conditions would cause it to become significantly less so. Four forces would need to converge simultaneously:
- Real interest rates sustained well above 2% over a multi-year horizon
- A sustained and significant US dollar rally
- A reversal of central bank reserve diversification mandates
- Persistent and large-scale ETF outflows from Western institutional holders
Goldman Sachs identifies sustained hawkish Federal Reserve policy triggering Western ETF outflows as the primary downside risk scenario for gold (Goldman Sachs Global Investment Research, June 2026). The critical observation is that the simultaneous convergence of all four conditions has not occurred at any point during the current bull market cycle, and reversing central bank buying mandates in particular would require a geopolitical environment dramatically different from the one that triggered them in 2022. Consequently, analysts tracking factors driving gold prices continue to weight structural demand as the dominant variable in their forward models.
Frequently Asked Questions About Gold's Price
Does gold automatically rise when inflation increases?
Gold functions as a long-duration inflation hedge rather than a short-term CPI tracker. The variable that matters most is the real interest rate, not the nominal inflation figure. When central banks raise rates faster than inflation increases, real yields rise and gold can underperform, as it did in 2022. The PIMCO regression covering 2004 through 2025 identifies the 10-year TIPS yield as the most reliable short-to-medium-term signal for gold pricing.
Is the current gold price a speculative bubble?
A speculative bubble requires price disconnection from verifiable fundamentals. Gold's current price rests on three independently verifiable pillars: sovereign reserve purchases tracked in IMF reserve disclosures, physical demand confirmed by mining production data, and a monetary environment that has structurally shifted since 2022. These pillars do not guarantee future price appreciation, but they do establish that the current price level has a traceable, non-arbitrary foundation.
Why is gold more expensive than silver, platinum, and palladium?
Two factors separate gold structurally. First, its supply growth rate of approximately 1.8% annually is exceptionally constrained even relative to other precious metals. Second, and more importantly, gold performs a monetary reserve function that no other metal replicates. Central banks hold approximately 37,755 tonnes of gold as official reserves. The equivalent figure for silver, platinum, and palladium is negligible. This institutional demand category is entirely inaccessible to industrial metals and creates a permanent demand floor with no analogue elsewhere in the metals complex.
This article is intended for informational purposes only and does not constitute financial or investment advice. All price forecasts cited are sourced from third-party institutions and involve inherent uncertainty. Past performance is not indicative of future results. Readers should consult a qualified financial adviser before making any investment decisions.
Want To Be Alerted The Moment The Next Major Gold Discovery Hits The ASX?
Discovery Alert's proprietary Discovery IQ model scans ASX announcements in real time, instantly notifying subscribers of significant mineral discoveries — including gold — so they can act ahead of the broader market. Explore historic discovery returns to see what's possible, then start a 14-day free trial at Discovery Alert and position yourself at the forefront of the next major find.