August 5, 2026
The Real Yield Mechanism: Why Gold Prices Are Never Driven by Just One Thing
Precious metals veterans will tell you that the most durable gold rallies are rarely sparked by a single headline. They emerge when several independent market forces converge simultaneously, each amplifying the others. Understanding why is gold rising today requires looking beneath the surface of any single data release or geopolitical development and examining the interconnected machinery that actually sets prices in motion.
On August 4, 2026, that machinery is running hard. Five distinct forces are pushing in the same direction at once: a fractured Federal Reserve policy outlook, a pivotal labour market data release, a geopolitical situation in the Strait of Hormuz that defies easy interpretation, a weakening US dollar, and a structurally undervalued silver market amplifying the move. Together, they explain why gold is trading near $4,080 to $4,150 and silver is outpacing it by a ratio of roughly three to one.
When big ASX news breaks, our subscribers know first
The Federal Reserve's Fractured Consensus Is the Master Variable
To understand gold's current trajectory, start with interest rates, specifically with the concept of real yields. Real yields represent the return on government bonds after accounting for inflation expectations. When real yields rise, the opportunity cost of holding non-yielding assets like gold increases, and prices typically fall. Furthermore, when real yields compress or the path toward higher yields becomes uncertain, gold finds support. Understanding gold and bond dynamics is therefore central to any serious analysis of precious metals pricing.
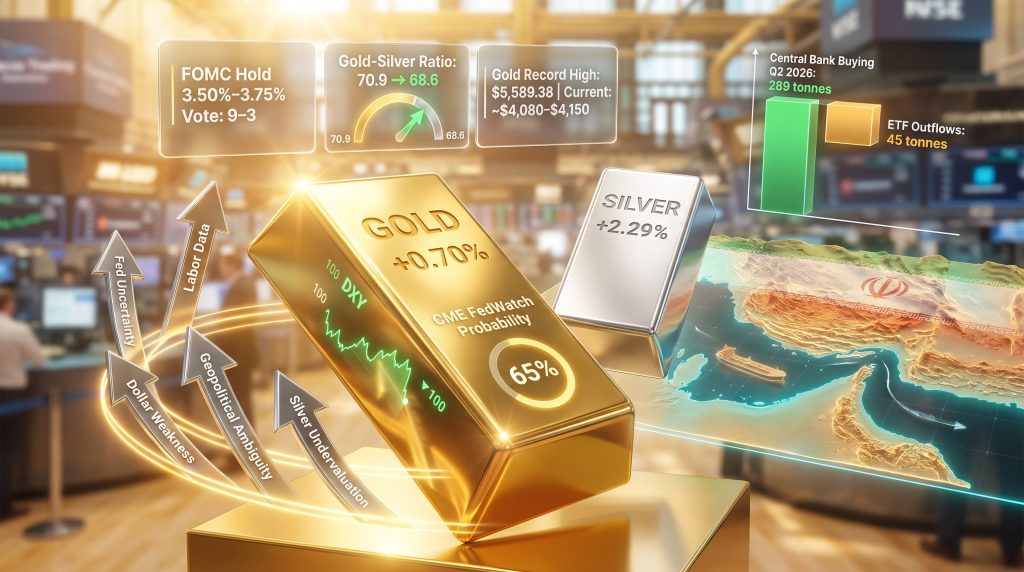
That uncertainty is front and centre right now. At its July 29, 2026 meeting, the Federal Open Market Committee voted to hold the federal funds rate at 3.50% to 3.75%. The vote split was 9 to 3, with three regional Federal Reserve presidents — specifically Beth Hammack of the Cleveland Fed, Neel Kashkari of the Minneapolis Fed, and Lorie Logan of the Dallas Fed — voting in favour of an immediate rate increase. This kind of dissent is historically uncommon and carries meaningful signal value.
What a 9-to-3 FOMC Split Actually Means for Gold
A three-dissenter FOMC outcome is not merely a procedural curiosity. Reviewing prior Fed cycles, dissent at this scale has often preceded a shift in the majority position within one or two subsequent meetings. The dissenters' shared concern that inflation is not sufficiently on track toward the 2% target creates what analysts describe as a policy ceiling for gold: a level above which sustained price appreciation becomes difficult when rate-hike probability remains elevated.
As of August 4, 2026, the CME Group FedWatch Tool places the probability of a September rate hike at approximately 65%. That single figure functions as the fulcrum around which every incoming data release is being assessed. Every labour market print, inflation report, and geopolitical development is being filtered through one question: does this raise or lower the 65% figure?
Key Insight: The 65% September hike probability creates a binary risk environment for gold. Incoming data that softens that figure gives gold room to advance; data that hardens it rebuilds the headwind. This is why individual data releases carry outsized market impact during contested policy cycles.
What the June 2026 JOLTS Report Means for Gold Right Now
The Bureau of Labor Statistics released its June 2026 Job Openings and Labour Turnover Survey at 10:00am ET on August 4, 2026. The market consensus forecast called for 7.44 million job openings, down from 7.6 million in May 2026.
The JOLTS report matters in this specific cycle because it is the first hard labour market data to land since the July 29 FOMC split. The Fed's dual mandate connects employment strength directly to the inflation-fighting rate argument: a robust labour market supports the case that the economy can absorb further tightening.
The transmission from JOLTS to gold prices works through the following pathway:
| JOLTS Outcome | Effect on September Hike Odds | Expected Gold Response |
|---|---|---|
| Below 7.44M (soft print) | Odds fall below 65% | Gold gains room toward $4,150 |
| Around 7.44M (in-line) | Probability largely unchanged | Gold holds current range |
| Above 7.6M (strong print) | September case strengthens | Near-term gold headwind builds |
What makes this JOLTS release different from prior ones is the policy context in which it lands. Previous JOLTS reports arrived during rate-cutting or rate-hold environments where the interpretation was relatively straightforward. This one lands while three Federal Reserve presidents are actively advocating for an immediate hike. Friday's Non-Farm Payrolls report serves as the next critical data gate after JOLTS, representing the definitive labour market read that will either confirm or challenge September hike pricing.
The Strait of Hormuz Situation: Three Contradictory Signals at Once
Geopolitical risk rarely feeds directly into gold prices. The more common pathway runs through oil, then inflation expectations, then rate-hike probability, and finally into gold. Understanding this indirect channel is essential to interpreting what the Hormuz situation is actually doing to metals prices on August 4, 2026.
US Treasury Secretary Scott Bessent stated on CNBC's Squawk Box that a commercial shipping agreement covering the Strait of Hormuz could be finalised within the next day or two. Oil prices declined on the back of those comments. Within hours, UK Maritime Trade Operations confirmed that a cargo vessel had reported being struck by an unknown projectile in the strait. Iran's Foreign Ministry spokesperson then publicly denied that Tehran is engaged in direct negotiations with Washington.
The result is a three-signal contradiction that markets are actively pricing:
- A senior US official signals imminent diplomatic resolution
- A vessel is struck in the same waterway the deal is meant to protect
- The counterparty denies the negotiations exist
The indirect price pathway from Hormuz to gold looks like this:
Hormuz De-escalation Signal
        ↓
   Oil Price Declines
        ↓
Inflation Pressure Eases
        ↓
September Hike Odds Soften
        ↓
  Gold Price Firms
The measured price action on August 4 — gold up 0.70% and silver up 2.29% — reflects precisely this ambiguity. These are not euphoric moves. Consequently, sustained geopolitical ambiguity is structurally supportive for gold because it maintains safe-haven gold demand without triggering a sharp oil spike that would accelerate rate-hike pricing.
Dollar Weakness at DXY 100: The Quiet Amplifier
The US Dollar Index was trading near 100 on August 4, 2026, its weakest level in approximately seven weeks, following five consecutive sessions of decline. Two structural forces drove this weakness: coordinated US-Japan yen-buying operations and the July 29 FOMC hold decision, which trimmed the interest rate differential that had been sustaining dollar strength.
The mechanical link between dollar softness and gold demand is straightforward but often underappreciated. Because gold is priced globally in US dollars, a weaker dollar effectively reduces the purchase cost for buyers transacting in euros, Japanese yen, Chinese yuan, and other currencies. Lower effective cost translates into broader international demand, which creates upward price pressure.
Compounding Effect: When dollar weakness, softening rate-hike odds, and geopolitical uncertainty all point simultaneously toward gold, the combined demand signal is structurally stronger than any single driver operating alone. This convergence is the defining condition on August 4, 2026.
What DXY Near 100 Has Historically Signalled
The 100 level on the Dollar Index carries psychological significance as a long-observed threshold. Periods in which the DXY has sustained readings at or below 100 have historically coincided with extended outperformance phases for precious metals. This pattern reflects the broader macro environment in which dollar weakness tends to emerge: slowing US economic exceptionalism, narrowing rate differentials with other major economies, and reduced demand for dollar-denominated safe assets.
Why Silver Is Outperforming Gold by a 3-to-1 Margin
Gold's 0.70% gain on August 4 looks modest beside silver's 2.29% advance. The gold-silver ratio moved from approximately 70.9 to 68.6 in a single session. In-depth gold-silver ratio analysis reveals two independent forces behind silver's amplified response.
Force 1: Industrial Demand Sensitivity to the Rate Cycle
According to the Silver Institute's World Silver Survey 2026, approximately 58% of global silver demand is derived from industrial applications. This includes solar photovoltaic panels, electronics manufacturing, electric vehicle components, and medical devices. The proportion of demand that is industrially driven means silver is more directly sensitive to the economic growth outlook than gold, which functions almost exclusively as a monetary and safe-haven asset.
When rate-hike probability softens, the marginal improvement in the economic growth outlook benefits industrial metals more directly than pure monetary metals. Easing oil prices simultaneously reduce input cost pressure for manufacturers, providing an additional tailwind for the industrial demand picture. For instance, Reuters gold market coverage has highlighted this industrial sensitivity as a recurring theme across recent precious metals cycles.
Force 2: Structural Undervaluation Against Historical Norms
The gold-silver ratio at 68.6 remains meaningfully above its 50-year historical average of approximately 60. This gap reflects a structural valuation discount for silver relative to gold that has persisted through the current cycle.
| Metric | Current Reading | Historical Benchmark | Signal |
|---|---|---|---|
| Gold-Silver Ratio | 68.6 | ~60 (50-yr average) | Silver structurally undervalued |
| Silver Daily Performance | +2.29% | N/A | Approximately 3x gold's daily gain |
| Silver Industrial Demand | ~58% of total | N/A | High rate-cycle sensitivity |
| Gold Daily Performance | +0.70% | N/A | Measured monetary asset response |
A lesser-known dynamic worth noting: ratio compression from elevated levels above 70 toward the historical average has, in prior precious metals bull cycles, tended to accelerate during the later stages of gold's advance. However, ratio normalisation unfolds over months to years rather than sessions and should not be interpreted as a short-term trading signal.
The next major ASX story will hit our subscribers first
What NY Fed President Williams Signalled and Why It Still Matters
On August 3, 2026, New York Federal Reserve President John Williams stated that monetary policy remains well positioned to deliver price stability, whilst adding the conditional language that markets have been tracking most closely: if inflation fails to track toward the 2% target, the Fed will take the necessary steps to restore it. Williams is not a 2026 FOMC voting member, yet his statements carry weight nonetheless.
The reason non-voter Fed statements move gold markets is rooted in how the Federal Reserve communicates policy. The institution operates through a distributed network of officials whose public statements collectively shape market expectations. When a high-profile non-voter like the New York Fed president uses language that precisely mirrors the July 29 dissenters' framing, it signals broader internal alignment than the vote count alone implies.
For gold holders, Williams' conditional language confirms that the rate-hike mechanism has been paused, not retired. Friday's payrolls report represents the next input into that conditional equation.
Gold's 27% Drawdown: Correcting the Most Common Misread
Gold reached a record high of $5,589.38 in January 2026. Trading near $4,080 to $4,150 on August 4, 2026, represents a drawdown of approximately 27% from that peak. That figure sounds alarming in isolation and has driven considerable retail pessimism about the bull market's durability.
The critical reframe, however, is this: measured from year-end 2025, gold is down approximately 5%. The distinction separates a within-bull-market consolidation driven by a specific identifiable mechanism from a genuine trend reversal. This is precisely why is gold rising today a question worth contextualising against longer time horizons.
| Metric | Value | Contextual Interpretation |
|---|---|---|
| January 2026 Record High | $5,589.38 | All-time peak |
| August 4, 2026 Trading Range | ~$4,080-$4,150 | Current price level |
| Drawdown from Peak | ~27% | Driven by real yield mechanism |
| Decline from Year-End 2025 | ~5% | Within-bull-market consolidation |
| Central Bank Buying Q2 2026 | 289 tonnes | Structural institutional accumulation |
| Gold ETF Outflows Q2 2026 | 45 tonnes | Tactical retail repositioning |
The structural demand picture tells a story that is easy to miss when focusing on spot price alone. In Q2 2026, central bank gold demand reached 289 tonnes whilst ETFs shed 45 tonnes, producing a roughly 6-to-1 institutional accumulation ratio even as retail investors were reducing exposure. Central banks do not buy gold for short-term yield. The continuation of that buying through a 27% price decline is a meaningful signal that institutional conviction in the structural bull case remains intact.
The Upcoming Catalyst Sequence Every Gold Investor Should Track
The next several days contain the data releases and geopolitical developments that will determine gold's near-term direction:
- August 4, 2026, JOLTS Report (10:00am ET): First hard labour data since the FOMC split; the immediate gold reaction serves as a live read on institutional positioning
- Approximately August 8, 2026, Non-Farm Payrolls Report: The definitive labour market input that will either sustain or erode the 65% September hike probability
- Ongoing, Strait of Hormuz developments: Any confirmed resolution removes the oil-inflation channel supporting gold; any escalation reintroduces it
- Ongoing, US Dollar Index trajectory: Sustained DXY weakness below 100 maintains the international demand tailwind independently of rate dynamics
Gold's real-time reaction to JOLTS data is itself informative. A rally on a soft print confirms the rate-hike probability transmission is functioning as expected. A muted response to a soft print would suggest that other factors — potentially dollar stabilisation or progress toward a Hormuz resolution — are offsetting the rate signal. Traders monitoring the LBMA and COMEX gold markets will find these venues particularly instructive for gauging institutional sentiment during this catalyst-dense period.
Frequently Asked Questions: Why Is Gold Rising Today?
Can gold and equities rise simultaneously, and what does that tell us?
Gold and equity markets can advance in parallel when the primary catalyst is dollar weakness rather than risk-off sentiment. A weaker dollar benefits both risk assets — through improved earnings prospects for multinational corporations — and gold, through the international demand mechanism. Today's environment reflects this dynamic rather than classic safe-haven positioning. For instance, J.P. Morgan's commodities research has noted this correlation breakdown as a recurring feature of dollar-driven precious metals rallies.
Does the Hormuz situation directly cause gold prices to rise?
The relationship is indirect. Hormuz tension affects gold primarily through the oil-inflation-rate pathway. Lower oil prices from de-escalation signals reduce inflation pressure, which softens rate-hike expectations, which in turn supports gold. The relationship is mediated by monetary policy expectations rather than pure safe-haven demand alone.
Why is the gold-silver ratio considered a market stage indicator?
The gold-silver ratio measures how many ounces of silver are required to purchase one ounce of gold. When the ratio is elevated, silver is relatively cheap compared to gold on a historical basis. Periods of ratio compression from high levels toward the long-run average have historically coincided with the later, more aggressive phases of precious metals bull markets. The current reading of 68.6 against a 50-year average near 60 suggests that compression, if it continues, still has meaningful room to run.
How does the Federal Reserve's policy division affect gold's risk profile?
A divided FOMC increases the conditional nature of policy outcomes. Rather than a clear directional signal, investors face a probability distribution across scenarios. That uncertainty elevates gold's appeal as a hedge precisely because its payoff profile improves in the scenarios where policy overshoots or the economic outlook deteriorates. The 9-to-3 split amplifies this uncertainty premium considerably.
This article is for informational and educational purposes only and does not constitute financial or investment advice. All price data and probability figures referenced reflect conditions as of August 4, 2026. Past performance is not indicative of future results. Readers are encouraged to consult qualified financial advisors before making investment decisions. Live price data is available at goldsilver.com/price-charts/ and real-time rate probability data can be accessed through the CME Group FedWatch Tool at cmegroup.com.
Want to Identify the Next Major Mineral Discovery Before the Broader Market Does?
While macroeconomic forces drive gold prices, the most significant returns in the resources sector often come from being first to act on a major mineral discovery — and Discovery Alert's proprietary Discovery IQ model delivers real-time ASX discovery alerts straight to subscribers, turning complex data across 30+ commodities into clear, actionable insights. Explore historic discoveries and their extraordinary returns, then begin your 14-day free trial at Discovery Alert to position yourself ahead of the market.