
June 11, 2026
The Anomaly That Rewrote the Textbooks on Oil Market Behaviour
Every few decades, the global energy market produces a moment so structurally unusual that it forces analysts to discard their existing models entirely. The relationship between geopolitical crisis and oil price is one of the most studied correlations in all of financial economics, underpinned by decades of consistent data across every major conflict involving oil-producing nations. When that relationship breaks down, the implications extend far beyond commodity trading desks and into the very foundations of how institutions model risk, inflation, and monetary policy.
That breakdown is precisely what is unfolding right now. Understanding why oil is still below $100 a barrel more than 100 days into a conflict directly affecting the world's most critical energy chokepoint is not merely an academic exercise. It is arguably the most consequential macroeconomic puzzle of 2026, with answers that carry profound implications for central bank policy, equity market valuations, consumer price stability, and the geopolitical balance of power across multiple theatres simultaneously.
The Strait of Hormuz, which prior to hostilities carried approximately 20 million barrels per day of crude oil and refined products, handles roughly one-fifth of total global oil consumption. No modern precedent exists for its sustained closure at this scale, which makes the market's measured response genuinely extraordinary by any historical measure.
When big ASX news breaks, our subscribers know first
Historical Oil Shocks vs. the 2026 Iran Conflict: A Comparative Framework
To fully appreciate what is not happening to oil prices, it helps to understand what has happened historically when supply disruptions of far lesser magnitude struck the market.
| Historical Oil Shock | Trigger Event | Peak Price Response | Approximate Days to Peak |
|---|---|---|---|
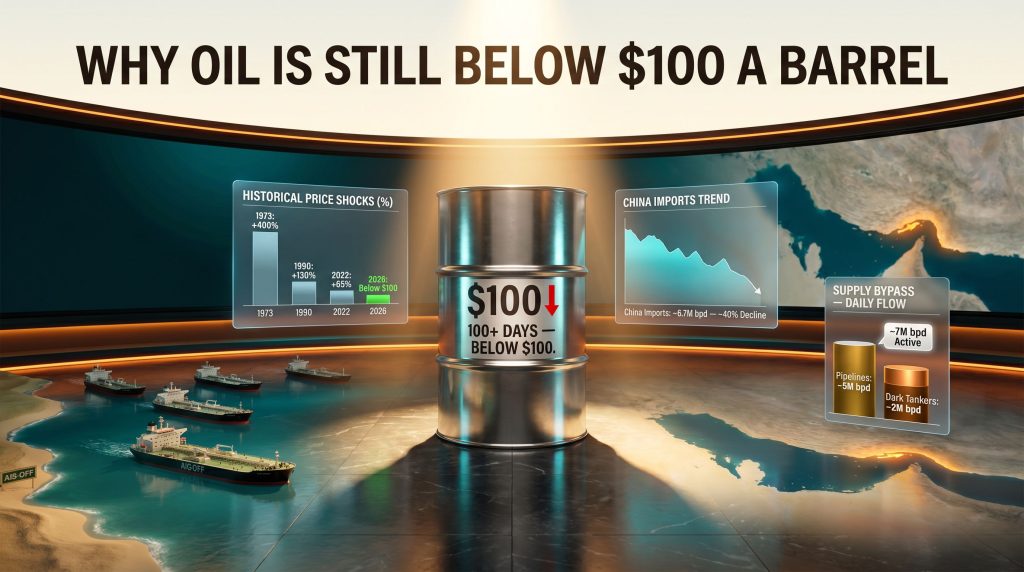
| 1973 Arab Embargo | OPEC supply cut | ~+400% | ~180 days |
| 1990–91 Gulf War | Iraq invades Kuwait | ~+130% | ~90 days |
| 2022 Russia-Ukraine | Sanctions on Russian exports | ~+65% | ~60 days |
| 2026 Iran Conflict | Strait of Hormuz disruption | Below $100 sustained | 100+ days |
Each previous event involved supply disruptions that were substantially smaller in absolute volume terms than the current closure. The 1973 Arab embargo reduced global supply by an estimated 4 to 5 million barrels per day. The Gulf War threatened but ultimately delivered a more limited physical disruption. The Russia-Ukraine sanctions affected roughly 2 to 3 million barrels per day of exported volumes. In every case, prices responded dramatically and rapidly.
The 2026 Iran conflict theoretically threatens the entire 20 million barrel per day Hormuz corridor, yet markets have remained softer than even the least severe of these historical comparisons would predict. This is not a marginal statistical deviation. It represents a fundamental regime change in how oil markets process geopolitical risk. Furthermore, current crude oil price trends suggest the structural underpinnings of this shift may be more durable than many analysts initially assumed.
The pre-existing global supply surplus of 3 to 4 million barrels per day that characterised the market entering February 27, 2026 is arguably the single most underappreciated variable in the entire current price equation. Without that cushion, virtually none of the other stabilising mechanisms described below would have been sufficient to prevent prices from breaching $100.
Ten Forces Keeping Oil Below $100 a Barrel
Force 1: China's Import Collapse Is the Central Pillar
If one variable were to be isolated as the decisive factor keeping global oil markets from experiencing an inflationary spiral, it would be Beijing's dramatic reduction in crude oil imports. Vessel-tracking data from market intelligence firm Vortexa reveals that Chinese crude imports via tanker fell to approximately 6.7 million barrels per day in May 2026, representing a decline of nearly 40% from China's 2025 average import volumes.
The arithmetic consequence of this reduction is staggering in its real-world implications. The implied drop of roughly 4 million barrels per day is approximately equivalent to eliminating the entire combined daily oil consumption of Germany and France. In a global market that had already absorbed an enormous supply shock, this single demand contraction provided relief of comparable magnitude to the losses.
What makes this development analytically complex is that the mechanisms behind it remain genuinely uncertain. Official Chinese data for March and April 2026 was only beginning to surface at the time of the most recent market assessments. Two broad explanations have been proposed:
- Genuine demand weakness driven by economic slowdown, industrial contraction, or accelerating energy substitution
- Covert drawdowns of China's substantial strategic petroleum reserves, effectively replacing foreign crude purchases with domestic stockpile releases
In practice, both dynamics may be operating simultaneously, with the relative weighting between them carrying enormous implications for how long this relief valve can remain open. The geopolitical dimensions are equally significant. Had Beijing continued importing at its 2025 pace, the resulting supply deficit would have generated far more acute global inflationary pressure.
Force 2: Demand Destruction Has Been Larger and Faster Than Expected
Global refinery throughput has fallen by an estimated 5 million barrels per day since the conflict began, a reduction that reflects both genuine demand destruction among end consumers and inventory drawdown behaviour at the refinery level. Analysis attributes approximately 3 to 4 million barrels per day of this reduction to real demand destruction concentrated heavily in the petrochemical sector.
Several structural factors explain why demand destruction has been faster and more severe than historical Western consumption patterns would predict:
- Price sensitivity: Asian emerging market consumers demonstrate significantly greater responsiveness to energy price increases than the predominantly Western consumer base that anchored global demand during previous oil shocks
- Fuel substitution: Nations including India have pivoted rapidly toward coal and biomass alternatives as LPG availability deteriorated across large regions
- Physical unavailability: In parts of India, cooking fuels such as butane and propane have become functionally unavailable in significant regions, forcing consumption of alternative energy sources regardless of price signals
- EV penetration: China's accelerating electric vehicle adoption has structurally reduced the marginal petroleum demand for transport fuel in a way that was not present during previous oil shocks
This last point deserves particular emphasis. China's electric vehicle market penetration has reached a scale where it meaningfully reduces the petroleum intensity of Chinese transport demand, creating a structural floor under demand destruction that did not exist during the 1973 or 1990 crises. However, revised OPEC demand forecasts have begun to reflect these structural changes more explicitly in their medium-term outlooks.
Force 3: Oil Is Still Moving Through Alternative Routes
The closure of the Strait of Hormuz has not stopped Persian Gulf oil from reaching global markets entirely. Two distinct bypass mechanisms have emerged and scaled significantly since the conflict began.
Established pipeline infrastructure crossing Saudi Arabia and the UAE was largely unknown to general audiences prior to the conflict but has maintained an estimated 5 million barrels per day of outbound flow. These pipelines represent infrastructure investments made precisely to reduce Gulf states' vulnerability to Hormuz disruption, and their operational capacity has proven critical to maintaining some baseline of export continuity.
Emerging dark tanker shuttle operations represent a more improvised but increasingly significant route. Emirati and Kuwaiti vessels have begun operating shuttle services through the strait with AIS transponders disabled, hugging the Omani coastline to reduce exposure. What began as minimal volumes has scaled to approximately 2 million barrels per day of additional flow.
| Supply Bypass Route | Estimated Daily Volume | Operational Status |
|---|---|---|
| Saudi/UAE overland pipelines | ~5 million bpd | Operational |
| Dark tanker shuttle (Omani coast) | ~2 million bpd | Growing |
| Total bypass flow | ~7 million bpd | Active |
Combined, these routes are maintaining approximately 7 million barrels per day of outbound flow from the Persian Gulf, substantially mitigating the theoretical total closure impact.
Force 4: The Pre-War Oversupply Cushion
A critical contextual factor that receives insufficient analytical attention is the state of the global oil market immediately before hostilities commenced on February 27, 2026. The market was running a structural surplus of 3 to 4 million barrels per day during the seasonally weak demand period between late winter and early spring.
This oversupply was the product of two converging forces: the multi-year expansion of US shale production that had steadily increased non-OPEC supply, and a series of OPEC+ output increases implemented throughout 2025. OPEC's market influence during this period proved consequential, as the collective output increases flooded the market with additional barrels that created the inventory buffer now absorbing the supply shock.
Force 5: The IEA's Record Strategic Reserve Release
The speed and scale of the institutional policy response to this crisis contrasts sharply with historical precedents. When Iraq invaded Kuwait in 1990, the coordinated release of strategic petroleum reserves was delayed by approximately six months while diplomatic and military preparations proceeded. In the current conflict, the response was measured in weeks rather than months.
On March 11, 2026, the 32 member nations of the International Energy Agency announced a coordinated release of 400 million barrels across the following months — the largest strategic reserve deployment in the organisation's history. Release volumes have ramped to approximately 2.5 million barrels per day by mid-2026 as logistics scaled up following the announcement.
However, this mechanism carries critical constraints that limit its long-term effectiveness:
- US strategic petroleum reserves are at their lowest level in 40 years
- Commercial stockpiles across the global industry are being drawn down at a pace that could approach critical thresholds by August 2026
- Strategic reserves represent a finite, time-limited buffer, not a structural solution to an ongoing supply disruption
The IEA release is buying time rather than solving the fundamental supply equation. Its effectiveness depends heavily on whether other stabilising factors remain intact before the reserve runway is exhausted.
Force 6: The Presidential Communication Effect
One of the more unconventional stabilising mechanisms has been the sustained cadence of White House communications suggesting diplomatic resolution was imminent. Over the first 100 days of the conflict, approximately 40 public statements from the US administration signalled that a ceasefire or deal was close to finalisation.
Each significant announcement created immediate market effects, with oil prices declining as much as 10% following some communications as traders unwound speculative long positions to avoid being stopped out. This created a persistent psychological ceiling on speculative buying that reinforced the price-dampening effects of the fundamental supply and demand dynamics described above.
The effectiveness of this mechanism rests entirely on market credibility. The willingness of financial markets to take these communications seriously and adjust positioning accordingly has been a genuine and underappreciated factor in the price stability equation. A different political actor making identical statements might not have produced the same trading response.
Force 7: Refinery Flexibility Has Reached a New Structural Level
Modern refinery configurations have evolved substantially from the relatively inflexible facilities of previous decades. The widespread adoption of coker units has enabled refineries to process a significantly broader range of crude grades, reducing their dependence on specific supply sources. Output flexibility has similarly increased, with refineries now able to dynamically adjust product yield mixes in response to real-time market signals.
A particularly instructive example involves US jet fuel production:
- Pre-conflict: jet fuel represented approximately 10.5% of US refinery output
- Current: that yield has risen to a record high of nearly 13% as refineries direct output toward high-demand products
This flexibility reduces the magnitude of product shortages that would otherwise amplify price pressure across refined fuel markets.
Force 8: The Options Market Has Fundamentally Changed Trader Behaviour
Perhaps the most structurally significant but least publicly discussed change in global oil market architecture over the past decade is the exponential growth of the Brent crude options market. In 2016, average daily trading volume for Brent call options stood at approximately 25,000 lots per day. By mid-2026, that figure averages 200,000 lots per day, with peak volumes reaching 550,000 lots per day.
This eight-fold structural expansion has broken the self-reinforcing price spiral that historically accompanied Middle East supply disruptions. The options market provides an alternative: traders can purchase price insurance against upside risk without taking directional long positions in futures contracts. Consequently, this decouples hedging behaviour from the price-amplifying speculation that previously created mechanical price surges during crises.
Force 9: Satellite Intelligence Has Thinned the Fog of War
A less frequently analysed factor involves the information environment in which oil markets now operate. Commercial satellite imagery, now available at relatively accessible cost, allows market participants to monitor tanker movements, storage facility inventory levels, and refinery operational status in near real-time.
The practical result is that traders are responding more to actual observable conditions and less to speculation and rumour, which historically provided fertile ground for extreme price movements during geopolitical crises. For a broader perspective on how oil geopolitics analysis has evolved alongside these information improvements, the structural shift in market transparency represents one of the most underappreciated developments of the past decade.
Force 10: The Americas Production Boom Has Added Compensating Supply
Global attention has been almost exclusively focused on Persian Gulf output losses, but production gains elsewhere have provided meaningful compensating supply. Combined output across the American continent increased by approximately 2 million barrels per day between the second quarter of 2025 and the second quarter of 2026.
| Production Region | Year-on-Year Change | Notable Development |
|---|---|---|
| Brazil | +~20% | New national production record |
| Guyana | Record high | Continued offshore ramp-up |
| United States | Record high | Shale productivity and efficiency gains |
| Canada | Strong | Oilsands capacity expansion |
| Venezuela | Recovering | Output returning from depressed levels |
| China (domestic) | Record high | State-directed production push |
While these gains represent only a fraction of the theoretical losses associated with Hormuz closure, they provide meaningful incremental supply in a market where every barrel carries significant marginal pricing impact.
The Market Psychology Dimension: Why Traders Are Behaving Differently
Beyond the fundamental supply and demand mechanics, a significant but underappreciated dimension of the current oil price story involves shifts in trader psychology and risk management behaviour that have accumulated over the past decade. Furthermore, the trade war impact on oil markets has conditioned traders to adopt more cautious directional positions during periods of elevated geopolitical uncertainty.
The traditional oil trader's response to Middle East conflict was rooted in two instincts: buy futures aggressively to profit from anticipated price increases, and accumulate physical inventory to capture anticipated scarcity premiums. Both behaviours are self-reinforcing and collectively amplify the initial price shock well beyond what fundamental supply-demand mathematics would predict.
Several concurrent developments have moderated these instincts in the current environment. Improved information quality through satellite and tanker tracking has reduced the speculative premium that uncertainty historically injected into prices. The sustained credibility of US diplomatic communications has maintained a persistent expectation of resolution that caps the upside traders are willing to bet on.
The interaction between these psychological factors and the fundamental supply dynamics creates a market environment where each factor reinforces the others. Improved information reduces panic buying. Options availability reduces forced futures exposure. Ceasefire expectations reduce the time horizon for speculative positions. Together, these forces create a dampening effect that compounds across the entire market structure.
Scenario Analysis: What Could Finally Break the $100 Barrier?
The current price stability, while remarkable, rests on several pillars that are either finite in duration or potentially reversible. According to CNBC, understanding the scenarios under which prices could still breach $100 is essential for investors, policymakers, and energy consumers planning for the months ahead.
Scenario 1: China Returns to Normal Import Volumes
If Beijing resumes its 2025 average import pace of approximately 10.7 million barrels per day, the 4 million barrel per day relief valve disappears. This single factor, operating in isolation, would likely be sufficient to push prices through $100 regardless of whether other stabilising factors remain intact.
Scenario 2: Strategic Reserve Exhaustion
With US reserves at a 40-year low and commercial inventories approaching critical levels by August 2026, the coordinated buffer mechanism has a finite operational window. If the conflict persists beyond the reserve runway without compensating demand or supply adjustments, upward price pressure will intensify considerably.
Scenario 3: Ceasefire Collapse
The US-Iran ceasefire framework remains fragile, with both parties continuing to exchange attacks. A full breakdown in diplomatic engagement would simultaneously eliminate the credibility of ceasefire communications as a market-dampening tool and trigger an immediate reassessment of the supply outlook.
Scenario 4: Structural Factors Hold
If refinery flexibility continues to improve output allocation, options market depth continues to absorb hedging demand without generating futures price pressure, and non-Persian Gulf production gains continue scaling, the current price range may prove more durable than most analysts currently project.
Disclaimer: The scenario analysis above involves inherent uncertainty and should not be interpreted as a forecast or investment recommendation. Oil markets are subject to rapid, unpredictable change driven by geopolitical, macroeconomic, and operational variables that cannot be reliably forecast. Readers should consult qualified financial advisers before making investment decisions.
The next major ASX story will hit our subscribers first
The Bigger Picture: A New Framework for Oil Market Crisis Analysis
The question of why oil is still below $100 a barrel carries implications that extend well beyond commodity pricing. It raises fundamental questions about how institutions model energy security risk, how central banks should calibrate their crisis response frameworks, and how energy-dependent nations should structure their strategic reserve policies going forward.
The current episode demonstrates that the global oil market has developed substantially greater shock-absorption capacity than analytical frameworks built on 1970s and 1990s crisis episodes would suggest. Refinery flexibility, options market depth, improved information infrastructure, diversified production geography, and faster institutional responses collectively represent a structural upgrade in global energy system resilience.
At the same time, several of the most important stabilising factors are demonstrably temporary. Strategic reserves are depleting. Commercial stockpiles are approaching critical levels. China's import suppression cannot be sustained indefinitely without either accepting significant economic consequences or drawing down finite strategic reserves. Rigzone's analysis of the technical supply dynamics similarly highlights these finite limits as the central vulnerability in the current price stability equation.
The most intellectually honest assessment of the current situation is that multiple extraordinary factors have converged simultaneously to produce a price outcome that would have been considered essentially impossible based on historical precedent. Whether this convergence reflects a genuinely permanent structural shift in oil market dynamics, or whether it represents a temporary alignment of favourable variables that will eventually unwind, remains the defining analytical question for the global energy market over the coming months.
What is clear is that the conventional wisdom governing how financial markets, governments, and corporations think about oil price risk during geopolitical crises requires fundamental reassessment. The old models assumed that Hormuz disruption meant $200 oil. The new reality demands a more nuanced, multi-factor framework that accounts for the remarkable adaptive capacity of the modern global energy system, while remaining alert to the finite limits of that adaptability.
Key factors to monitor going forward:
- Chinese crude import volumes as official March and April 2026 data becomes available
- US strategic petroleum reserve levels relative to the August 2026 critical threshold
- Continuation or breakdown of US-Iran ceasefire communications
- Scaling of dark tanker shuttle operations and pipeline bypass capacity
- Non-OPEC production trajectory across the Americas through Q3 2026
This article draws on market intelligence and analysis published by Bloomberg and reported via ET EnergyWorld (June 11, 2026). Readers seeking further context on global oil supply and demand dynamics are encouraged to consult the International Energy Agency's official Oil Market Reports and Bloomberg Energy's ongoing coverage of the Iran conflict and its market implications.
Want to Stay Ahead of the Next Major Commodity Shift?
Discovery Alert's proprietary Discovery IQ model scans ASX announcements in real time, delivering instant alerts on significant mineral discoveries so investors can act before the broader market catches on — explore historic discoveries and their returns to see what early positioning can mean, then start your 14-day free trial to secure a genuine market-leading advantage.