July 20, 2026
The Hidden Logic Behind Falling Oil Prices in an Active War Zone
Energy markets have a long memory, and that memory is built on a surprisingly simple premise: price follows barrels, not bullets. Throughout the twentieth century, every major Middle Eastern conflict produced a reflexive spike in crude oil prices. The 1973 Arab oil embargo, the 1979 Iranian Revolution, Iraq's invasion of Kuwait in 1990, and the post-9/11 period all delivered textbook responses where geopolitical risk translated directly into higher energy costs. Investors who internalised that pattern as a permanent law of markets are now confronting a genuinely disorienting reality. Understanding why oil is falling despite the US-Iran war requires abandoning some deeply held assumptions about how energy markets price risk.
When big ASX news breaks, our subscribers know first
What the Price Action Actually Communicates
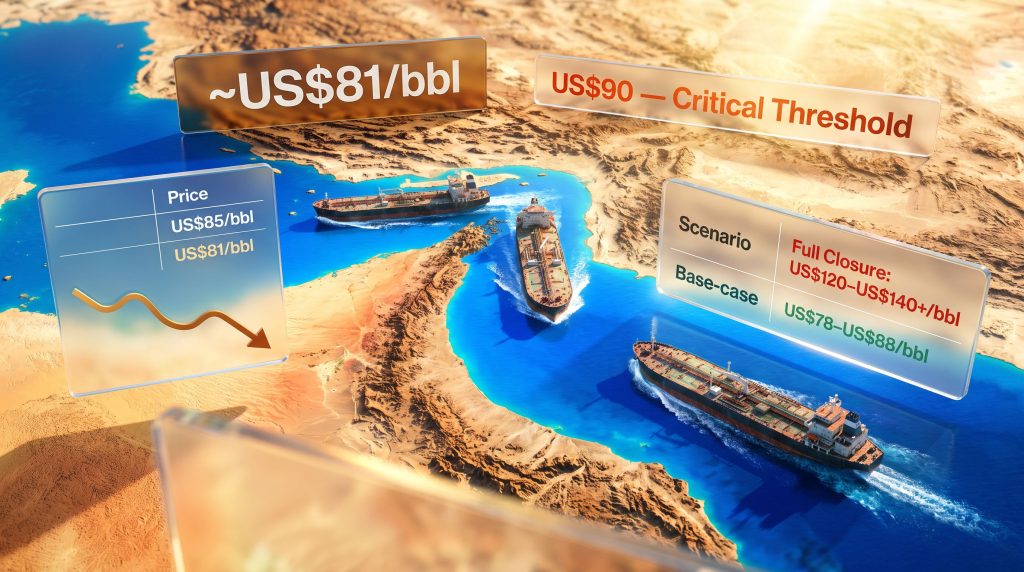
Crude oil spiked to nearly US$85 per barrel in early trading as weekend escalation news filtered into markets, then retreated to approximately US$81, finishing the session lower than where it started. That intraday reversal is not noise. It is a precise statement from the collective intelligence of global commodity markets.
For context, consider where prices have traded over the past twelve months:
| Price Level | Market Interpretation |
|---|---|
| Above US$117/bbl (prior peak) | Genuine global supply crisis |
| US$90-US$117/bbl | Significant supply disruption risk priced in |
| US$85-US$90/bbl | Elevated geopolitical premium, shipping risk uncertain |
| US$78-US$85/bbl | Regional conflict contained; flows continuing |
| Below US$78/bbl | Demand-side concerns dominating supply-side narrative |
Current prices sitting near US$81 place the market firmly in "regional containment" territory. Traders who pushed crude briefly toward US$85 on conflict headlines were pricing a worst-case scenario. When satellite tracking and port data confirmed that tankers were continuing to move, that premium collapsed within hours.
Furthermore, as oil falls below $100 on optimism over the Iran war, this dynamic has become increasingly evident to market participants.
The oil price is not a moral barometer for how serious a conflict has become. It is a logistics indicator measuring whether physical barrels are reaching buyers on schedule.
The Strait of Hormuz: Understanding What Actually Drives Oil Volatility
Why This 33-Kilometre Channel Controls Global Inflation
The Strait of Hormuz is a maritime passage connecting the Persian Gulf to the Gulf of Oman, narrowing to roughly 33 kilometres at its tightest navigable point. Approximately 20% of the world's total seaborne oil transits this corridor daily, including the bulk of crude exports from Saudi Arabia, the UAE, Kuwait, Iraq, and Iran itself.
No viable large-scale alternative exists. The East-West Pipeline across Saudi Arabia carries a fraction of comparable capacity, and no pipeline network can replicate the volume flexibility that seaborne transit provides. A genuine, sustained blockade of the Strait of Hormuz would represent a structural supply shock of a magnitude the modern global economy has never actually experienced in full.
This is precisely why the strait functions as the single most important variable in global oil pricing during periods of Middle Eastern tension. When traders receive confirmation that tankers are moving normally through the corridor, their risk calculus changes immediately regardless of what military operations are occurring nearby. The broader context of crude oil trade and geopolitics makes clear just how interconnected these factors remain.
The Three-Tier Hormuz Scenario Framework
Investors managing energy-exposed portfolios need a structured way to think about escalation scenarios rather than reacting emotionally to headline severity:
| Scenario | Estimated Crude Price Impact | Broader Economic Effect |
|---|---|---|
| Strait remains open (current base case) | US$78-US$88/bbl range | Minimal; inflation expectations stable |
| Partial throughput disruption (30-50% reduction) | US$95-US$110/bbl | Broad equity pressure; energy sector outperforms |
| Full closure sustained beyond two weeks | US$120-US$140+/bbl | Recession risk; emergency central bank response |
The leap from scenario one to scenario three is not gradual. Oil markets would price a credible full closure almost instantaneously, potentially overshooting fundamental estimates in the initial panic phase before settling.
Three Structural Forces Pushing Oil Lower Beyond the Conflict
The military situation is capturing headlines, but experienced commodity analysts recognise that crude was already facing meaningful headwinds before the first strike was launched. The conflict has, however, complicated the picture without changing its fundamental direction.
1. China's Demand Deterioration Is Structurally Significant
China remains the world's largest importer of crude oil. The ongoing deflationary pressure within the Chinese economy, combined with a property sector that continues to weigh on construction activity and industrial output, has measurably reduced import demand. These China demand challenges compress the price ceiling regardless of what is happening on the supply side.
Chinese manufacturing PMI data and crude import volumes have both softened relative to prior-year comparisons, suggesting this is not a temporary seasonal adjustment but a more persistent structural moderation in energy appetite.
2. Western Interest Rate Dynamics Are Suppressing Demand Expectations
Sustained central bank tightening across the United States, Europe, and Australia has filtered through to slower economic growth, reduced industrial production, and lower fuel consumption relative to prior cycle peaks. In addition, markets are simultaneously pricing the risk that any oil-driven inflation spike would delay rate cuts further, creating a feedback loop that is independently bearish for crude. The resulting market volatility and bonds dynamic has added another layer of complexity for energy investors to navigate.
3. Diplomatic Optionality Is Being Priced Into Forward Curves
Indirect negotiations between Washington and Tehran have not collapsed entirely, despite the formal breakdown of the ceasefire. Traders are assigning non-trivial probability to a negotiated framework emerging over the coming months, and this diplomatic optionality functions as a structural discount on sustained supply-risk pricing.
Market Habituation and the Hidden Asymmetry of Prolonged Conflict
Why Calm Markets Can Mask Extreme Tail Risk
One of the most well-documented but least-discussed phenomena in financial markets is progressive desensitisation to sustained geopolitical risk. The pattern is consistent across conflicts: initial uncertainty drives elevated risk premiums, sustained conflict without supply disruption normalises the base case, and each successive escalation produces a smaller and shorter-lived price response.
The current US-Iran engagement has run for approximately five months without a confirmed Strait of Hormuz closure. Five months of continued tanker traffic has trained market participants to treat the "flows continue" outcome as the default assumption. That repricing of the base case is rational given the data available. It is also creating a dangerous asymmetry that investors should not underestimate.
The longer markets habituate to a conflict without a supply disruption materialising, the more violent the repricing event would be if one finally did occur. Complacency compounds tail risk rather than eliminating it.
This is a structural feature of how commodity markets behave across extended conflict periods. The 1980-1988 Iran-Iraq War, which directly threatened Persian Gulf shipping for eight years, produced enormous volatility in the early years and then a remarkable degree of market adaptation. When Iraqi forces eventually mined shipping lanes and attacked neutral tankers, the price response was violent and rapid precisely because markets had become accustomed to an operational baseline that suddenly broke.
Equity Market Transmission: How Oil Connects to Your Broader Portfolio
The Two Channels That Actually Matter for Stock Investors
For equity investors, the oil-to-stock transmission mechanism operates through two distinct pathways that deserve separate consideration:
-
The Inflation Channel – Higher crude prices feed directly into headline CPI through petrol, transportation costs, and energy-intensive production inputs. Higher CPI reduces the probability of central bank rate cuts, which compresses the valuation multiples of growth-oriented equities. Technology companies with earnings weighted toward future periods are disproportionately sensitive to this channel.
-
The Corporate Cost Channel – Airlines, logistics companies, freight operators, and consumer-facing businesses with significant transportation cost exposure face direct margin compression when fuel prices rise. This channel affects earnings estimates directly rather than through multiple compression.
When oil falls despite military escalation, both channels remain benign. This explains why equity markets stabilised whilst simultaneously absorbing objectively serious conflict news.
Sector-by-Sector Impact Assessment
| Sector | Oil Holds Below US$90 | Oil Breaks Above US$90 Sustainably |
|---|---|---|
| Energy Producers | Neutral to modest upside | Strong outperformance expected |
| Airlines & Freight | Stable operating margins | Significant cost pressure and earnings downgrades |
| Consumer Discretionary | Limited direct impact | Demand destruction risk via fuel costs |
| Technology (Growth) | Unaffected by oil directly | Indirect hit via inflation and rate delay |
| Industrials | Manageable input costs | Margin compression risk materialises |
| Financials | Broadly neutral | Rate path uncertainty creates volatility |
The technology sector's recent turbulence — including the Nasdaq declining approximately 2.9% in the preceding week and chip stocks entering bear market territory — was driven by earnings and spending guidance concerns, not by energy prices. These are currently operating as separate risk tracks that investors should not conflate.
The next major ASX story will hit our subscribers first
The US$90 Threshold: Why This Number Functions as a Portfolio Signal
Professional commodity traders and equity strategists have converged on the US$90 per barrel level as the critical psychological and analytical threshold in current market conditions. Below it, the working assumption remains regional military containment. Above it, particularly if the move is sustained across multiple sessions rather than an intraday spike, the market interpretation shifts toward genuine supply disruption risk.
A practical decision framework for energy-exposed portfolios:
Oil below US$85 → Monitor; existing exposures appropriate
Oil US$85-US$90 → Increase monitoring frequency; review sector weightings
Oil above US$90 (sustained 3+ days) → Active reassessment; consider hedging instruments
Oil above US$100 → Defensive repositioning; inflation and rate risk materially elevated
The key word in this framework is sustained. Brief intraday moves above any threshold on conflict headlines are normal market functioning and do not require portfolio action. It is the settlement price across multiple consecutive sessions that carries analytical weight.
The Indicators That Actually Matter for Monitoring This Situation
Why Headlines Are the Wrong Input Variable
The instinct to track military developments, casualty counts, and diplomatic statements is entirely human but analytically insufficient for portfolio management purposes. None of these inputs directly measure the variable that drives oil prices, which is physical supply continuity.
Primary Indicators to Track:
- Brent and WTI crude settlement prices – The market's real-time verdict on aggregate supply risk
- Strait of Hormuz tanker tracking data – Physical confirmation of shipping throughput via AIS transponder signals
- OPEC+ production decisions – OPEC's market influence remains a supply-side management capacity that can offset or amplify geopolitical disruption
- US EIA weekly crude inventory reports – Demand-side confirmation and supply buffer assessment
Secondary Indicators Worth Monitoring:
- US CPI and PCE inflation readings – Determines whether an oil spike would force central bank policy recalibration
- Federal Reserve communications and rate guidance – Higher-for-longer rates amplify equity market sensitivity to any oil shock
- China crude import volumes – Sets the demand-side floor for global pricing regardless of supply developments
- Sovereign credit default swap spreads for Gulf states – A sophisticated early-warning signal for institutional risk perception shifts
One less commonly watched indicator deserves specific attention: the spread between near-month and forward oil futures contracts, known in commodity markets as the contango or backwardation structure. When markets shift into steep backwardation, it signals that physical demand for immediate delivery is intensifying, which is often an earlier warning signal than spot price moves alone. The US-China trade war oil impact adds yet another variable that sophisticated investors must factor into their monitoring frameworks.
Frequently Asked Questions: Oil, the Iran Conflict, and Market Dynamics
Why did oil prices fall when military action escalated?
Oil markets distinguish sharply between geopolitical severity and physical supply disruption. When confirmed data showed tanker traffic continuing through the Strait of Hormuz despite intensifying strikes, traders unwound the risk premium they had priced in during early trading, pushing prices back below the prior session's close.
What would actually cause a sustained oil price shock from this conflict?
A confirmed, sustained interdiction of tanker traffic through the Strait of Hormuz would constitute a genuine supply shock. This could result from Iranian mining operations in the strait, aggressive interdiction of commercial vessels, or retaliatory actions that caused major shipping insurers to withdraw coverage for Gulf transits, effectively freezing commercial shipping without a single military engagement.
How does a falling oil price affect technology stocks?
The connection runs through inflation expectations. Lower oil prices reduce headline CPI, which maintains the possibility of central bank rate cuts, which supports the valuation multiples of growth-oriented technology companies whose earnings are weighted toward future periods. Rising oil reverses this chain, which is why sustained crude price increases tend to disproportionately pressure high-multiple technology stocks.
Is the market underestimating the conflict risk?
Possibly, and this is the key asymmetric risk that sophisticated investors are tracking. Five months of continued tanker flows has trained markets to treat operational continuity as the default assumption. This is rational given the evidence, but it means any genuine supply disruption would produce a sharp repricing because the current equilibrium price contains very little precautionary premium.
Key Takeaways for Investors
- Why oil is falling despite the US-Iran war comes down to one variable: tankers are still moving through the Strait of Hormuz, and markets price barrels not headlines
- The US$81 settlement level reflects a "contained conflict" base case; the five-month absence of a supply shock has progressively compressed the risk premium embedded in crude prices
- Demand-side headwinds from Chinese economic softness and Western rate cycles are independently bearish for crude, compounding the effect of contained supply risk
- US$90 per barrel sustained is the threshold that would signal a genuine shift in market interpretation from regional engagement to global supply threat
- Technology stocks face indirect but real exposure through the oil-inflation-rates transmission chain, particularly if Federal Reserve rate cut timelines are pushed out further
- Market habituation creates asymmetric tail risk: the longer the conflict runs without a Hormuz disruption, the more violent any eventual disruption-driven repricing would be
- Tracking tanker AIS data and futures curve structure provides earlier and more reliable signals than monitoring military or diplomatic news flow
This article is intended for informational purposes only and does not constitute financial advice. Past market behaviour during geopolitical conflicts does not guarantee future outcomes. Investors should conduct their own research and seek professional advice before making investment decisions. Price levels and scenarios discussed are based on market conditions at the time of writing and are subject to rapid change.
Want to Stay Ahead of the Next Major Resource Discovery Before the Market Moves?
While geopolitical forces drive volatility across energy and commodity markets, Discovery Alert's proprietary Discovery IQ model cuts through the noise by delivering real-time alerts on significant ASX mineral discoveries — explore historic examples of exceptional discovery-driven returns to understand the opportunity, then begin your 14-day free trial at Discovery Alert to position yourself ahead of the broader market.