June 16, 2026
The question of will silver hit triple digits in 2026 has captured the attention of investment strategists analyzing precious metals markets who have shifted their focus toward structural monetary dynamics rather than traditional technical indicators. As central bank balance sheets continue expanding and geopolitical tensions reshape global trade flows, silver has emerged as a unique intersection of industrial necessity and monetary hedge. The convergence of supply constraints, technological demand acceleration, and currency debasement creates a scenario framework that extends far beyond conventional precious metals cycles.
Modern portfolio theory traditionally treats silver as a commodity play or inflation hedge, yet emerging evidence suggests this classification may fundamentally misrepresent the asset's evolving role in the global economic system. The question facing institutional and retail investors alike centers not on whether precious metals will appreciate, but on positioning strategies for potential exponential moves driven by structural rather than cyclical forces.
What Does Triple Digits Mean for Silver Investors?
Defining the Triple-Digit Threshold
Triple-digit silver represents a price level above $100 per ounce, a threshold that carries profound implications for portfolio allocation and wealth preservation strategies. As of December 2025, silver has reached $70 per ounce for the first time in history, marking a 128% year-to-date gain that positions the metal within striking distance of this psychological and mathematical milestone.
The significance extends beyond mere price appreciation. Historical analysis reveals that silver's purchasing power relative to currency creation has deteriorated dramatically since its 1980 peak of approximately $49.45 per ounce. Current monetary conditions suggest that achieving true inflation-adjusted parity would require far higher nominal prices than most market participants anticipate.
Critical Context: According to recent market analysis, silver remains approximately 11.8 times below its inflation-adjusted high when measured against M2 money supply expansion rather than traditional consumer price indices.
Current Market Position Analysis
The mathematical framework for triple-digit silver scenarios relies on multiple convergent factors. Furthermore, the gold-to-silver ratio insights provide essential context for understanding current market positioning:
- Current baseline: $70 per ounce (December 2025)
- Required appreciation: 43% minimum to reach $100
- Gold-to-silver ratio: Currently below 65:1 (down from historical highs above 120:1)
- Historical ratio targets: 33-35:1 during abundant stockpile periods
Table: Silver Price Trajectory Scenarios
| Gold Price | 65:1 Ratio | 35:1 Ratio | 20:1 Ratio |
|---|---|---|---|
| $4,400 | $68 | $126 | $220 |
| $6,000 | $92 | $171 | $300 |
| $8,000 | $123 | $229 | $400 |
Why 2026 Represents a Critical Inflection Point
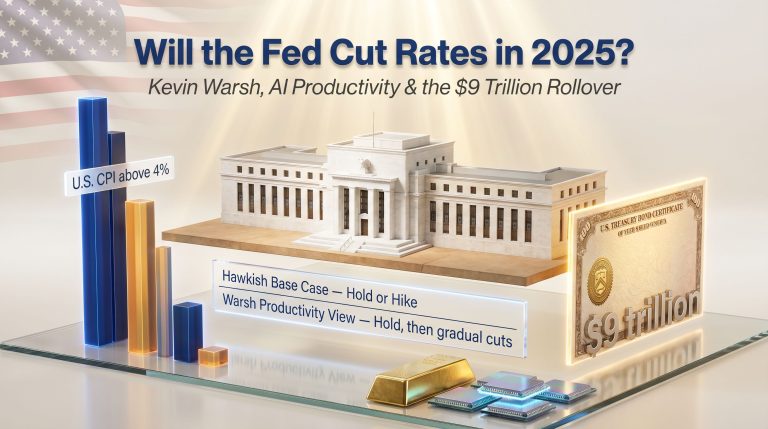
Federal Reserve policy trajectories indicate potential rate reduction cycles beginning in 2026, creating conditions historically associated with precious metals breakouts. Economic transition periods, particularly those involving monetary regime changes, have consistently produced exponential moves in hard assets relative to fiat currencies.
The timeline significance stems from several converging factors. However, understanding whether will silver hit triple digits in 2026 requires examining broader market dynamics:
- Economic cycle timing: Late-stage credit expansion periods historically precede precious metals revaluations
- Industrial demand acceleration: Solar panel manufacturing and electric vehicle component requirements reaching critical mass
- Geopolitical realignment: Strategic metal stockpiling by nation-states as supply chain security becomes paramount
When big ASX news breaks, our subscribers know first
How Close Is Silver to Its Inflation-Adjusted Peak?
The Currency Supply Gap Analysis
Traditional inflation measurements using Consumer Price Index data fundamentally misrepresent silver's relationship to monetary expansion. Since 1980, the Federal Reserve's M2 money supply has expanded from approximately $1.6 trillion to over $21 trillion as of 2025, representing a 13-fold increase that dwarfs conventional inflation metrics.
When silver's current $70 price is adjusted for this monetary base expansion rather than CPI, the metal trades at a significant discount to its purchasing power peak. This analytical framework suggests that achieving monetary parity would require prices substantially higher than the nominal 1980 high of $49.45.
Table: Silver Price vs. Money Supply Expansion (1980-2025)
| Year | Silver Price | M2 Money Supply | Ratio (Silver/M2) |
|---|---|---|---|
| 1980 | $49.45 | $1.6T | 30.9 |
| 2011 | $49.80 | $9.6T | 5.2 |
| 2025 | $70.00 | $21.3T | 3.3 |
Real vs. Nominal Performance Measurement
The disconnect between nominal price recovery and purchasing power restoration reveals the magnitude of potential upside scenarios. While silver has achieved new nominal highs in 2025, its position relative to currency creation suggests the metal remains in the early stages of a major revaluation cycle.
Featured Insight: Silver's current position relative to M2 expansion indicates the metal would need to reach approximately $585 per ounce to match its 1980 purchasing power against the monetary base.
This calculation methodology transforms the investment thesis from commodity speculation to currency hedge positioning, fundamentally altering risk-reward assessments for institutional allocators.
What Supply Constraints Are Building Pressure on Silver Markets?
Government Stockpile Depletion Crisis
The global strategic silver inventory situation represents one of the most overlooked fundamental factors supporting higher price scenarios. Nations that historically maintained substantial silver reserves have systematically depleted these stockpiles through decades of technological advancement and strategic sales.
Key Developments:
- The United States strategic silver stockpile has been completely eliminated
- China has implemented export restrictions and licensing requirements as of 2025
- European Union countries report minimal strategic silver reserves remaining
- Military applications continue consuming available supplies for advanced weapons systems
Case Study: China's Export Policy Shift
China's decision to halt silver exports and impose licensing requirements represents a fundamental shift in global supply dynamics. This policy change affects approximately 25% of global refined silver production, creating immediate supply tightness for Western industrial consumers.
The strategic implications extend beyond short-term price pressures. When the world's largest producer restricts exports, it signals recognition of silver's critical importance for technological and military applications, effectively treating the metal as a strategic resource rather than a commodity.
Industrial Demand Acceleration Analysis
Modern technological applications have transformed silver from a monetary metal to an industrial necessity. The convergence of solar energy expansion, electric vehicle adoption, and advanced electronics manufacturing creates structural demand growth that exceeds traditional mining supply responses.
In addition, analysts examining silver supply deficits note that demand acceleration has created unprecedented pressure on available stockpiles.
Table: Industrial Silver Consumption Growth by Sector (2020-2025)
| Application | 2020 Demand | 2025 Demand | Growth Rate |
|---|---|---|---|
| Solar Panels | 100M oz | 185M oz | 85% |
| Electronics | 250M oz | 295M oz | 18% |
| Automotive | 55M oz | 90M oz | 64% |
| Military/Aerospace | 15M oz | 25M oz | 67% |
Mining Production Challenges
The precious metals mining industry faces structural challenges that limit supply response to rising prices. Capital allocation decisions made during the 2015-2020 price suppression period created development gaps that require 5-7 years to rectify through new mine construction.
Critical Production Constraints:
- Grade decline: Average silver ore grades have decreased 20% since 2010
- Lead times: New mine development requires 5-7 years from discovery to production
- Capital intensity: Modern silver mines require $500M+ initial investment
- Environmental permitting: Regulatory approval processes extend development timelines
The mining supply deficit becomes more pronounced when considering that 70% of silver production comes as a byproduct of copper, lead, and zinc mining. When base metal prices decline, silver production automatically contracts regardless of silver price levels.
How Are Market Indicators Signaling a Potential Breakout?
Gold-to-Silver Ratio Technical Analysis
The gold-to-silver ratio currently trades below 65:1, representing a significant decline from the 120:1+ levels reached during 2020 market stress periods. Historical analysis reveals that ratio compression typically precedes silver outperformance phases, with moves below 50:1 signaling potential exponential price acceleration.
Historical Ratio Patterns:
- 1979-1980: Ratio declined from 40:1 to 17:1 as silver surged to $49.45
- 2010-2011: Ratio fell from 70:1 to 31:1 during silver's move to $49.80
- 2025: Current ratio below 65:1 suggests early-stage compression phase
When the ratio reaches historical 33-35:1 levels, silver prices would range from $126-$140 per ounce based on current gold prices of $4,400. A move to the extreme 20:1 ratio achieved briefly in 1980 would imply silver prices above $220 per ounce.
Retail Interest and Search Behavior Patterns
Google Trends data for precious metals search terms reveals correlations between retail interest spikes and major price inflection points. The search term "how to buy silver" has reached all-time highs during December 2025, historically correlating with significant market turning points.
Furthermore, recent analysis from Kitco News suggests that retail participation increases during early stages of major moves.
Table: Search Interest vs. Price Performance Correlation
| Year | Search Spike Period | Silver Price (Low) | Silver Price (High) | Performance |
|---|---|---|---|---|
| 2008 | Sept-Nov | $9.50 | $21.30 | +124% |
| 2011 | Feb-Apr | $26.50 | $49.80 | +88% |
| 2020 | Mar-Aug | $12.00 | $30.00 | +150% |
| 2025 | Oct-Dec | $32.50 | $70.00+ | +115% |
This search pattern correlation suggests retail participation increases during early stages of major moves rather than at market peaks, contrary to conventional wisdom about "dumb money" timing.
Institutional Positioning Signals
Large-scale physical silver accumulation by institutional investors has accelerated throughout 2025. ETF flow patterns show four consecutive weeks of inflows, whilst physical silver dealers report supply constraints at current price levels.
However, the potential for a silver market squeeze remains a critical factor in institutional positioning decisions.
Institutional Activity Indicators:
- Silver ETF holdings increased 15% year-to-date through December 2025
- Physical silver premiums over spot price expanded to 8-12% range
- Large-lot purchase inquiries ($100M+ transactions) reported by multiple dealers
- Central bank digital currency discussions include precious metals backing provisions
Market Intelligence: Recent institutional inquiries include execution strategies for silver purchases in the $100 million range, suggesting sophisticated money anticipates further price appreciation.
What Economic Scenarios Could Drive Triple-Digit Silver?
Monetary Policy Catalyst Scenarios
Federal Reserve policy trajectories anticipated for 2026 include potential rate reduction cycles as economic growth concerns override inflation targeting. Real interest rate environments approaching zero or negative levels historically correlate with precious metals appreciation phases.
Policy Scenario Framework:
- Baseline case: Two rate cuts in 2026, bringing federal funds rate to 3.5-4.0%
- Aggressive case: Economic slowdown forces rates below 3%, creating negative real rates
- Crisis case: Financial system stress requires emergency rate reductions to zero
Each scenario creates increasingly favourable conditions for silver appreciation, with the crisis case potentially triggering exponential moves as investors seek monetary alternatives to depreciating currencies.
Market Correction and Safe-Haven Demand
Current equity valuations and debt levels suggest vulnerability to significant corrections during 2026. Historical analysis reveals that precious metals often outperform during equity market stress, particularly when corrections exceed 20% from peak levels.
Table: Silver Performance During Market Stress Scenarios
| Market Condition | Silver 6-Month Performance | Gold 6-Month Performance | Ratio |
|---|---|---|---|
| Equity Decline <20% | +15% avg | +12% avg | 1.25x |
| Equity Decline 20-40% | +45% avg | +28% avg | 1.61x |
| Equity Decline >40% | +120% avg | +65% avg | 1.85x |
The outperformance ratio increases with market stress severity, suggesting silver's leverage characteristics become more pronounced during crisis periods.
Geopolitical and Trade War Implications
Strategic metal stockpiling by nation-states creates additional demand pressure whilst reducing available commercial supplies. Export restrictions by major producing countries (China, Peru, Mexico) could trigger supply shortages that override traditional price discovery mechanisms.
Moreover, silver tariffs impact analysis indicates that trade policy changes could accelerate price movements in 2026.
Strategic Stockpiling Factors:
- Military applications requiring silver for advanced weapons systems
- Technology sector national security considerations
- Currency backing for central bank digital currency initiatives
- Economic warfare through critical material control
Which Price Models Support Triple-Digit Forecasts?
Mathematical Ratio Reversion Models
Gold price trajectories extending toward $6,000-$8,000 per ounce create mathematical frameworks supporting triple-digit silver scenarios. When combined with historical gold-to-silver ratio analysis, these models suggest silver appreciation potential exceeding gold's performance by substantial multiples.
Reversion Scenario Analysis:
- Conservative case (50:1 ratio, $6,000 gold): Silver reaches $120
- Historical case (35:1 ratio, $7,000 gold): Silver reaches $200
- Extreme case (20:1 ratio, $8,000 gold): Silver reaches $400
Featured Calculation: Silver could outperform gold by 6x or more if historical ratio relationships reassert whilst gold prices continue advancing toward $8,000+ levels.
Supply-Demand Deficit Projections
Industry analysis indicates annual silver deficits of 150-200 million ounces persisting through 2030, creating cumulative shortfalls that exceed available above-ground stockpiles. This mathematical framework suggests price elasticity curves that become increasingly steep as physical shortages emerge.
Deficit Impact Modelling:
- 2026: 180M oz deficit, 5% of above-ground stocks
- 2027: 195M oz deficit, cumulative 10% depletion
- 2028: 210M oz deficit, cumulative 16% depletion
- 2029-2030: Accelerating deficits as industrial demand compounds
Price elasticity modelling suggests that physical shortages create exponential rather than linear price responses, potentially triggering triple-digit moves within compressed timeframes.
Monetary Reset Scenarios
Central bank digital currency implementations may include precious metals backing provisions to maintain public confidence. If major economies adopt partially-backed digital currencies, the required precious metals accumulation could absorb years of mining production.
Case Study: Historical Currency Reset Precedents
The 1971 Nixon Shock provides relevant context for sudden monetary system changes. Gold prices increased 2,300% from $35 to $850 per ounce between 1971-1980, suggesting that monetary regime changes can trigger exponential precious metals appreciation.
Similar dynamics could affect silver if central bank digital currencies require partial precious metals backing or if international trade settlement mechanisms shift toward hard assets.
The next major ASX story will hit our subscribers first
What Are the Risks to Triple-Digit Silver Projections?
Economic Growth Slowdown Scenarios
Severe economic recession could reduce industrial silver demand from solar panel manufacturing, electric vehicle production, and electronics applications. Historical analysis suggests that industrial demand compression can offset investment demand increases during economic stress periods.
Risk Mitigation Factors:
- Government infrastructure spending typically maintains solar and EV demand during recessions
- Military applications remain stable regardless of economic cycles
- Reduced mining production during recessions creates supply-side support
- Currency debasement accelerates during recession response policies
Technological Substitution Threats
Research into silver substitutes for industrial applications poses long-term risks to demand projections. However, current alternatives typically offer inferior performance characteristics whilst requiring substantial industrial retooling investments.
Table: Silver Substitution Risk Assessment by Application
| Application | Substitution Risk | Performance Trade-off | Implementation Timeline |
|---|---|---|---|
| Solar Panels | Medium | 5-15% efficiency loss | 5-10 years |
| Electronics | Low | Significant degradation | 10+ years |
| Batteries | Medium | Reduced capacity | 3-7 years |
| Medical | Low | Safety/efficacy concerns | 10+ years |
Market Manipulation and Intervention Risks
Concentrated futures market positions and potential central bank intervention represent risks to exponential price appreciation scenarios. However, physical silver shortages could overcome paper market manipulation if industrial demand exhausts available supplies.
Intervention Limitation Factors:
- Government stockpiles already depleted, reducing intervention capacity
- Industrial demand provides fundamental price support independent of speculation
- International coordination required for effective manipulation becomes increasingly difficult
How Should Investors Position for Potential Silver Breakouts?
Physical vs. Paper Silver Considerations
Physical silver ownership provides direct exposure without counterparty risk, whilst ETFs and mining stocks offer liquidity advantages during normal market conditions. However, supply shortages could create significant premiums for physical metal during crisis periods.
In addition, silver premiums analysis reveals important considerations for investors choosing between different silver investment vehicles.
Comparison: Investment Vehicle Characteristics
| Vehicle Type | Liquidity | Storage Cost | Counterparty Risk | Crisis Performance |
|---|---|---|---|---|
| Physical Silver | Low | Medium | None | Excellent |
| Silver ETFs | High | Low | High | Good |
| Mining Stocks | High | None | Medium | Variable |
| Futures/Options | Highest | None | High | Poor |
Timing and Dollar-Cost Averaging Strategies
Volatility management becomes critical when positioning for exponential moves. Dollar-cost averaging approaches reduce timing risk whilst maintaining exposure to potential breakouts.
Strategic Allocation Framework:
- Conservative approach: 5-10% precious metals allocation, split 60/40 gold/silver
- Moderate approach: 10-20% allocation, increasing silver weighting to 50%
- Aggressive approach: 20%+ allocation, emphasising silver's leverage characteristics
Portfolio Guidance: Position sizing should reflect individual risk tolerance, but first silver becomes unobtainable, then it becomes unaffordable during supply shortage periods.
Portfolio Allocation Guidelines
Risk-adjusted position sizing requires consideration of silver's correlation with other assets during various market regimes. Historical analysis suggests precious metals provide portfolio diversification benefits that become more pronounced during crisis periods.
Table: Recommended Allocation by Risk Profile
| Risk Profile | Total PM Allocation | Silver Portion | Maximum Position |
|---|---|---|---|
| Conservative | 5-8% | 25% of PM | 2% total portfolio |
| Moderate | 8-15% | 40% of PM | 6% total portfolio |
| Aggressive | 15-25% | 60% of PM | 15% total portfolio |
Frequently Asked Questions: Triple-Digit Silver Investment Considerations
Is Triple-Digit Silver Realistic by 2026?
Mathematical analysis based on currency supply expansion, industrial demand growth, and historical ratio relationships suggests triple-digit silver represents a plausible scenario rather than speculative fantasy. The convergence of supply constraints, monetary policy, and geopolitical factors creates conditions similar to previous precious metals breakout periods.
Probability Assessment Factors:
- Supply deficit mathematics: Annual shortfalls approaching 200M ounces
- Monetary backdrop: M2 expansion providing currency debasement pressure
- Industrial demand: Solar and EV sectors requiring increasing silver consumption
- Geopolitical risks: Export restrictions creating supply uncertainty
What Would Trigger a Move to $100+ Silver?
Specific catalysts capable of triggering triple-digit silver include Federal Reserve policy reversals, physical supply shortages affecting industrial users, or geopolitical events disrupting major producing regions.
Critical Monitoring Indicators:
- Real interest rates approaching zero or negative levels
- ETF inventory depletion signalling physical shortage conditions
- Industrial user reports of delivery delays or cancellations
- Central bank digital currency announcements including precious metals backing
How Should Beginners Start Investing in Silver?
New precious metals investors should prioritise education before allocation, understanding silver's unique characteristics compared to traditional financial assets.
Beginner Implementation Strategy:
- Education phase: Study monetary history and precious metals fundamentals
- Initial allocation: Start with 1-2% portfolio weighting in physical silver
- Gradual expansion: Increase allocation based on comfort level and market conditions
- Storage planning: Arrange secure storage before making significant purchases
What's the Difference Between Silver Coins and Bars?
Silver coins offer higher liquidity and recognition advantages, whilst bars provide lower premium costs for larger investments. Government-minted coins include legal tender status, providing additional authenticity assurance.
Table: Popular Silver Investment Products Comparison
| Product Type | Liquidity | Premium Over Spot | Minimum Investment | Storage Efficiency |
|---|---|---|---|---|
| Government Coins | Highest | 15-25% | $35+ | Low |
| Private Rounds | High | 8-15% | $30+ | Medium |
| Small Bars (1-10oz) | Medium | 5-12% | $35+ | Medium |
| Large Bars (100oz+) | Medium | 2-5% | $2,500+ | High |
Strategic Assessment: Evaluating the Triple-Digit Silver Investment Thesis
Probability Framework Analysis
Weighing bullish versus bearish scenarios requires systematic analysis of fundamental drivers, technical indicators, and macroeconomic conditions. The convergence of supply constraints, monetary expansion, and industrial demand acceleration creates a more compelling case for silver appreciation than traditional technical analysis alone would suggest.
Consequently, triple-digit silver predictions from industry experts support the mathematical framework outlined above.
Risk-Reward Assessment:
- Upside scenario: 300-500% appreciation potential within 2-3 years
- Downside scenario: 20-30% decline during economic slowdown
- Base case: 50-100% appreciation driven by supply-demand fundamentals
The asymmetric risk-reward profile favours precious metals allocation, particularly for investors seeking portfolio diversification and inflation protection.
Key Monitoring Indicators
Successful silver investment timing requires monitoring specific economic indicators, market signals, and supply-demand metrics that precede major price movements. Therefore, investors considering whether will silver hit triple digits in 2026 should track these critical factors.
Monthly Silver Market Health Checklist:
- Federal Reserve monetary policy communications and real interest rate trends
- ETF inventory levels and institutional flow patterns
- Industrial demand reports from solar and automotive sectors
- Mining production updates and exploration investment levels
- Gold-to-silver ratio technical analysis and historical comparison
- Geopolitical developments affecting major producing regions
Regular assessment of these indicators provides early warning signals for both opportunity recognition and risk management in precious metals investing.
Disclaimer: This analysis is for educational purposes only and does not constitute investment advice. Precious metals investing involves substantial risk, including potential total loss. Past performance does not guarantee future results. Investors should consult qualified financial advisors before making investment decisions and consider their risk tolerance, investment timeline, and overall financial situation before allocating capital to precious metals or any other assets.
Curious About Triple-Digit Silver Investment Opportunities?
Explore how Discovery Alert's proprietary Discovery IQ model delivers instant notifications on significant ASX silver and precious metals discoveries, helping investors identify actionable opportunities before the broader market recognises their potential. Visit Discovery Alert's discoveries page to understand why historic mineral finds can generate substantial returns, then begin your 30-day free trial to position yourself ahead of the next major breakthrough.