July 24, 2026
When Logistics Become the Binding Constraint: Understanding the 2026 Oil Price Surge
Global oil markets have spent decades pricing geopolitical risk as a temporary premium layered on top of fundamentals. Wars start, tensions rise, prices spike, diplomacy intervenes, and the risk premium fades. This model worked because the physical infrastructure connecting producers to refiners always retained redundancy. However, what makes the current environment structurally different is the simultaneous impairment of those very redundancy pathways — a scenario where WTI higher as Middle East shipping risks multiply is not a headline but a mechanical outcome of supply system architecture breaking down.
When big ASX news breaks, our subscribers know first
The Architecture of a Supply-Risk Rally: What Makes This Crude Price Move Different?
Beyond Geopolitical Noise: Why This Is a Structural Pricing Event
Most geopolitical oil price spikes respond to a single disruption point. A pipeline is damaged, a terminal is struck, or a country imposes an embargo. Traders price the lost barrels, assess the replacement timeline, and gradually unwind the premium as clarity improves. The current rally is operating from a fundamentally different blueprint.
Markets are simultaneously pricing the operational impairment of two independent crude export corridors. This is not a scenario the modern oil market has confronted at this scale, and the absence of historical precedent is itself a driver of price elevation. When traders cannot reference a comparable episode to calibrate their risk models, they err on the side of caution and pay up for supply security.
The critical analytical distinction is between diplomatic risk and operational shipping risk. For most of the prior tension cycle around Iran, markets treated Hormuz disruption as a risk that negotiations could eventually resolve. That framing collapsed as U.S. military strikes entered their twelfth consecutive night by Thursday, July 24, 2026, eliminating any near-term diplomatic resolution narrative and shifting the pricing calculus from probability to operational reality. These crude oil price trends reflect a market repricing risk at a structural level.
WTI Price Performance: Week of July 21–24, 2026
| Metric | Value |
|---|---|
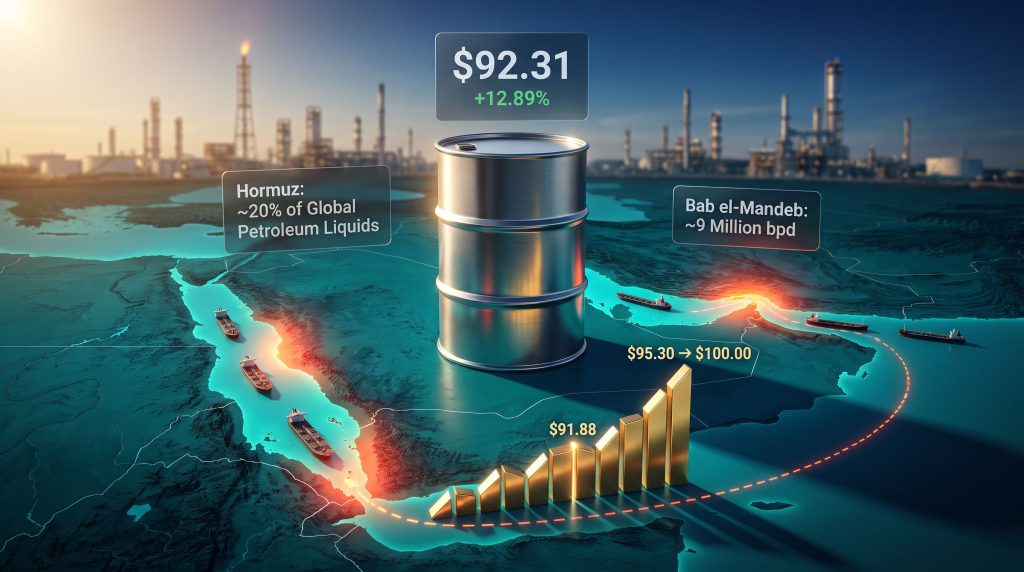
| September WTI Futures (Thursday Close) | $92.31/bbl |
| Weekly Low | $79.58/bbl |
| Weekly High | $92.31/bbl |
| Weekly Gain | +$10.54 (+12.89%) |
| Key Resistance Level | $91.88/bbl |
| Next Upside Target | $95.30/bbl |
| Psychological Ceiling | $100.00/bbl |
A $10.54 move in four sessions, representing a 12.89% weekly gain, is extraordinary by any measure. Understanding why it happened requires examining the supply system's chokepoint architecture in detail.
What Is the Strait of Hormuz and Why Does It Control Global Oil Prices?
The World's Most Critical Energy Chokepoint
The Strait of Hormuz is a narrow waterway separating Iran from Oman, connecting the Persian Gulf to the Gulf of Oman and onward to global shipping lanes. Under normal operating conditions, approximately 20 to 21% of global petroleum liquids transit this corridor daily, representing roughly 20 million barrels per day.
No other single point in global energy infrastructure carries this volume. The next most significant chokepoint, the Suez Canal, handles a substantially smaller share of global oil trade and offers meaningful rerouting alternatives via the Cape of Good Hope. Hormuz has no equivalent bypass. Persian Gulf producers cannot simply redirect their exports overland at the scale required to replace maritime volumes.
Iran's Revolutionary Guard Corps declared effective operational control over the strait during active U.S. military engagement. Combined with a reported tanker fire near Oman and accounts of mined shipping lanes in the strait's southern passage, multiple vessels reversed course or held position rather than risk transit. Whether each individual incident is immediately verifiable is secondary to market function. Tanker operators, marine insurers, and refinery procurement teams all make decisions based on route viability probability rather than confirmed incident data.
"When a chokepoint becomes operationally uncertain, the cost of moving barrels through it rises immediately. That cost is reflected in crude futures before a single barrel is delayed. Markets price forward risk, not confirmed losses."
The market pricing mechanism works through three sequential stages:
-
Insurance premiums spike as war-risk surcharges make voyages economically prohibitive for standard commercial operators.
-
Tanker availability contracts as vessels avoid high-risk zones, reducing effective fleet capacity on key shipping lanes.
-
Refinery procurement teams bid aggressively for alternative supply, intensifying price competition for non-Middle East barrels and pushing futures higher across the curve.
How Did the Red Sea Become a Second Supply Bottleneck?
The Bab el-Mandeb Strait: Saudi Arabia's Contingency Route Under Fire
Saudi Arabia's response to Hormuz pressure historically involved routing crude westward via pipeline to its Red Sea export terminal at Yanbu, bypassing Gulf shipping lanes entirely. This contingency corridor, which exits the Red Sea through the Bab el-Mandeb strait, has functioned as the global oil market's primary safety valve during periods of Hormuz tension.
Yemen's Houthi forces struck two Saudi oil tankers near the Bab el-Mandeb passage, directly targeting this backup architecture. Goldman Sachs estimated that approximately 9 million barrels per day transited this corridor in the month preceding the attacks, with analysts concluding that nearly 4 million barrels per day of that volume would be extremely difficult to reroute if both Hormuz and the Red Sea remain operationally impaired simultaneously.
| Chokepoint | Daily Volume at Risk | Primary Threat Actor | Alternative Route |
|---|---|---|---|
| Strait of Hormuz | ~20 million bpd | Iran (IRGC) | Red Sea / Suez |
| Bab el-Mandeb (Red Sea) | ~9 million bpd | Houthi Forces (Yemen) | Cape of Good Hope |
| Combined Disruption Scenario | Up to ~4 million bpd unroutable | Coordinated regional threat | No viable near-term alternative |
Two Chinese supertankers carrying approximately 4 million barrels of Saudi crude did successfully exit the Red Sea through Bab el-Mandeb during the week. Successful passage, however, does not indicate route security. The market simultaneously observed other vessels reversing course, slowing, or holding position due to security concerns.
Those decisions translate directly into longer voyages, elevated insurance costs, reduced vessel availability, and delayed delivery schedules — all of which eventually manifest in the price refiners must pay for crude. Furthermore, these geopolitical trade tensions continue to compound the logistical pressure refiners face globally.
"When Saudi Arabia's contingency export route faces the same threat environment as its primary Gulf corridor, the global supply system loses its redundancy buffer. That structural safety net is what historically prevented geopolitical price spikes from becoming sustained supply crises."
Why Are Diesel Margins Amplifying the Crude Price Rally?
Record Refining Economics Creating a Price Floor Under Crude Demand
The fuel market provided crude buyers with an independent reason to remain aggressive on price. European diesel crack spreads reached a record $66.25 per barrel on July 17, remaining elevated through the week of July 21. A crack spread represents the margin refiners earn by converting crude oil into refined products, and at $66.25 per barrel, processors faced powerful economic incentives to maximise throughput regardless of rising input costs.
This dynamic creates what traders describe as a demand floor under crude. Refiners are not purchasing barrels for inventory storage at these prices. They are purchasing barrels because the downstream fuel market is actively paying them to run at capacity. U.S. refinery utilisation reaching 96.2% during this period confirms that this dynamic is operational rather than theoretical.
The erosion of the Russian crude discount is an underappreciated amplifier in this environment. Russian barrels had been trading at significant discounts to Brent for much of the prior period, providing Asian and Indian refiners with a cost buffer against Middle East supply tightness. As competition for non-Middle East crude intensified, those discounts narrowed materially, eliminating a secondary shock absorber that had been quietly suppressing price pressure.
The fuel market tightness cascade operates through four interconnected steps:
-
Middle East supply disruption reduces Gulf crude flows to Asian and European refiners.
-
Russian crude discount compression removes the low-cost alternative barrel that had been absorbing regional demand.
-
Record diesel margins keep refiners bidding aggressively for available crude at maximum run rates.
-
Competing demand from Asia, Europe, and North America drives price support at every tier of the supply chain.
Did the U.S. Inventory Build Matter? Unpacking the Weekly EIA Data
Why a 2-Million-Barrel Build Failed to Pressure WTI
The weekly U.S. Energy Information Administration inventory report offered a potential bearish counterargument when crude stocks rose by 2 million barrels for the week ending July 17, against analyst expectations of a draw. Under conventional market conditions, a build of this magnitude would represent a meaningful headwind for futures prices.
In the current environment, the data point was functionally overridden by forward-looking shipping risk analysis. The market's attention was focused on barrels already at sea and how long they would take to reach refiners given route disruptions, not on domestic stock levels recorded a week earlier.
Several contextual factors further diminished the build's bearish significance:
-
The increase arrived after months of sustained inventory draws and strategic petroleum reserve releases that had already depressed baseline stock levels.
-
Global inventories remain structurally below pre-conflict levels despite the weekly increase.
-
Seasonal summer demand, reduced Middle East production volumes, and fewer emergency supply releases into the market maintain the underlying supply deficit.
-
The weekly build represents a domestic snapshot that says nothing about the logistical risk premium embedded in forward contracts for barrels that have not yet arrived at U.S. refineries.
The next major ASX story will hit our subscribers first
What Are the Technical Price Levels Traders Are Watching?
Key Support and Resistance Framework for September WTI Futures
The technical structure of September WTI futures reveals both the strength of the current move and its potential vulnerabilities. The contract recaptured the critical retracement zone between $81.21 and $84.53, converting former resistance into new support. This zone now serves as the first line of defence on any corrective pullback.
| Level | Role | Significance |
|---|---|---|
| $110.00 | Extended upside target | Multi-year resistance zone |
| $105.21 | Secondary upside target | Technical projection |
| $100.00 | Psychological ceiling | Key sentiment threshold |
| $95.30 | May swing high / resistance | Trend-change confirmation level |
| $91.88 | Directional pivot | Bull/bear decision point |
| $84.53–$81.21 | Minor support zone | First pullback target |
| $75.40–$70.70 | Major support band | Longer-term retracement zone |
| $68.60 | 52-week moving average | Structural bear threshold |
| $67.12 | Main cycle bottom | Long-term floor |
"The directional pivot for September WTI futures sits at $91.88/bbl. Sustained price action above this level signals genuine buyer conviction rather than short-covering, and opens the path toward $95.30, then the psychologically significant $100.00 threshold. A failure to hold $91.88 shifts near-term focus to the $84.53–$81.21 support band."
Bullish scenario: A sustained close above $91.88 confirms new buying is entering the market, not just short position unwinding. Clearing the May swing high at $95.30 with conviction would shift the weekly trend structure to unambiguously bullish and bring $100, $105.21, and $110.00 onto the active radar.
Bearish scenario: Failure to hold $91.88 redirects attention to the $84.53–$81.21 support zone. A deeper decline tests $75.40–$70.70. The structural bear case only activates if the 52-week moving average near $68.60 fails, a threshold that appears remote given current fundamental conditions.
A critical distinction for interpreting next week's price action is whether buyers are passive bidders waiting for dips or aggressive buyers willing to actively take out offers above current levels. The answer to that question will determine whether the rally has the momentum to challenge $95.30.
How Are Asian Energy Markets Responding to the Disruption?
China, India, and the Race to Secure Alternative Supply
Asian energy markets are reorganising with considerable urgency. China has accelerated purchases of Russian crude as Middle East supply risk intensifies, seeking to reduce exposure to Hormuz-dependent barrels. Notably, U.S. officials reported that China had slashed Iranian oil purchases by roughly 40%, a significant shift in procurement strategy that also reduces Chinese exposure to sanctioned supply chains during a period of active U.S. military engagement.
India's response has been characterised by a more complex balancing act. The country pulled back from Iraqi crude imports as Hormuz transit risk became operationally prohibitive for some cargo schedules, while simultaneously maintaining Russian crude purchases at near-record pace despite an expired sanctions waiver. India's position as the world's largest long-term LNG buyer in 2025, according to GIIGNL data, reflects the broader energy security diversification strategy the country has been executing over multiple years.
Pakistan faces a more acute vulnerability. Without the procurement scale of China or India, Pakistan is paying record spot LNG premiums as Qatar supply faces disruption, while simultaneously scrambling for oil alternatives as both Hormuz and Red Sea risks mount.
The IMF has flagged elevated oil prices as a material risk to India's GDP growth trajectory, highlighting the macro-level feedback loop between Middle East supply disruption and emerging market economic performance. For economies that import a substantial share of their energy needs, sustained oil prices at current levels represent a meaningful drag on growth, inflation management, and current account balances.
The earnings environment for upstream producers has confirmed the physical tightness from a different angle. TotalEnergies reported a 68% profit surge driven by the oil price environment, while Equinor's quarterly profit rose 93% on the back of the oil and gas price spike. These numbers reflect genuine margin expansion rather than accounting adjustments, validating that the supply system is generating extraordinary returns for producers precisely because physical availability is constrained relative to demand. In addition, the OPEC market influence over spare capacity decisions continues to shape how quickly this imbalance can be corrected.
What Would Bring WTI Back Down? Conditions for a Price Reversal
Three Scenarios That Could Deflate the Risk Premium
Scenario 1: Credible Ceasefire Agreement. A verifiable U.S.-Iran ceasefire would immediately reduce IRGC threats to Hormuz transit. The price impact would likely be swift, with potential for a $10–15 per barrel correction within days as the geopolitical premium unwinds. The qualifier is verifiability. A ceasefire announcement without observable operational changes in the strait would have limited market impact.
Scenario 2: Verified Tanker Traffic Resumption. Confirmed safe passage of multiple commercial vessels through both Hormuz and Bab el-Mandeb, across several consecutive days, would begin compressing freight and insurance premiums. The crude price impact would be gradual rather than immediate, as insurers and tanker operators require a sustained safety record before normalising pricing.
Scenario 3: OPEC+ Emergency Supply Response. A coordinated release of spare capacity from Gulf producers with viable land-based export alternatives could partially offset supply concerns. This scenario has meaningful limitations. Saudi spare capacity exists, but its export optionality is constrained by the same dual threat to its primary and secondary shipping corridors that is driving the current rally.
"None of these scenarios appears imminent as of late July 2026. The market's forward pricing reflects this absence of a credible near-term resolution pathway, which is precisely why the risk premium has proven resistant to conventional bearish data inputs like the inventory build."
The Higher-For-Longer Risk Premium Thesis: Strategic Outlook
Why Logistical Risk, Not Production Capacity, Is the Binding Constraint
The oil market has entered a phase where the binding constraint on supply availability is not production capacity but rather the infrastructure required to move barrels from producers to refiners safely and economically. Saudi Arabia's spare production capacity remains largely intact. The problem is not how many barrels can be extracted from the ground but how many barrels can be safely exported through corridors now contested by military and paramilitary actors.
This distinction matters enormously for the duration of the current price elevation. Production-side constraints, whether from OPEC+ quotas, field decline rates, or capital expenditure cycles, respond to price signals over periods of months to years. Logistical constraints tied to active military conflict can resolve rapidly with a ceasefire or persist indefinitely without one. Consequently, the oil price movements we are witnessing reflect this structural uncertainty rather than temporary speculative excess.
The airline sector provides a useful downstream illustration of physical tightness cascading through the supply chain. Ryanair reported a 36% profit decline as unhedged jet fuel costs doubled, a consequence of the same supply disruption dynamics affecting crude futures. When carriers without fuel hedging programs face doubled input costs, the physical reality of tight fuel markets is confirmed beyond what any futures price alone can convey.
For market participants, the current environment reflects a supply system whose redundancy architecture has been temporarily disabled. The risk premium embedded in WTI higher as Middle East shipping risks multiply is not speculative excess — it is the price of physical uncertainty in a world where the two largest crude export corridors are simultaneously contested, refining margins are at record levels, alternative supply discounts have compressed, and no credible resolution timeline exists.
Furthermore, the commodity market volatility generated by this environment is prompting traders and procurement teams globally to reassess hedging strategies and supply diversification priorities. The next move depends on shipping lanes, not diplomatic statements. Analysts tracking Middle East supply disruptions suggest WTI higher as Middle East shipping risks multiply could persist well into the coming months if no verifiable resolution emerges.
This article is intended for informational and educational purposes only and does not constitute financial or investment advice. Crude oil price forecasts, technical levels, and scenario projections involve inherent uncertainty and may not reflect actual future market outcomes. Readers should conduct their own research and consult qualified financial professionals before making investment decisions.
Want to Identify High-Potential ASX Opportunities Before the Broader Market Does?
Commodity price surges driven by structural supply disruptions — like those reshaping global oil markets — frequently trigger significant re-ratings across ASX-listed energy and resources stocks, and Discovery Alert's proprietary Discovery IQ model delivers real-time alerts the moment significant mineral and resource discoveries hit the exchange, ensuring subscribers can act on actionable opportunities ahead of the crowd. Explore historic discovery returns on Discovery Alert's dedicated discoveries page and begin a 14-day free trial to secure a genuine market-leading edge.