July 8, 2026
The Physical Backbone of the Digital Age: Understanding the AI and Clean Energy Commodity Supercycle
Most investors think about artificial intelligence through the lens of software, semiconductors, and data. But beneath every large language model, every autonomous system, and every hyperscale data centre lies something far more tangible: tonnes of copper wire, kilometres of transmission cable, and minerals extracted from some of the most geologically complex deposits on earth. The AI and clean energy commodity supercycle is not a speculative abstraction. It is a structural collision between rapidly accelerating demand and a supply base that operates on decade-long timescales. Understanding why that collision is happening, and what it means for commodities, portfolios, and the global economy, requires stepping back from quarterly earnings and looking at the physical architecture of the energy and digital transition.
When big ASX news breaks, our subscribers know first
What Commodity Supercycles Actually Are, and Why This One Stands Apart
A commodity supercycle is fundamentally different from the price spikes that follow supply disruptions or short-term demand surges. Where a typical cyclical rally might last two to four years before market forces rebalance, a true supercycle is characterised by a sustained structural misalignment between demand growth and supply capacity, one that persists across multiple years and even decades.
Three conditions have historically defined supercycle onset: a broad convergence of demand drivers that compound each other rather than substitute for one another, supply inelasticity rooted in long lead times and capital constraints, and a policy environment that reinforces rather than moderates demand. All three are present today.
Analysis of over 113 years of inflation-adjusted commodity price data places the most recent cycle trough in 2020. As of 2026, the current upswing is approximately six years old. Historically, supercycles have run between 13 and 21 years from trough to peak, which positions today's environment not at a ceiling but at the early-to-mid stage of a prolonged structural move. Furthermore, commodity prices still sit slightly below their long-run inflation-adjusted average, which means the market is not pricing in excess optimism. It is still correcting from a period of structural undervaluation.
Historically, supercycles have run 13 to 21 years, suggesting the current cycle, which began in 2020, may have 7 to 15 years of structural runway remaining based on prior patterns alone.
Three Demand Engines Firing Simultaneously
What makes the current AI and clean energy commodity supercycle structurally distinct from prior cycles is not the size of any single demand driver but the simultaneous activation of three independent demand engines, each of which would be meaningful in isolation. Together, they represent an unprecedented convergence. As a recent analysis of the AI-driven supercycle notes, this multi-driver dynamic is precisely what separates the current cycle from its predecessors.
Demand Engine One: The Electrification of Computing
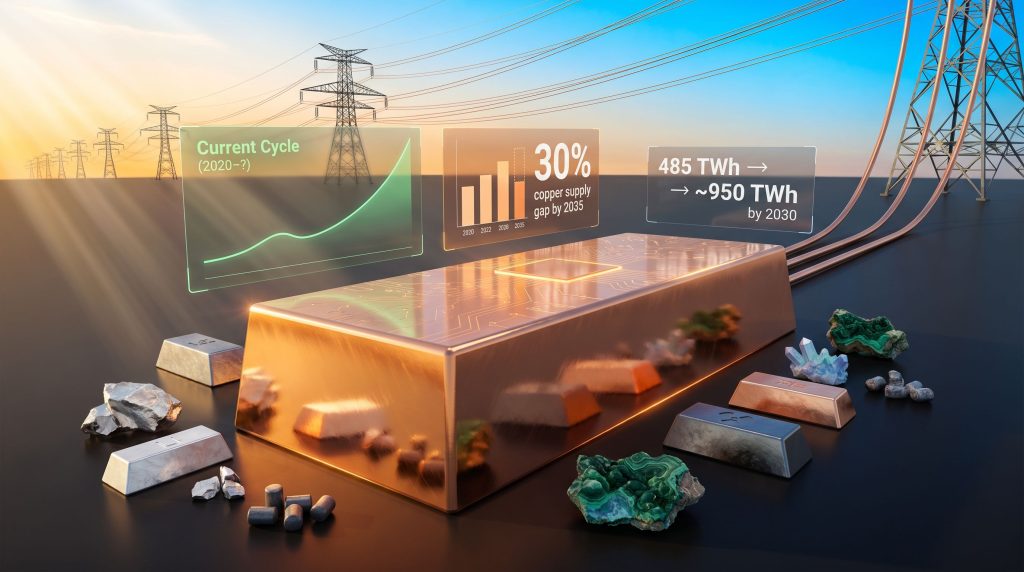
Artificial intelligence does not exist in the cloud. It exists in physical facilities, cooled by water and copper-wound systems, powered by grid electricity, and connected by fibre and high-voltage transmission infrastructure. Global data centre electricity consumption reached approximately 485 TWh in 2025, a figure the International Energy Agency projects could approach 950 TWh by 2030, representing close to 3% of total global electricity use at that point.
A separate analytical lens focused specifically on AI-optimised infrastructure shows an even more dramatic trajectory: AI-dedicated data centre power demand may grow sixfold, from approximately 74 TWh in 2022 to an estimated 500 TWh by 2027. Each new hyperscale facility built to support this demand requires substantial quantities of copper for power distribution, cooling loops, and external grid connections.
One detail that tends to be underappreciated outside specialist circles is that the copper intensity of data centres is not uniform. Older enterprise data centres were built to relatively modest power densities. Next-generation AI facilities running GPU clusters operate at power densities that can be five to ten times higher per rack, requiring proportionally more copper per square metre of floor space, particularly in high-current busbars, liquid cooling manifolds, and transformer connections.
Demand Engine Two: The Materials Reality of Clean Energy
Renewable energy infrastructure is often discussed in terms of carbon reduction targets and cost curves for solar and wind generation. What receives far less attention is the materials intensity of that transition. Unlike fossil fuel systems, which are largely built around extraction and combustion, clean energy systems rely on metals at every functional layer: generation, transmission, storage, and end use.
A single offshore wind turbine can contain up to 9,000 kilograms of copper across its generator, cabling, and grid connection components. An electric vehicle uses roughly two to four times the copper of an equivalent internal combustion engine vehicle. Grid-scale battery storage, which is essential for managing the intermittency of solar and wind generation, adds further demand for lithium, nickel, cobalt, and manganese.
The structural consequence is that the energy transition cannot be decarbonised without first being mineralised. There is no pathway to a low-carbon grid that bypasses the mining sector. The critical minerals demand stemming from clean energy buildout is, consequently, not a niche investment story but a macro-structural reality.
Demand Engine Three: Reshoring and Strategic Industrial Policy
The third demand engine is arguably the least visible but potentially the most durable. Geopolitical fragmentation across North America, Europe, and Asia has triggered a sustained effort to repatriate strategic manufacturing capacity. Semiconductor fabrication plants, battery gigafactories, and defence industrial facilities all require base metals and critical minerals at scale.
What distinguishes policy-backed demand from market-driven demand is its relative price insensitivity. Governments building strategic infrastructure to reduce supply chain vulnerability are not optimising for commodity input costs in the way private developers might. This characteristic makes reshoring-driven demand structurally stickier and less susceptible to the price-driven demand destruction that normally acts as a natural ceiling on commodity rallies.
The Copper Supply Crisis: A Problem Seventeen Years in the Making
Copper occupies a unique position in the current cycle because it is simultaneously the most demand-exposed metal and the one facing the most severe structural supply constraints. The copper supply crunch is rooted in timelines that cannot be accelerated by capital alone. From initial discovery to first commercial production, a new copper mine typically requires 17 to 18 years.
This figure reflects the compounding delays inherent in exploration, resource definition, feasibility studies, environmental approvals, community consultation, financing, engineering, and construction. It is not a regulatory anomaly or a project management failure. It is the structural reality of large-scale hard rock mining.
The implication is stark: projects approved today cannot materially address a supply gap that emerges in the next decade. The production that will supply global copper demand in the early 2030s is already largely determined by projects already in construction or advanced development. The pipeline beyond that is thin.
| Application | Key Copper Demand Driver |
|---|---|
| AI Data Centres | Power distribution, cooling systems, grid connections |
| Electric Vehicles | Motors, battery systems, onboard charging infrastructure |
| Offshore Wind | Generators, subsea cables, transformer stations |
| Grid Modernisation | Transmission lines, substations, transformers |
| Solar Installations | Inverters, wiring, utility-scale grid interconnection |
Compounding the timeline problem, ore grades at operating copper mines have been declining steadily for decades. The average copper ore grade processed globally today is materially lower than it was thirty years ago, which means more rock must be moved, more energy consumed, and more water used to produce the same quantity of refined metal. This grade decline acts as a slow-moving structural headwind on effective supply growth even at existing operations.
The IEA projects a potential 30% copper supply gap by 2035, while S&P Global anticipates a structural shortfall extending toward 2040, a deficit window that aligns almost precisely with the projected duration of the current supercycle.
The Geopolitical Layer: Concentration Risk in Refining
Beyond the physical supply pipeline, there is a geopolitical dimension to the copper and critical minerals supply story that elevates it from a market phenomenon to a matter of national economic security. The majority of the world's copper, lithium, cobalt, and rare earth supply chains are not only concentrated in a small number of mining countries but are overwhelmingly refined through a single dominant nation's industrial infrastructure.
China currently controls the refining capacity for the vast majority of critical minerals used in clean energy and technology applications. This concentration transforms the dynamics of the supply-demand equation, meaning that even nations with domestic mining capacity remain exposed to processing bottlenecks that are geographically and politically concentrated. Consequently, supply-side constraints are not purely geological or financial. They are also geopolitical, which makes them harder and slower to resolve.
A Tiered Framework: Which Commodities Benefit Most?
Not all commodities participate equally in a structural supercycle. A tiered framework helps clarify where demand exposure is highest, where supply constraints are most acute, and where policy reinforcement adds additional structural support.
| Tier | Commodities | Primary Driver |
|---|---|---|
| Tier 1: Highest Direct Exposure | Copper, Uranium | AI infrastructure + clean energy baseload |
| Tier 2: Structural Tailwinds | Lithium, Aluminium, Steel | EV batteries, lightweight manufacturing, grid buildout |
| Tier 3: Policy-Driven Emergence | Rare Earths, Nickel, Cobalt | EV motors, battery chemistry, defence applications |
Uranium deserves specific attention within Tier 1. The uranium market trends have shifted markedly as the renewed interest in nuclear energy as a firm, low-carbon baseload power source for AI-heavy electricity grids has driven a significant reassessment of uranium's demand outlook. Several major technology companies have announced agreements to source nuclear power for their data centre portfolios, reflecting both the reliability requirements of AI workloads and the carbon commitments of their operators.
Rare earth elements represent perhaps the least understood dimension of the supercycle for generalist investors. These seventeen elements are not rare in geological terms; several are reasonably abundant in the earth's crust. What makes them scarce in economic terms is the difficulty and environmental complexity of separating and refining them into usable forms, combined with the geographic concentration of both deposits and processing infrastructure.
Permanent magnets made from neodymium and dysprosium are essential for the motors used in electric vehicles and direct-drive wind turbines. There is currently no commercially viable substitute that does not trade one critical mineral dependency for another.
Investor Framework: Thinking About Supercycle Positioning
Disclaimer: The following section contains analytical perspectives and strategic frameworks for educational purposes only. It does not constitute financial advice. Past supercycle patterns are not guaranteed to repeat. Investors should conduct their own due diligence and consult qualified financial advisers before making investment decisions.
Distinguishing Short-Term Volatility from Structural Trend
One of the most important cognitive challenges for investors navigating a structural supercycle is separating near-term price volatility from the underlying structural trend. Short-term movements in gold and oil are driven substantially by sentiment, currency dynamics, and geopolitical news flow. These fluctuations can obscure the slower-moving but more durable shift building in the copper and uranium outlook and in critical minerals more broadly.
Analysts covering the commodity sector have noted that structural strength in copper is emerging even as short-term volatility in more liquid commodity markets captures most of the financial media attention. This divergence between signal and noise is characteristic of early-to-mid supercycle environments, where the structural case is strengthening but has not yet been fully priced by broader market participants.
A Portfolio Construction Lens for Supercycle Exposure
A thoughtful approach to supercycle positioning recognises that the AI buildout and the commodity supercycle are not separate investment theses competing for capital. They are causally linked structural trends: technology infrastructure demand directly generates commodity demand. A detailed assessment of how this dynamic is evolving provides useful context for investors considering long-term positioning.
Positioning frameworks discussed in analyst circles tend to organise exposure across three broad categories:
- AI and hardware infrastructure companies directly building and operating data centre capacity.
- Commodities and energy materials with high supercycle exposure, including copper producers, uranium royalty companies, and critical mineral developers.
- Defensive positioning through cash reserves, precious metals, or hedging instruments to manage the volatility inherent in a commodity-heavy portfolio.
The entry timing logic for supercycle investing also differs from cyclical commodity trading. In a confirmed structural supercycle, the long-term floor for commodity prices is progressively rising with each year of supply underinvestment. This means that investors who wait for a perfect entry point may find that the structural floor has moved higher by the time they act.
Historical Supercycle Patterns: What the Record Shows
| Supercycle Era | Primary Demand Driver | Approximate Duration | Key Commodities |
|---|---|---|---|
| Post-WWII Reconstruction | Industrial rebuilding across Europe and Japan | ~15 years | Steel, coal, oil |
| 1970s Energy Crisis | Oil supply shock and petrodollar recycling | ~10 years | Oil, gold |
| China Industrialisation (2000s) | Rapid urbanisation and export manufacturing | ~13 years | Iron ore, copper, coal |
| Current Cycle (2020 onwards) | AI infrastructure + clean energy + reshoring | Projected 13-21 years | Copper, lithium, uranium, rare earths |
A critical structural difference between the current cycle and the China-driven supercycle of the early 2000s is geographic distribution. The earlier cycle was concentrated in a single nation's development trajectory, meaning that when China's fixed asset investment cycle matured and moderated, the commodity demand pulse faded with it.
The current AI and clean energy commodity supercycle, however, draws demand from every major economy simultaneously, through AI adoption, clean energy mandates, and reshoring industrial policy. This multi-polar demand base gives the current cycle a structural durability that the China cycle lacked in its latter stages.
The next major ASX story will hit our subscribers first
Power Infrastructure: The Derivative Play on Both Supercycle Drivers
A dimension of this structural cycle that is sometimes overlooked in commodity-focused analysis is the role of power infrastructure itself as a derivative investment theme. The electricity grids of most developed economies were engineered for a load profile that no longer reflects emerging demand realities. AI data centres require high-capacity, highly reliable power delivery with low tolerance for outages.
Grid modernisation is therefore simultaneously a consequence of the AI supercycle and a prerequisite for the clean energy transition. Investment in transmission infrastructure, transformer capacity, and substation upgrades is being pulled forward by necessity rather than strategic choice. This creates a sustained capital expenditure cycle in power infrastructure components, many of which are themselves copper-intensive.
Emerging markets across Asia and Sub-Saharan Africa represent the next sequential wave of electrification demand. As energy access expands in these regions, the incremental copper and infrastructure requirements will layer onto the existing demand pulse from developed economy AI and energy transition spending.
Frequently Asked Questions
What is a commodity supercycle and how long do they typically last?
A commodity supercycle is a prolonged structural period of elevated prices driven by a sustained mismatch between surging demand and slow-to-expand supply. Historically, supercycles have lasted between 13 and 21 years, distinguishing them clearly from shorter cyclical price rallies that typically resolve within two to four years.
Why is copper considered the central metal in the current supercycle?
Copper is the primary conductor of electricity and is embedded throughout AI data centre infrastructure, electric vehicles, renewable energy systems, and power grid upgrades. Its unique combination of high demand exposure across multiple end-use sectors and severe supply constraints, including an IEA-projected 30% supply gap by 2035, makes it the most structurally significant commodity of the current cycle.
When did the current commodity supercycle begin?
Analysis of over a century of inflation-adjusted commodity price data places the most recent cycle trough in 2020, establishing the current upswing as approximately six years old as of 2026.
Could efficiency improvements in AI technology undermine the commodity supercycle thesis?
While advances in chip efficiency and model compression could moderate the rate of data centre energy demand growth, the structural supply deficit in copper and critical minerals is sufficiently entrenched, given the 17 to 18-year mine development timeline, that even a moderation in demand growth is unlikely to close the supply gap before the mid-2030s. Supply-side underinvestment over the past decade has created a structural deficit that efficiency gains alone cannot quickly resolve.
How does ore grade decline affect the copper supply outlook?
Ore grade decline is a geological reality that operates as a slow-moving but powerful headwind on effective copper supply. As the average grade of ore processed falls, mines must extract and process proportionally more material to produce the same refined output. This increases operating costs, energy consumption, and water use, whilst simultaneously reducing per-unit production efficiency. The effect is to erode the real productive capacity of the existing mine base even without any reduction in nominal throughput.
The Structural Case for Long-Term Commodity Exposure
The AI and clean energy commodity supercycle represents something genuinely unusual in the history of materials markets: a simultaneous structural demand pulse from technology, energy policy, and national security imperatives spanning every major economy. Previous supercycles were powerful but concentrated. This one is both distributed and policy-reinforced in ways that make it considerably harder to moderate through normal market mechanisms.
Commodity prices remain below their long-run inflation-adjusted average despite six years of upcycle. The supply pipeline for copper and critical minerals remains constrained by geological, financial, and geopolitical factors that cannot be resolved quickly. The demand drivers, from AI compute expansion to clean energy buildout to industrial reshoring, are not cyclical phenomena likely to fade in the next business cycle. They are decade-long structural commitments backed by capital expenditure decisions already made and announced.
For investors with sufficient time horizon and risk tolerance, the structural argument for exposure to copper, uranium, lithium, and rare earth elements is as coherent as it has been at any point in the current cycle. The physical backbone of the digital and clean energy economy must be built from materials that come from the ground. And the ground is not keeping pace.
This article is intended for informational and educational purposes only and does not constitute financial or investment advice. Forecasts, projections, and historical analogies involve inherent uncertainty and should not be relied upon as predictions of future outcomes. Readers should seek independent professional advice before making investment decisions.
Want to Know When the Next Major Mineral Discovery Hits the ASX?
Discovery Alert's proprietary Discovery IQ model delivers real-time alerts on significant ASX mineral discoveries across copper, uranium, lithium, rare earths, and beyond — instantly translating complex geological data into actionable investment insights for traders and long-term investors alike. Explore historic examples of exceptional discovery returns and begin your 14-day free trial at Discovery Alert to position yourself ahead of the market.