June 3, 2026
When Software Meets Copper: The Physical Constraint Behind the AI Revolution
Every major technology transition in history has eventually collided with the physical world. The railway boom required steel. The semiconductor revolution required silicon. The current artificial intelligence expansion is no different, and the AI data center copper demand supply gap has emerged as one of the defining constraints of this era. Copper, valued for millennia for its workability and conductivity, has become the material bottleneck standing between hyperscaler ambition and actual compute capacity. Understanding why requires examining the intersection of physics, geology, commodity economics, and capital markets simultaneously.
When big ASX news breaks, our subscribers know first
How AI Data Centres Create an Entirely Different Copper Demand Profile
The previous wave of digital infrastructure investment, encompassing cloud computing, social media platforms, and streaming services, operated within manageable power envelopes. Conventional enterprise server racks drew between 5 and 10 kilowatts of power, a load that existing electrical infrastructure could accommodate with modest upgrades.
AI workloads have broken that design assumption entirely. Graphics processing unit clusters running large language model training now operate at 130 kilowatts per rack as a standard configuration. NVIDIA's published Rubin Ultra roadmap for the second half of 2027 targets up to 600 kilowatts per rack in next-generation deployments. That is a 60-fold increase in power density relative to the conventional enterprise baseline, and it carries direct physical consequences that cannot be engineered away.
The physics are straightforward: every kilowatt of compute power becomes a kilowatt of heat. Removing that heat while simultaneously delivering the electrical power to sustain it requires copper at every stage of the infrastructure stack. The table below illustrates where copper is embedded across a modern AI data centre:
| Infrastructure Layer | Copper Application | Relative Intensity |
|---|---|---|
| Grid connection and transformers | High-conductivity windings, busbars | Very High |
| Power distribution units | Cable runs, switchgear | High |
| Rack-level delivery | Busbars, power rails | High |
| Thermal management | Direct-to-chip copper cold plates | Very High |
| Redundant power pathways | Backup cable infrastructure | Medium |
| Cooling distribution loops | Copper piping, manifolds | Medium |
Direct-to-chip liquid cooling, now standard in high-density AI clusters, uses copper cold plates machined to sit directly against processor packages. This approach extracts heat orders of magnitude more efficiently than air cooling, but it requires copper plumbing infrastructure that conventional data centres never needed. Furthermore, there is no commercially deployed substitute material that matches copper's combined electrical conductivity and thermal transfer performance at these operating densities. Aluminium falls short on conductivity. Silver is commercially prohibitive at infrastructure scale. Advanced composites remain laboratory-stage.
The Copper Intensity Gap Between Legacy and AI-Optimised Facilities
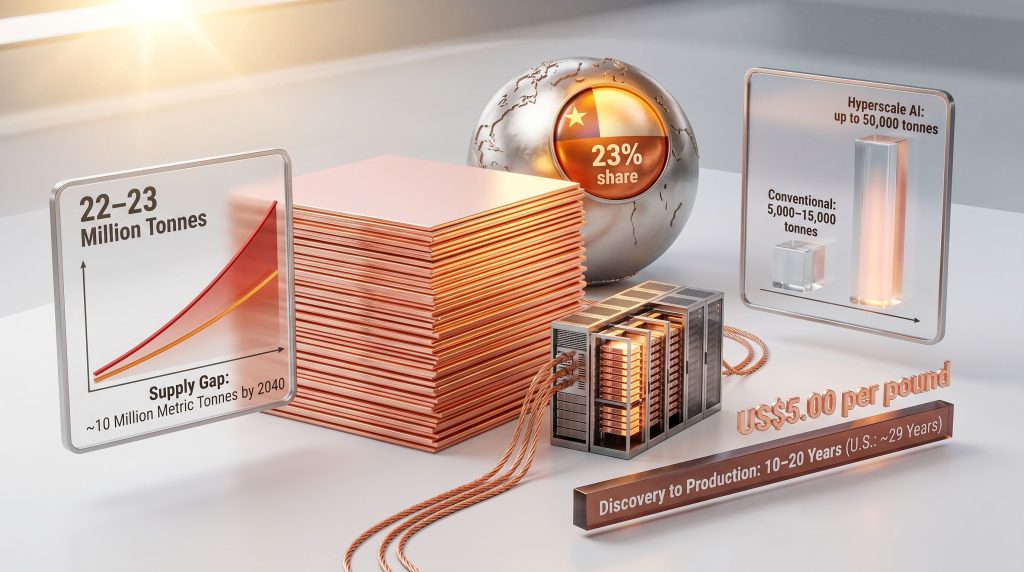
The practical consequence of this architectural shift is a dramatic divergence in per-facility copper consumption. As highlighted by BHP's analysis of AI and data centre infrastructure, the scale of this divergence is unprecedented in the history of digital infrastructure buildout:
- Conventional data centre facilities: 5,000 to 15,000 tonnes of copper per site
- Hyperscale AI-optimised facilities: up to 50,000 tonnes of copper per site
- Incremental copper demand from AI infrastructure through 2040: approximately 2 million metric tonnes (S&P Global)
- Data centre copper demand trajectory: 1.1 million metric tonnes in 2025, rising to 2.5 million metric tonnes by 2040
Marimaca Copper CEO Hayden Locke has observed that the supply pressure extends well beyond the mine gate itself, with transformer availability becoming an acute concern driven directly by copper supply constraints affecting the broader electrical infrastructure ecosystem. This feedback loop, where copper scarcity in one part of the supply chain creates bottlenecks further downstream, illustrates how tightly coupled the AI data center copper demand supply gap has become with broader industrial systems.
The Supply Response Problem: Why Mining Cannot Scale Like Software
Technology companies routinely commission, construct, and activate new data centre capacity within 18 to 36 months of an investment decision. However, the upstream mineral supply chains underpinning that capacity operate on entirely different temporal logic. Understanding the structural inelasticity of copper mine supply is the single most important analytical framework for assessing this market. The copper supply crunch is not a temporary inconvenience but a structural feature of how the mining industry operates.
The Multi-Decade Mine Development Timeline
A copper deposit does not become a mine simply because the metal price rises. It must progress through a sequential series of technical, regulatory, and financial milestones, each of which consumes years and capital:
- Initial discovery and geological mapping – 2 to 5 years
- Resource classification drilling (progressing from Inferred through Indicated to Measured) – 3 to 7 years
- Preliminary and pre-feasibility economic studies – 1 to 3 years
- Environmental impact assessment and permitting – 3 to 10+ years
- Definitive feasibility study and project financing – 1 to 3 years
- Construction and commissioning – 3 to 5 years
Total elapsed time from discovery to first production commonly spans 10 to 20 years. In the United States specifically, the average discovery-to-production timeline is estimated at approximately 29 years, making the domestic mining sector structurally incapable of responding to near-term demand acceleration regardless of the price incentive offered.
It is worth understanding what resource classification actually means in practice, as it governs which projects can attract financing. Inferred resources represent early-stage drilling results with insufficient geological density to support economic studies. Indicated resources carry enough confidence to underpin preliminary economic assessments. Measured resources, the highest classification, support full feasibility studies and represent the only category bankable for major project financing. The journey from initial discovery to a measured resource base typically consumes five to ten years and tens of millions of dollars in exploration expenditure alone. For investors, interpreting drill results correctly is therefore essential to understanding where any given project sits on this development timeline.
Global Supply vs. the Scale of Emerging Demand
Global copper mine production currently runs at approximately 22 to 23 million tonnes per year. Chile alone contributes roughly 23% of annual global output, making it simultaneously the most critical single jurisdiction for supply continuity and the most consequential geography for new discovery potential. Peru, the Democratic Republic of Congo, and the United States collectively account for a further substantial share of global production, each carrying distinct geopolitical, regulatory, and operational risk profiles.
| Forecast Horizon | Estimated Supply Gap | Primary Source |
|---|---|---|
| 2026 (near-term) | ~150,000 metric tonnes refined deficit | Industry consensus |
| 2028 (peak AI capex cycle) | ~400,000 tonnes/year from data centers alone | BNEF |
| 2035 | Up to 6 million tonnes cumulative | BNEF |
| 2040 | ~10 million metric tonnes shortfall | S&P Global / Wood Mackenzie |
Macro Risk Flag: Geographic concentration in copper production creates systemic vulnerability. A single regulatory disruption, labour dispute, or water-access constraint in Chile can materially tighten global refined copper availability within months, a dynamic that AI infrastructure investment timelines cannot absorb.
Declining Ore Grades Are Compounding Capital Intensity
A factor that rarely receives sufficient attention in mainstream coverage is the progressive decline of copper ore grades at operating mines worldwide. As the highest-grade deposits are depleted, the industry relies increasingly on lower-grade ore bodies requiring greater energy input, larger processing volumes, and more extensive tailings infrastructure per tonne of copper produced. This structural grade decline raises the floor price at which new mines become economically viable, independently of broader construction cost inflation.
Consequently, the copper price growth drivers now extend well beyond simple demand growth, incorporating a cost-side inflation dynamic that makes supply response even more challenging than headline demand forecasts suggest.
The Incentive Price Threshold and What It Takes to Build a New Mine
The incentive price is the industry term for the sustained copper price required to justify a major new mine investment. It is not static. It reflects the capital cost environment at the time a project reaches final investment decision, and that environment has shifted materially over the past decade.
Construction cost inflation, driven by higher labour rates, energy costs, equipment prices, and more demanding environmental and tailings management requirements, has pushed the greenfield incentive price for copper above US$5.00 per pound for most open-pit sulphide projects. The financing community assesses project viability against a consistent set of economic metrics:
| Metric | Threshold for Financing Viability |
|---|---|
| Post-tax internal rate of return | Above 15% at 8% discount rate |
| Payback period | Typically under 5 years preferred |
| All-in sustaining cost | Below long-run incentive price |
| Net present value | Positive at base-case metal price |
To illustrate the scale of capital required, Selkirk Copper CEO Colin Joudrie has noted that a hypothetical greenfield project targeting approximately 30,000 tonnes of annual copper production with a 12 to 15-year mine life would require somewhere in the range of US$800 to US$900 million to bring into production in today's cost environment, and that assumes strong Indigenous support and clear permitting conditions are already in place. This figure underscores why the financing mathematics for new copper supply are challenging even at elevated metal prices.
How Different Project Types Are Positioned in a Supply-Constrained Market
Not all copper assets benefit equally from higher prices and tighter supply. Financing probability, not geological potential alone, determines which projects advance. Three distinct project archetypes carry differentiated risk-return profiles:
| Project Type | Key Advantage | Primary Risk | Typical Timeline to Production |
|---|---|---|---|
| DFS-stage developer (low capex) | Financing probability, near-term production | Execution risk | 3 to 5 years |
| Brownfield restart | Existing infrastructure, compressed capital requirement | Operational complexity | 2 to 4 years |
| High-grade explorer (proven belt) | M&A optionality, resource scale upside | Discovery risk | 7 to 15 years |
Capital-Efficient Developers: The Case for Oxide Heap-Leach Economics
Projects that have completed a definitive feasibility study with competitive capital intensity and strong return metrics occupy the strongest near-term financing position. Oxide heap-leach operations deserve particular attention as a project type, because they convert ore directly to copper cathode without smelting, reducing processing capital requirements and accelerating ramp-up profiles relative to conventional sulphide concentrators.
Marimaca Copper's August 2025 Definitive Feasibility Study for its Atacama region project in northern Chile demonstrates what commercially attractive heap-leach economics can look like: initial capital expenditure of US$587 million, a post-tax internal rate of return of 31%, a payback period of 2.5 years, and an all-in sustaining cost of US$1.97 per pound, all benchmarked at a base-case copper price of US$4.25 per pound. The company has also described what management characterises as a district-scale sulphide system with potential to support 100,000 tonnes of copper production per year for more than 20 years, the threshold that defines a tier-one asset under standard industry classification.
Brownfield Restarts: Why Sunk Capital Cannot Be Replicated
Former producing mines carry a structural advantage that is frequently underappreciated by investors focused primarily on resource grade. The capital invested by prior operators in concentrators, access roads, power connections, accommodation facilities, and tailings management systems cannot be replicated at current construction costs.
Selkirk Copper's restart of the Minto copper mine in Yukon, Canada illustrates this dynamic. Previous operators invested more than C$300 million in above-ground infrastructure at Minto. Selkirk holds 100% ownership of the mine and all associated infrastructure, and the company's May 2026 corporate presentation outlines a production schedule targeting first output in mid-2028. In an environment where a comparable greenfield operation would require close to US$900 million to build from scratch, the value proposition of sunk infrastructure capital becomes analytically clear.
Structural Insight: Brownfield copper assets with substantial prior capital investment represent a categorically different risk-adjusted development proposition compared to greenfield alternatives. The infrastructure cannot be reproduced at current cost levels, creating an embedded advantage that translates directly into compressed financing requirements and shorter paths to production.
High-Grade Explorers in Proven Metallogenic Belts
Volcanogenic massive sulphide (VMS) systems and large-scale porphyry copper deposits in established mining jurisdictions attract strategic acquisition interest from major producers for reasons that are partly geological and partly mathematical. VMS systems tend to exhibit high metal recovery characteristics and compact mining footprints, which compress operating costs. Their rarity at meaningful scale means that when a deposit of sufficient size and grade is defined, it enters a thin market for acquirable assets.
Abitibi Metals Corp's B26 VMS deposit in Quebec illustrates this dynamic. The January 2026 mineral resource estimate encompasses 1.467 billion pounds of copper equivalent across the combined measured, indicated, and inferred categories, totalling 25.3 million tonnes at an average grade of 2.6% copper equivalent. The strategic context matters: recent comparable transactions in the VMS space have demonstrated valuations approaching US$4 billion for assets with comparable scale and grade characteristics, as illustrated by Eldorado's acquisition of Foran Mining.
Chile's northern porphyry corridor, where Fitzroy Minerals is advancing exploration at its Buen Retiro iron oxide copper-gold (IOCG) target and its Caballos copper-molybdenum-gold-rhenium porphyry system, represents the other major archetype of early-stage exposure. Chile's geological endowment makes it among the most prospective jurisdictions globally for new porphyry discovery, and early-stage programmes in proven belts provide the only mechanism through which new supply can be created beyond what is already in development pipelines.
ESG and Permitting: The Hidden Supply Constraint That Price Cannot Resolve
Supply constraints in the copper market are no longer determined exclusively by geology, engineering, or metal prices. Non-technical risk factors now exert binding influence on project advancement, and they operate independently of whether the economics are commercially attractive.
ESG factors now embedded as financing prerequisites include:
- Environmental impact assessment approval timelines and scope
- Water use permitting in water-stressed jurisdictions, particularly northern Chile
- Tailings storage facility design and independent regulatory sign-off
- Carbon footprint disclosure and credible reduction pathway commitments
- Indigenous and community consultation requirements and outcomes
- Export credit agency and multilateral lender ESG compliance frameworks
Major lending institutions and institutional equity investors have progressively embedded ESG compliance criteria into their financing requirements. Projects lacking comprehensive environmental management plans, community benefit agreements, or credible carbon reduction pathways face capital access constraints entirely independent of their geological quality or modelled economic returns. In addition, the broader critical minerals demand dynamic is pushing regulators in key jurisdictions to both accelerate and tighten permitting frameworks simultaneously, creating a complex operating environment for developers.
The next major ASX story will hit our subscribers first
The Temporal Asymmetry at the Core of the AI Data Center Copper Demand Supply Gap
The central macroeconomic tension defining this market is a mismatch in timescales that no price signal can bridge on its own. Technology companies have collectively committed hundreds of billions of dollars to AI infrastructure, with the capacity to translate those commitments into operational data centres within 18 to 36 months. Copper mines require 10 to 20 years from discovery to first production. According to S&P Global's research on copper in the age of AI, this temporal asymmetry means demand inflections driven by technology investment cycles will consistently outpace supply responses from the mining sector.
The compounding factor is that AI infrastructure demand does not exist in isolation. It compounds against simultaneous copper demand growth from multiple sources:
- Electric vehicle adoption across motors, batteries, and charging infrastructure
- Grid modernisation and transmission expansion encompassing new lines, substations, and transformers
- Renewable energy buildout across wind, solar, and storage installations
- Industrial electrification spanning heat pumps, industrial motors, and process equipment
Power infrastructure supporting data centre operations alone, incorporating the associated renewables and transmission buildout required to service AI facilities, is projected to require approximately 1.0 million metric tonnes of copper per year by 2040.
Economic Framework: In commodity markets with highly inelastic supply curves, sustained demand growth above the supply response rate produces persistent price elevation rather than mean reversion. The copper market's structural characteristics, encompassing long lead times, high capital intensity, and geographic concentration, create precisely this condition.
Capital formation in the upstream mineral supply chains underpinning AI infrastructure has not scaled proportionally to downstream technology investment. This asymmetry between hyperscaler capital deployment and mining capital formation is not a temporary misalignment. It is a structural feature of the current commodity cycle rooted in the irreducible physical and regulatory timelines governing mine development.
The question the market is now pricing is not whether AI will require more copper. The evidence on that point is unambiguous. The operative question is whether the global mining industry can organise sufficient capital, permitting approvals, and operational execution to deliver new supply at a pace the next phase of digital infrastructure expansion requires. Based on current development pipelines and historical precedent, the answer through the early 2030s appears to be no.
Disclaimer: This article contains forward-looking statements, demand forecasts, and project-level financial estimates sourced from third-party research organisations and publicly disclosed company documents. These projections are inherently speculative and subject to material revision. Nothing in this article constitutes financial or investment advice. Readers should conduct independent due diligence before making any investment decisions.
Want to Track ASX Copper Discoveries as the AI Infrastructure Boom Intensifies?
Discovery Alert's proprietary Discovery IQ model delivers real-time alerts on significant ASX mineral discoveries — including copper — instantly translating complex geological data into actionable insights for traders and investors at every level. Explore how historic mineral discoveries have generated substantial returns and begin your 14-day free trial at Discovery Alert to position yourself ahead of the market.