July 28, 2026
Global Manufacturing Dynamics Drive Structural Aluminium Market Transformation
Industrial economies worldwide face a critical inflection point as traditional manufacturing paradigms converge with decarbonisation imperatives. This transformation creates unprecedented demand pressures across commodity markets, with the aluminium market forecast 2026 pointing toward sustained structural tightness. The convergence of electrification trends, infrastructure modernisation, and renewable energy transformations generates compounding effects that traditional supply chains struggle to accommodate.
Manufacturing sectors across developed economies demonstrate variable recovery patterns dependent on sector-specific dynamics. Advanced economies show divergent paths with automotive, construction, and packaging industries each following distinct demand trajectories. Furthermore, post-pandemic inventory normalisation continues affecting purchasing patterns through 2025-2026, while emerging markets exhibit stronger construction-driven consumption growth. The Infrastructure Investment and Jobs Act in the United States directs substantial capital toward aluminium-intensive projects, though specific consumption metrics vary significantly by project timeline and implementation phase.
According to institutional analysis from February 2026, demand growth has accelerated while new capacity creation has significantly lagged behind requirements. This creates structural imbalances extending beyond cyclical market fluctuations. Consequently, occasional supply interruptions reinforce deficit-driven market conditions, suggesting physical scarcity rather than speculative positioning drives current market dynamics.
Electric Vehicle Revolution Reshapes Material Requirements
The transportation industry transformation centres on lightweight material adoption as automakers pursue aggressive emissions reduction targets. Electric vehicle battery housings require specialised aluminium alloys that provide thermal management properties while maintaining structural integrity. In addition, commercial vehicle manufacturers increasingly specify aluminium components to offset battery weight penalties and extend operational range.
The International Aluminium Institute documents proportional increases in primary aluminium use within transportation applications, correlating directly with electrification adoption rates. Battery electric vehicle production requires approximately 180-200 kilograms of aluminium per vehicle compared to 140-160 kilograms in conventional internal combustion engines. This differential creates substantial incremental demand as global EV production scales toward emission reduction mandates.
Aerospace sector recovery patterns remain dependent on commercial aviation normalisation and next-generation aircraft program advancement. Boeing and Airbus production schedules incorporate advanced aluminium-lithium alloys for weight reduction while maintaining safety certifications. Meanwhile, marine industry adoption accelerates as vessel operators pursue fuel efficiency improvements through hull lightweighting and superstructure optimisation.
Renewable Energy Infrastructure Drives Aluminium Intensity
Solar panel manufacturing expansion creates sustained demand for aluminium frames and mounting systems. Each megawatt of solar capacity requires approximately 7-8 tonnes of aluminium across frames, tracking systems, and electrical components. Global solar deployment targets through 2030 suggest cumulative aluminium demand exceeding 2.5 million tonnes annually from this sector alone.
Wind turbine construction utilises aluminium conductors and structural components throughout power transmission systems. Offshore wind projects demonstrate particularly high aluminium intensity due to corrosion resistance requirements and weight optimisation for marine installation. Furthermore, grid infrastructure expansion necessitates aluminium conductor steel reinforced (ACSR) cables for efficient power transmission across extended distances.
Grid modernisation projects incorporate smart infrastructure requiring specialised aluminium alloys for electromagnetic shielding and thermal management. Additionally, energy storage system deployment creates additional demand through battery housing applications and thermal management components.
When big ASX news breaks, our subscribers know first
Chinese Production Constraints Create Global Supply Bottlenecks
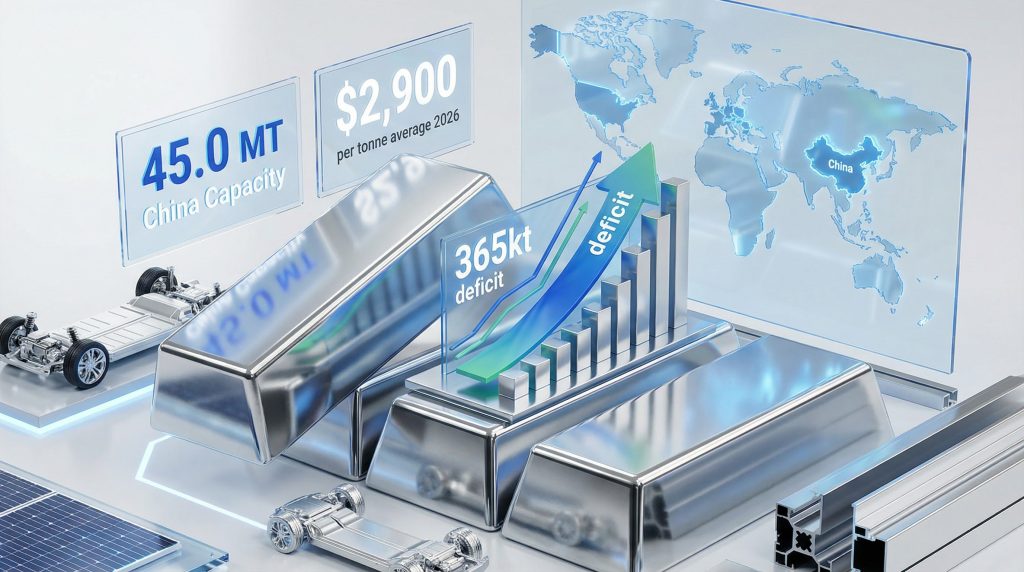
China maintains a strict 45 million tonne production capacity ceiling that fundamentally constrains global supply elasticity. This government-imposed limitation operates regardless of market pricing signals, creating structural supply inelasticity that traditional economic models struggle to accommodate. Current utilisation rates approach 85-90% within these capacity constraints, leaving minimal room for production increases during demand spikes.
Regional power availability challenges significantly impact smelter operations across major production provinces. Yunnan province faces hydroelectric power shortages during dry seasons, while Inner Mongolia experiences thermal power limitations due to coal supply constraints. Moreover, environmental compliance costs escalate as provincial governments enforce energy efficiency regulations and carbon intensity targets.
| Province | Capacity (MT) | Power Source | Utilisation Rate | Key Constraints |
|---|---|---|---|---|
| Yunnan | 8.2 | Hydroelectric | 75-80% | Seasonal water levels |
| Inner Mongolia | 7.8 | Thermal coal | 85-90% | Coal supply limits |
| Guangxi | 6.1 | Mixed sources | 80-85% | Power grid stability |
| Xinjiang | 4.9 | Thermal/renewable | 70-75% | Grid connection issues |
Export policy frameworks increasingly prioritise domestic consumption over international market supply. Chinese aluminium exports face potential restrictions as domestic automotive and construction sectors expand consumption. This policy shift reduces global supply availability regardless of international pricing premiums.
European Smelting Operations Face Structural Headwinds
European aluminium production operates at reduced capacity utilisation rates of 65-70% despite substantial installed capacity of 4.2 million tonnes. Energy costs represent the primary constraint as wholesale electricity prices remain elevated compared to global competitors. The European Union Emissions Trading System (EU ETS) adds approximately €150-200 per tonne in carbon costs to primary aluminium production.
Major European smelters have announced operational curtailments rather than permanent closures, maintaining capacity for potential restart when economic conditions improve. Norsk Hydro, Alcoa, and Rio Tinto have reduced output at multiple facilities across Norway, Germany, and Iceland. These decisions reflect economic optimisation rather than technical limitations.
However, Carbon Border Adjustment Mechanism (CBAM) implementation creates additional complexity for European producers competing against imports from regions with lower carbon pricing. This mechanism potentially provides cost protection but requires extensive documentation and verification processes that increase administrative burdens.
North American Production Expansion Faces Infrastructure Bottlenecks
North American aluminium capacity reaches 3.8 million tonnes with utilisation rates of 80-85%, indicating moderate operational headroom compared to other regions. However, production expansion encounters significant infrastructure and permitting delays that prevent rapid capacity additions. Environmental impact assessments typically require 18-24 months for major smelter projects, while electrical grid connections face additional delays.
The Inflation Reduction Act provides production tax credits for clean energy manufacturing, potentially supporting smelter economics through renewable energy integration. Quebec and British Columbia offer hydroelectric power advantages that attract smelter investment, though transmission capacity limits restrict expansion opportunities.
Recent aluminium smelter restart projects in the United States face skilled labour shortages and supply chain disruptions for specialised equipment. Century Aluminum's Kentucky smelter restart required 12-18 months longer than initially projected due to equipment procurement delays and workforce training requirements.
Middle Eastern Operations Approach Maximum Utilisation
Middle Eastern aluminium production demonstrates the highest global utilisation rates at 90-95% across 6.5 million tonnes of installed capacity. This region benefits from low-cost natural gas feedstock for power generation and favourable government policies supporting industrial development. Emirates Global Aluminium (EGA) and Qatar's Qatalum operate near maximum sustainable output levels.
Feedstock availability constraints increasingly limit further expansion despite favourable economics. Bauxite imports from Guinea, Australia, and Brazil face logistics bottlenecks and quality specifications that affect production efficiency. Consequently, alumina refinery capacity in the region requires expansion to support additional smelter development.
UAE and Saudi Arabia pursue downstream integration strategies to capture value-added processing margins. These initiatives compete with raw aluminium exports for production allocation, effectively reducing global primary supply availability.
Indonesian Capacity Ramp-Up Encounters Technical Challenges
Indonesia's 2.1 million tonnes of aluminium capacity operates at 75-80% utilisation as new facilities undergo technical ramp-up processes. Chinese-financed smelter projects require 12-18 months to achieve full operational efficiency following commissioning. These facilities utilise coal-fired power generation that creates cost advantages offset by technical complexity.
Operational challenges include electrode paste quality, pot lining durability, and skilled operator training programmes. Indonesian smelters typically achieve 85-90% current efficiency compared to 95%+ efficiency at mature facilities in other regions. This performance gap gradually narrows through operational optimisation and technology transfer programmes.
Export logistics from Indonesian smelters face port capacity constraints and shipping availability for international markets. Furthermore, domestic consumption growth within Indonesia's manufacturing sector competes with export opportunities, potentially reducing global supply contributions.
Market Pricing Dynamics Reflect Supply Scarcity Premium
London Metal Exchange aluminium pricing reached approximately USD 3,030 per tonne as of February 2026, following a 7% decline from recent highs while maintaining substantial elevation above historical averages. This pricing level represents approximately 20% premium above FY2025 averages, indicating sustained structural tightness rather than speculative positioning.
Institutional analysis suggests average aluminium prices of USD 2,900 per tonne for both FY2027 and FY2028, reflecting expectations that prices will remain comfortably above production cost levels. This forecast implies production costs approximate USD 2,400-2,550 per tonne range, providing substantial operating margins for efficient producers while challenging higher-cost operations.
Price Forecast Consensus: Industry analysts converge on a USD 2,900 per tonne average for 2026, representing a 15-20% premium above long-term production costs. This pricing reflects structural supply tightness rather than speculative positioning.
Production Cost Analysis Reveals Regional Disparities
Energy costs represent 40-50% of total aluminium production expenses, creating significant regional cost variations based on power source availability and pricing structures. Hydroelectric-powered smelters in Quebec, Norway, and Yunnan province maintain cost advantages over thermal power facilities. Similarly, natural gas-fired power in the Middle East provides intermediate cost positioning between renewable and coal-fired generation.
| Region | Energy Cost (USD/MWh) | Total Production Cost (USD/tonne) | Primary Constraint |
|---|---|---|---|
| Quebec Hydro | 45-55 | 2,200-2,400 | Transmission capacity |
| Middle East Gas | 35-45 | 2,100-2,300 | Feedstock logistics |
| European Grid | 85-125 | 2,800-3,200 | Carbon pricing |
| Chinese Coal | 55-75 | 2,300-2,600 | Capacity limits |
Raw material costs including alumina, carbon anodes, and cryolite fluctuate based on the global mining landscape dynamics and freight costs. Alumina pricing directly correlates with bauxite availability from major producing regions including Guinea, Australia, and Brazil. In addition, transportation costs for bulk materials significantly impact delivered pricing to smelter locations.
Carbon pricing mechanisms increasingly affect production cost calculations for smelters in regulated jurisdictions. European Union ETS carbon allowances add approximately €150-200 per tonne to production costs, while potential carbon border adjustments create additional complexity for trade flows.
Financial Market Factors Create Short-Term Price Volatility
Recent price moderation stems largely from global financial developments rather than fundamental demand-supply balance deterioration. US Federal Reserve expectations regarding interest rate reduction pace have strengthened the US dollar, creating headwinds for USD-denominated commodities including aluminium. Moreover, weakness across other metals including gold, silver, and copper contributed to broader commodity market pressure.
Commodity fund positioning and algorithmic trading systems amplify price movements during periods of macroeconomic uncertainty. However, these financial market influences operate against underlying physical supply constraints that provide fundamental price support. Therefore, long-term pricing trajectories depend more heavily on physical supply-demand balances than short-term financial market sentiment.
LME inventory dynamics and warehouse financing arrangements affect immediate pricing signals through storage incentives and financing costs. Contango market structures incentivise physical inventory accumulation, while backwardation encourages inventory drawdown. Current market conditions suggest tight physical availability despite periodic financial market volatility.
Chinese domestic aluminium pricing often diverges from LME quotations based on domestic supply-demand dynamics and currency fluctuations. Export arbitrage opportunities arise when domestic Chinese prices exceed LME equivalent levels, though export policy restrictions may limit actual trade flows regardless of economic incentives.
Transportation Sector Transformation Accelerates Material Intensity
Electric vehicle production scaling creates unprecedented aluminium demand growth across battery housings, structural components, and thermal management systems. Each battery electric vehicle requires approximately 180-200 kilograms of aluminium compared to 140-160 kilograms in conventional vehicles. Global EV production targets approaching 30 million units annually by 2030 suggest incremental aluminium demand exceeding 1.2 million tonnes annually from automotive electrification alone.
| Vehicle Type | Aluminium Content (kg) | Key Applications | Growth Rate (2026-2030) |
|---|---|---|---|
| Battery EV | 180-200 | Battery housing, body panels | 25-30% annually |
| Hybrid Vehicle | 160-180 | Engine block, transmission | 10-15% annually |
| Commercial EV | 400-600 | Chassis, cargo area | 35-40% annually |
| ICE Vehicle | 140-160 | Engine, wheels, trim | -5% annually |
Commercial vehicle electrification demonstrates even higher aluminium intensity due to larger battery systems and weight optimisation requirements. Electric buses utilise 800-1,200 kilograms of aluminium per vehicle while electric delivery trucks require 400-600 kilograms compared to conventional diesel alternatives. Fleet electrification mandates across urban areas accelerate this demand transition.
Aerospace sector recovery remains dependent on commercial aviation normalisation and production rate increases from Boeing and Airbus. Next-generation aircraft programmes incorporate advanced aluminium-lithium alloys that provide 10-15% weight reduction compared to conventional aluminium alloys. Furthermore, military aerospace programmes maintain steady demand for specialised high-strength alloys regardless of commercial aviation cycles.
Marine industry adoption accelerates through fuel efficiency regulations and environmental compliance requirements. Aluminium hull construction provides 30-40% weight reduction compared to steel alternatives while maintaining structural integrity and corrosion resistance. Additionally, offshore wind installation vessels increasingly specify aluminium construction for operational efficiency and maintenance advantages.
Construction Industry Drives Sustained Demand Growth
Green building standards increasingly specify aluminium facades, window systems, and structural components due to recyclability and thermal performance characteristics. LEED and BREEAM certification programmes award credits for aluminium content due to end-of-life recycling potential and embodied energy considerations. Curtain wall systems utilise 15-25 kilograms per square metre of building facade area.
Smart city infrastructure development requires specialised aluminium alloys for electromagnetic shielding in 5G networks and data transmission systems. LED lighting systems utilise aluminium heat sinks and housing components that require precise thermal management properties. Moreover, traffic management systems increasingly specify aluminium poles and enclosures for weight reduction and corrosion resistance.
Residential construction recovery patterns vary significantly between regions based on population growth, urbanisation trends, and government housing policies. Single-family housing typically consumes 200-300 kilograms of aluminium per unit across siding, windows, roofing, and HVAC systems. Multi-family construction demonstrates higher per-unit aluminium intensity through elevator systems, facades, and mechanical equipment.
Infrastructure modernisation projects incorporate aluminium bridge decking, guardrail systems, and sign structures that provide maintenance advantages over traditional steel alternatives. Highway expansion projects specify aluminium sound barriers that reduce installation complexity and long-term maintenance requirements.
Packaging Sector Evolution Creates New Demand Patterns
Beverage can demand continues expanding in emerging markets where per-capita consumption remains below developed market levels. Asia-Pacific markets demonstrate 8-12% annual growth rates in aluminium can consumption as urbanisation and disposable income increase. Each standard 355ml beverage can contains approximately 13-15 grams of aluminium.
Food packaging sustainability trends favour aluminium containers due to infinite recyclability and barrier properties that extend shelf life. Ready-to-eat meal packaging increasingly utilises aluminium trays that provide superior heat transfer characteristics for microwave and conventional oven applications. Furthermore, premium food brands specify aluminium packaging to convey quality perception and environmental responsibility.
Pharmaceutical packaging requirements drive demand for specialised aluminium alloys that meet FDA and European Medicines Agency specifications. Blister pack applications require precise thickness tolerances and barrier properties that protect sensitive medications from moisture and oxygen exposure. Cold chain logistics for vaccine distribution utilise aluminium containers for thermal stability and durability.
E-commerce packaging growth creates new applications for aluminium protective materials and thermal management systems. Electronics packaging utilises aluminium for electromagnetic interference shielding and heat dissipation. Additionally, battery packaging for consumer electronics and power tools requires specialised aluminium alloys for safety and performance requirements.
Supply-Demand Imbalance Scenarios Project Market Tightness
Baseline demand projections indicate 2.5% annual growth across all end-use sectors through 2026, driven primarily by transportation electrification and infrastructure development. Supply response remains constrained by capacity limitations, environmental regulations, and technical challenges that prevent rapid production increases. This fundamental imbalance creates sustained deficit conditions approaching 365,000 tonnes annually.
| Scenario | Demand Growth | Supply Response | Market Balance | Price Impact |
|---|---|---|---|---|
| Base Case | 2.5% | Limited | 365kt deficit | USD 2,900/t average |
| Bull Case | 3.5% | Delayed | 600kt deficit | USD 3,200/t average |
| Bear Case | 1.5% | Accelerated | 150kt deficit | USD 2,600/t average |
| Recession | 0.5% | Maintained | 50kt surplus | USD 2,400/t average |
Supply response timing depends heavily on environmental permitting processes, electrical grid capacity, and skilled labour availability. New smelter construction requires 3-5 years from initial planning through commercial operation, while smelter restart projects typically require 12-18 months for full production resumption. This time lag creates structural supply inelasticity during demand acceleration periods.
Market tightness indicators include treatment charges, regional premiums, and delivery timeline extensions that reflect physical scarcity conditions. Producer order books extend 8-12 weeks for standard products compared to 2-4 weeks during balanced market conditions. Furthermore, specialty alloy delivery timelines reach 16-20 weeks as producers prioritise higher-margin products.
Inventory Dynamics Reflect Structural Scarcity
London Metal Exchange inventory levels fluctuate based on financing incentives and physical supply availability. Total LME stocks including cancelled warrants typically range 1.0-1.5 million tonnes during balanced market conditions, compared to current levels reflecting tighter physical availability. Shanghai Futures Exchange inventories provide additional market signals for Asian supply-demand conditions.
Strategic government reserves in China, United States, and European Union affect apparent supply availability during market stress periods. These stockpiles serve national security objectives rather than commercial market balancing, though release decisions can influence short-term pricing dynamics. Reserve accumulation during market surplus periods reduces apparent demand while releases during deficit periods provide temporary supply relief.
Warehouse financing arrangements at LME-approved facilities create inventory holding incentives when financing spreads exceed storage costs. These financial engineering strategies can temporarily distort apparent supply availability though underlying physical consumption patterns remain unaffected. Financing market disruptions can rapidly release previously financed inventory into spot markets.
Scrap availability and secondary production capacity utilisation provide supply-side flexibility that partially offsets primary production constraints. Secondary aluminium production requires approximately 95% less energy than primary production while utilising recycled content from automotive, construction, and packaging sectors. Scrap collection rates vary significantly between regions based on recycling infrastructure and economic incentives.
Regional Market Dynamics Create Trading Opportunities
Asia-Pacific markets demonstrate the highest consumption growth rates driven by infrastructure development and manufacturing expansion. Chinese domestic consumption continues growing despite production capacity constraints, reducing export availability for international markets. However, commodity prices impact creates additional complexity for regional trade flows.
Southeast Asian manufacturing hub development increases regional aluminium intensity through electronics, automotive, and consumer goods production. Thailand, Vietnam, and Malaysia demonstrate particularly strong demand growth as supply chain diversification accelerates. Port capacity and logistics infrastructure improvements facilitate efficient raw material distribution throughout the region.
European Market Transformation Through Regulation
Carbon Border Adjustment Mechanism implementation creates competitive advantages for low-carbon aluminium production while penalising high-carbon imports. This regulation fundamentally alters global trade flows as European importers prioritise renewable energy-powered production sources. Compliance costs add administrative complexity but provide market differentiation opportunities for sustainable producers.
Green aluminium certification programmes develop premium pricing mechanisms that reward renewable energy utilisation and carbon footprint reduction. Major European automotive and construction companies establish procurement policies preferencing certified low-carbon aluminium. Premium levels range USD 200-400 per tonne above conventional pricing depending on carbon intensity and certification standards.
Circular economy regulations drive recycling infrastructure investment and extended producer responsibility programmes. These policies increase secondary aluminium availability while creating compliance costs for primary producers and downstream processors. Recycling targets approach 70-80% by 2030 across packaging, automotive, and construction applications.
Energy-intensive industry relocation trends affect regional supply-demand balances as producers seek cost-competitive locations. Smelter curtailments in high-cost regions combined with capacity additions in low-cost areas create structural supply chain adjustments. These relocations require 2-3 years for full implementation including workforce training and supply chain development.
North American Market Integration Through Trade Policies
USMCA trade agreement provisions affect regional supply chain optimisation and cross-border material flows. Rules of origin requirements incentivise regional production capacity development while tariff structures influence import substitution decisions. Canadian hydroelectric advantages create supply integration opportunities with US downstream processing facilities.
Infrastructure Investment and Jobs Act implementation creates sustained demand for aluminium-intensive applications including bridges, electrical grid upgrades, and public transportation systems. Project timelines extend 5-7 years from appropriation through completion, providing predictable demand visibility for capacity planning decisions. Buy American provisions prioritise domestic production sources where feasible.
Nearshoring trends in automotive and technology sectors increase North American aluminium consumption as manufacturers relocate production capacity from Asia-Pacific regions. These supply chain adjustments require 18-24 months for full implementation while creating sustained demand growth for regional producers. Labour cost considerations balance against supply chain security benefits in location decisions.
Strategic mineral security policies classify aluminium as critical material requiring domestic production capability maintenance. Government policies support smelter restart projects and capacity expansion through loan guarantees, tax credits, and regulatory streamlining. National defence considerations influence trade policy decisions and stockpile management strategies.
The next major ASX story will hit our subscribers first
Investment Strategies Align with Structural Market Changes
Primary aluminium producer valuations reflect earnings sensitivity to price movements and production cost optimisation. Integrated producers with low-cost power sources demonstrate superior margin stability compared to higher-cost operators. Hydroelectric-powered facilities command premium valuations due to renewable energy advantages and lower operating cost profiles.
| Producer Category | Cost Position | Margin Volatility | Investment Appeal |
|---|---|---|---|
| Hydro-powered | USD 2,100-2,400/t | Low | High – stable margins |
| Gas-fired | USD 2,200-2,600/t | Medium | Medium – moderate risk |
| Coal-fired | USD 2,300-2,700/t | Medium-High | Lower – carbon risk |
| Grid-powered | USD 2,600-3,200/t | High | Lowest – cost volatility |
Downstream processing companies benefit from expanding fabrication margins as demand growth outpaces capacity additions. Automotive suppliers, aerospace fabricators, and packaging manufacturers demonstrate earnings leverage to aluminium market tightness. Value-added processing creates competitive barriers and customer relationship advantages that justify premium valuations.
Technology companies developing advanced aluminium alloys, recycling processes, and production efficiency improvements represent growth opportunities within the sector. Carbon reduction technologies including inert anode development and renewable energy integration create competitive advantages and regulatory compliance benefits.
Commodity Investment Considerations
Physical aluminium storage requires specialised warehouse facilities with LME approval for financing and trading applications. Storage costs range USD 45-65 per tonne annually including insurance and handling charges. Financing spreads must exceed storage costs to justify inventory holding strategies during market contango periods.
Futures market contango and backwardation patterns create trading opportunities based on supply tightness expectations and storage economics. Calendar spread trading requires careful analysis of seasonal demand patterns, inventory cycles, and production scheduling factors. Roll yield impacts significantly affect long-term commodity fund performance.
Currency hedging becomes critical for international aluminium exposure as USD strength affects commodity pricing dynamics. European and emerging market investors face additional currency risk that requires active management strategies. Regional price differentials create basis risk that cannot be hedged through standard futures contracts.
ESG-compliant investment options increasingly focus on low-carbon aluminium production and circular economy principles. Green aluminium ETFs and sustainability-focused funds screen for renewable energy utilisation and carbon footprint metrics. Impact investing strategies align with decarbonisation mining benefits while targeting financial returns.
Investment Risk Assessment: Key downside risks include Chinese policy reversals, global recession scenarios, and accelerated recycling technology deployment. Upside catalysts centre on supply disruptions and faster-than-expected green transition adoption.
Sustainability Trends Reshape Industry Structure
Low-carbon aluminium premium development creates new market segments based on production method carbon intensity. Renewable energy-powered smelters command premiums ranging USD 200-400 per tonne above conventional production, depending on certification standards and customer requirements. Major automotive and construction companies establish procurement policies preferencing certified sustainable aluminium.
Carbon footprint certification systems including ASI Performance Standard and Aluminium Stewardship Initiative create transparency mechanisms for supply chain carbon accounting. Third-party verification processes add compliance costs but enable premium pricing opportunities. Blockchain-based tracking systems provide supply chain transparency from mining through fabrication stages.
Corporate sustainability commitments drive procurement policy changes as companies pursue scope 3 emissions reduction targets. Apple, BMW, and Amazon establish supplier requirements for renewable energy utilisation in aluminium production. These commitments create sustained demand for certified low-carbon material regardless of pricing premiums.
Circular Economy Integration Advances
Secondary aluminium production capacity investments accelerate as recycling economics improve and regulatory requirements increase. Recycling facilities require 90-95% less energy than primary smelters while processing post-consumer and post-industrial scrap. Capital requirements remain substantially lower than primary production facilities.
Scrap collection infrastructure development improves material recovery rates across automotive, construction, and packaging sectors. Automated sorting technologies increase processing efficiency and material quality while reducing contamination rates. Regional collection networks optimise logistics costs and material quality preservation.
Product design changes enable higher recycling rates through material separation improvements and alloy standardisation. Automotive manufacturers design components for end-of-life disassembly while construction companies specify compatible alloy systems. Packaging design optimisation reduces material usage while maintaining performance characteristics.
Extended producer responsibility programmes require manufacturers to finance collection and recycling infrastructure. These policies internalise end-of-life costs while creating incentives for design optimisation and material efficiency improvements. Implementation timelines vary by region but generally phase in over 3-5 year periods.
Technology Innovation Drives Competitive Advantages
Smelting efficiency improvements through inert anode technology potentially reduce carbon emissions by 75-80% compared to conventional carbon anode systems. Development timelines suggest commercial deployment within 5-7 years though scaling challenges remain significant. Energy consumption reductions improve operating margins while meeting environmental compliance requirements.
Alternative production methods including mechanical vapour recompression and hydrogen-based reduction processes offer carbon emission reductions but face commercialisation challenges. Research and development investments focus on energy efficiency improvements and renewable energy integration capabilities.
Digital supply chain tracking systems improve transparency and efficiency throughout production and distribution networks. IoT sensors monitor smelter performance parameters while blockchain systems track material provenance for certification purposes. Predictive maintenance systems reduce operational disruptions and equipment failure rates.
Advanced alloy development creates performance improvements for specific applications including aerospace, automotive, and electronics sectors. Additive manufacturing capabilities enable customised alloy compositions and complex geometries previously impossible through conventional processing methods.
Risk Assessment Framework Identifies Market Vulnerabilities
Geopolitical risks significantly affect global aluminium trade flows as resource nationalism trends increase in bauxite-producing countries. Guinea, Australia, and Brazil control approximately 75% of global bauxite reserves, creating supply chain concentration risks. Political instability or policy changes in these regions can disrupt raw material availability and pricing.
Trade policy modifications including tariff adjustments and export restrictions create market volatility and supply chain disruptions. US-China trade tensions periodically affect aluminium trade flows while European carbon border adjustments alter competitive dynamics. Regional trade agreement modifications require supply chain strategy adjustments.
| Risk Factor | Probability | Market Impact | Mitigation Strategy |
|---|---|---|---|
| Supply Disruptions | High | Price volatility +/- 15% | Diversified sourcing |
| Chinese Policy Changes | Medium | Volume uncertainty +/- 20% | Regional capacity |
| Technology Disruption | Low | Cost structure shift | R&D investment |
| Regulatory Changes | Medium-High | Compliance costs +5-10% | Proactive adaptation |
Macroeconomic Sensitivity Analysis
Interest rate environments significantly impact capital-intensive aluminium projects through financing costs and investment return requirements. Rising rates delay capacity expansion projects while creating inventory financing headwinds. Commodity fund positioning responds to real interest rate changes and inflation expectations.
Currency fluctuation effects create regional competitiveness shifts as production costs vary with exchange rate movements. USD strength typically pressures commodity prices while benefiting US-based consumers. Emerging market currency weakness can reduce regional purchasing power for imported aluminium.
Inflation pressures affect production costs through energy, labour, and raw material price increases. Smelter operators face margin pressure when cost inflation exceeds realised price increases. Long-term supply contracts may not adequately adjust for sustained inflationary periods.
Global growth scenarios correlate strongly with industrial production and aluminium consumption patterns. Recession risks create demand destruction while recovery periods generate supply shortages due to capacity utilisation constraints. Leading economic indicators provide early warning signals for demand trajectory changes.
The aluminium market forecast 2026 indicates structural supply deficits will persist despite short-term price volatility driven by financial market conditions. Production capacity constraints, energy costs, and environmental regulations limit supply response while transportation electrification and infrastructure development sustain demand growth. Furthermore, industry evolution trends alongside regional market dynamics create trading opportunities while sustainability trends reshape competitive positioning for long-term market participants. Consequently, sustained periods of market tightness appear likely as fundamentally constrained supply meets accelerating demand from emerging applications, according to the aluminium market forecast 2026.
Ready to Capitalise on the Next Aluminium Market Discovery?
With structural supply deficits and soaring demand from electrification trends creating exceptional market conditions, Discovery Alert's proprietary Discovery IQ model identifies significant ASX mineral discoveries in real-time, helping investors capitalise on emerging opportunities before the broader market reacts. Explore why major mineral discoveries generate substantial returns by examining historic examples like De Grey Mining and WA1 Resources, then begin your 14-day free trial today to position yourself ahead of this transformative aluminium market cycle.