August 21, 2026
When the Forward Curve Tells a Different Story Than the Spot Price
Base metal markets have a habit of revealing their true character not in the headline price, but in the architecture of the forward curve. When spot prices and forward contracts move at different velocities on the same trading day, seasoned market participants pay attention. That divergence is not noise. It is signal. On August 20, 2026, the LME aluminium cash price falls to 3180 per tonne marked exactly that kind of session, with the cash price and three-month contracts declining at sharply different rates, inventory sitting unmoved, and alumina moving in the opposite direction entirely.
Each of these data points, taken individually, tells a partial story. Assembled together, however, they sketch a more complex picture of where the aluminium market stands heading into the final stretch of 2026. Furthermore, the aluminum-alumina market impact of recent structural shifts adds important context to reading these signals correctly.
When big ASX news breaks, our subscribers know first
Understanding the LME Price Structure Before Reading the Numbers
The London Metal Exchange operates as the world's primary pricing reference for aluminium, with the cash price functioning as the benchmark for immediate physical delivery transactions. Most long-term supply agreements between smelters, traders, and downstream manufacturers are structured around LME cash prices, often with a regional premium layered on top to account for freight, currency, and local supply-demand conditions.
The distinction between contract tenors matters considerably in practice:
- The cash bid reflects what a buyer is willing to pay for immediate delivery
- The cash offer reflects what a seller requires to transact at spot
- The 3-month bid and offer represent the standard forward contract used for hedging and speculation
- Date-specific contracts such as December 2027 provide longer-horizon price discovery for producers and end-users planning capital expenditure
The spread between these tenors, and the direction each moves on a given day, reveals critical information about inventory conditions, demand sentiment, and speculative positioning that the cash price alone cannot communicate.
August 20, 2026: Full Price Performance Across Contract Tenors
Breaking Down the Day's Moves
| Contract Tenor | August 19 Price (USD/t) | August 20 Price (USD/t) | Change (USD/t) | % Change |
|---|---|---|---|---|
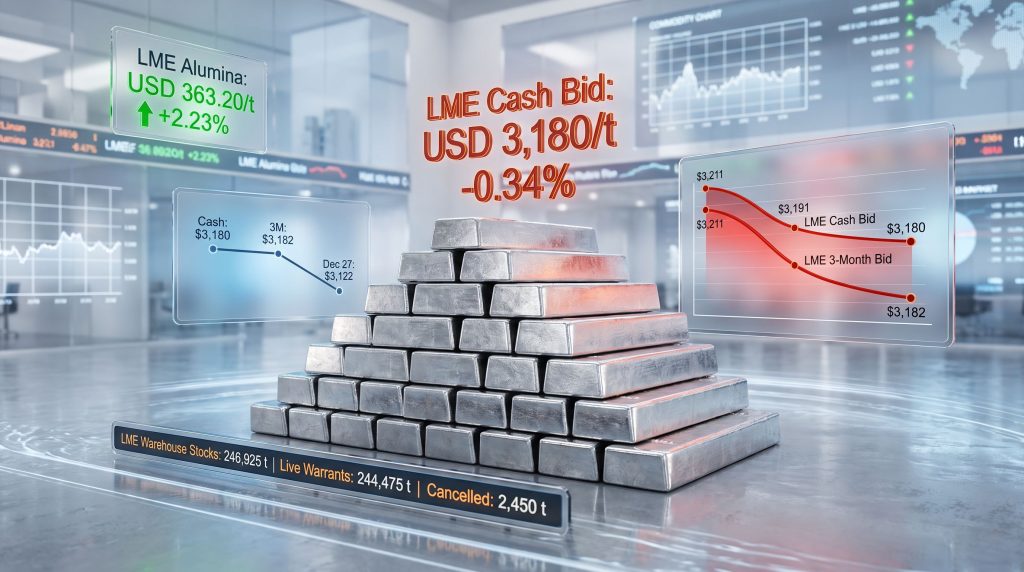
| Cash Bid | 3,191.00 | 3,180.00 | -11.00 | -0.34% |
| Cash Offer | 3,191.50 | 3,182.00 | -9.50 | -0.30% |
| 3-Month Bid | 3,211.00 | 3,182.00 | -29.00 | -0.90% |
| 3-Month Offer | 3,212.00 | 3,183.00 | -29.00 | -0.90% |
| Dec 27 Bid | 3,145.00 | 3,122.00 | -23.00 | -0.73% |
| Dec 27 Offer | 3,150.00 | 3,127.00 | -23.00 | -0.73% |
| Asian Reference (3M) | N/A | 3,205.00 | N/A | N/A |
The day's most notable feature was not the cash price decline itself, but the velocity differential between contract tenors. The LME aluminium cash price falls to 3180 per tonne represented a relatively contained move of 0.34%. Yet the 3-month bid fell by 0.90%, a rate 2.6 times larger. This kind of front-end resilience against a steeper back-end decline is a pattern worth examining closely. You can track live aluminium pricing data to monitor how these spreads evolve across sessions.
What the Narrow Cash-to-3-Month Spread Reveals
On August 20, the 3-month bid settled at USD 3,182 per tonne, just USD 2 per tonne above the cash bid of USD 3,180 per tonne. In a normally functioning contango market, the 3-month price would sit materially above the cash price to reflect the cost of carrying physical metal through time, including financing, insurance, and storage. A spread of only USD 2 per tonne is extraordinarily compressed.
When the contango narrows this dramatically, it can reflect either genuine tightness in near-term physical supply, a shift in speculative positioning away from deferred contracts, or both simultaneously. On August 20, with inventory unchanged and no obvious supply shock, the more likely interpretation is that forward demand expectations softened faster than spot conditions warranted.
The December 2027 contract pricing at USD 3,122 to USD 3,127 per tonne positions the long end of the curve below current spot levels, a mild backwardation signal over a multi-year horizon that suggests the market anticipates either additional supply or moderated demand normalising prices through 2027.
LME Warehouse Stocks: What Stability at 246,925 Tonnes Actually Means
Inventory Breakdown on August 20
| Inventory Metric | Quantity (Tonnes) |
|---|---|
| Total LME Opening Stocks | 246,925 |
| Live Warrants | 244,475 |
| Cancelled Warrants | 2,450 |
Both August 19 and August 20 recorded identical opening stock levels of 246,925 tonnes, with zero net change in either inflows or outflows. Of that total, 244,475 tonnes remained as live warrants, available for immediate delivery, while 2,450 tonnes carried cancelled warrant status, indicating metal flagged for physical withdrawal.
Cancelled warrants representing less than 1% of total LME holdings, specifically approximately 0.99% in this session, signal minimal near-term physical drawdown pressure. A low cancellation rate on a day when prices are declining often points to demand softness rather than supply abundance as the primary price driver.
To contextualise the current level, LME aluminium warehouse stocks peaked above 5 million tonnes in 2014, a period that coincided with extraordinary financing deals where aluminium was held off market as collateral. The current sub-250,000 tonne environment is structurally far tighter by historical comparison, yet that relative tightness has not translated into price support on days like August 20. This suggests macro and sentiment forces are overriding fundamental stock signals in the near term.
Why Prices Can Fall Even When Stocks Are Flat
This is one of the most commonly misunderstood dynamics in commodity markets. Physical inventory levels at LME warehouses represent only a fraction of total global aluminium stocks, which include producer inventories, trader positions, and consumer stockpiles sitting outside the exchange system. When demand sentiment deteriorates, prices can fall independently of LME warehouse levels because market participants adjust their willingness to pay forward, not just for LME-registered metal.
Algorithmic trading strategies also play a growing role in amplifying intraday moves. Momentum-following algorithms triggered by macro signals, currency moves, or cross-commodity price shifts can accelerate price declines well beyond what physical supply-demand fundamentals alone would justify on a single trading session. The commodity price impact on mining company performance illustrates how these dynamics ripple downstream.
The Alumina Divergence: A Margin Compression Warning Signal
Alumina Rises 2.23% While Aluminium Falls
Perhaps the most significant market signal from August 20 was not the aluminium price decline itself, but the simultaneous and opposite move in alumina. The LME Alumina Platts price rose from USD 355.26 per tonne on August 19 to USD 363.20 per tonne on August 20, a gain of USD 7.94 per tonne, representing a 2.23% single-session increase.
For context, alumina is the intermediate product derived from bauxite refining, and it is the primary feedstock consumed by aluminium smelters. Producing approximately one tonne of aluminium requires roughly two tonnes of alumina, making the alumina-to-aluminium price ratio a critical measure of smelter profitability. The recent Alcoa market downgrade provides a useful lens for understanding how these cost pressures affect major producers.
When alumina prices rise while aluminium prices fall, smelter operating margins compress from both ends simultaneously. If this divergence persists over multiple sessions, it can push higher-cost producers toward output curtailments, which paradoxically sets the stage for eventual aluminium price recovery by tightening supply.
At USD 363.20 per tonne for alumina and USD 3,180 per tonne for aluminium, alumina now represents approximately 11.4% of the aluminium price, a ratio that sits toward the higher end of historical norms. Historically, when this ratio sustains above 12%, curtailment pressure among cost-quartile three and four smelters tends to build materially.
The Bauxite-Alumina-Aluminium Chain and Price Lag Dynamics
Price transmission through the aluminium supply chain does not occur instantaneously. Bauxite pricing feeds into alumina refinery economics, but with a lag reflecting contract structures and refinery throughput cycles. Similarly, alumina cost increases take time to flow through smelter operating economics, particularly where producers have fixed-price alumina supply agreements that insulate them for one to two quarters.
This lag effect means that alumina price spikes, such as the one recorded on August 20, do not immediately translate into aluminium price support. However, they are a leading indicator for potential supply discipline further down the timeline. Sophisticated market participants monitor this ratio closely when building forward price views, and among the top aluminium producers, this dynamic is particularly well understood.
Why the 3-Month Contract Fell Harder: Decoding Speculative Positioning
The 0.90% Forward Decline vs the 0.34% Cash Decline
The fact that the 3-month bid fell by USD 29 per tonne while the cash bid fell by only USD 11 per tonne reflects something important about where market participants are expressing their views. Speculative funds, macro traders, and algorithmic strategies predominantly operate in the 3-month contract because it offers the liquidity depth needed to build and unwind large positions efficiently.
When forward contracts decline disproportionately relative to spot prices, it typically reflects one or more of the following dynamics:
- Speculative long liquidation in the 3-month tenor as traders reduce exposure to forward price risk
- Deteriorating demand outlook being priced into deferred contracts before it appears in physical spot transactions
- Macro risk-off positioning where participants rotate out of commodity exposure across the forward curve
The December 2027 contracts declined by 0.73%, which sits between the cash move and the 3-month move, consistent with a sell-off that was most concentrated in the near-term forward but radiated through the curve without becoming progressively steeper at the long end.
The next major ASX story will hit our subscribers first
Macro Forces and Cross-Commodity Context
Reading Aluminium Moves Within the Broader Base Metals Complex
Single-commodity price moves on any given session rarely occur in isolation. The aluminium market's performance on August 20 needs to be evaluated against the backdrop of broader base metal sentiment, which is heavily influenced by:
- Chinese manufacturing activity, given that China accounts for more than 55% of global primary aluminium consumption and an even larger share of production. In addition, China industrial demand trends have broader implications for the entire base metals complex
- US dollar strength, which creates inverse pressure on dollar-denominated commodity prices as a mechanistic relationship
- Global construction sector momentum, particularly residential and infrastructure building in China, Southeast Asia, and the Middle East, all major aluminium consuming regions
- Energy price dynamics in smelting regions, since aluminium smelting is extraordinarily energy-intensive, consuming roughly 14 to 16 megawatt-hours of electricity per tonne of aluminium produced, making power costs the dominant variable in production economics for most smelters globally
When energy costs in key smelting regions fall, higher-cost producers that had curtailed output may restart, adding supply that weighs on forward prices. When energy costs rise, the reverse occurs. The August 20 session's price configuration is consistent with markets where supply-side risks are not currently seen as acute, but forward demand uncertainty is building.
Practical Implications for Market Participants
How Different Stakeholders Should Read the August 20 Data
For downstream manufacturers and fabricators:
- A cash price at USD 3,180 per tonne, combined with the compressed contango structure, suggests the market is not pricing in near-term supply scarcity
- Buyers with flexibility in their procurement timing may find value in locking in current physical prices before any supply-side response to rising alumina costs materialises
- The narrow cash-to-forward spread limits the urgency of forward hedging but does not eliminate it for buyers with significant volume commitments
For primary aluminium producers:
- Producers with all-in cash costs in the USD 2,200 to USD 2,800 per tonne range retain comfortable margins at current prices, but rising alumina costs are eroding that buffer
- Cost-quartile three and four producers, particularly those without integrated bauxite and alumina supply, face the most immediate margin pressure from the August 20 divergence
- Curtailment decisions at smaller, higher-cost smelters may emerge within one to two quarters if the alumina-aluminium price divergence persists
For traders and arbitrageurs:
- The USD 25 per tonne premium of the Asian Reference Price (USD 3,205 per tonne) over the LME cash bid (USD 3,180 per tonne) creates a potential arbitrage window between LME and regional physical markets, though freight and financing costs must be factored in carefully
- The unusually narrow contango of just USD 2 per tonne between cash and 3-month pricing limits the attractiveness of traditional carry trades, where profitability depends on a sufficient forward premium to cover holding costs
Key Session Metrics at a Glance
| Metric | Value |
|---|---|
| LME Cash Bid (Aug 20) | USD 3,180/t |
| Day-on-Day Cash Decline | USD 11/t (-0.34%) |
| 3-Month Bid Decline | USD 29/t (-0.90%) |
| Cash-to-3-Month Spread | USD 2/t |
| LME Warehouse Stocks | 246,925 tonnes |
| Live Warrants | 244,475 tonnes |
| Cancelled Warrants | 2,450 (0.99% of total) |
| LME Alumina Platts Price | USD 363.20/t (+2.23%) |
| Asian Reference Price (3M) | USD 3,205/t |
| Dec 27 Bid | USD 3,122/t (-0.73%) |
Three Forward Indicators Worth Monitoring Closely
The August 20 session leaves several open questions that the coming sessions will need to resolve. Market participants focused on positioning themselves appropriately should watch the following indicators, as noted by the LME's official aluminium data resources:
-
Warrant cancellation trends: Any acceleration in cancelled warrants from the current 2,450-tonne level would signal rising physical demand and could provide a technical floor under cash prices. Conversely, a continued low cancellation rate alongside flat inventory reinforces the demand-softness narrative.
-
Alumina-aluminium margin compression: If the Alumina Platts price continues rising while the LME aluminium cash price remains under pressure, expect curtailment announcements to emerge from higher-cost smelters, potentially in markets where energy costs and alumina import dependence combine to produce the weakest operating economics.
-
Forward curve slope evolution: A widening of the cash-to-3-month spread back toward more typical contango levels of USD 15 to USD 25 per tonne would indicate recovering forward demand expectations and could precede a more sustained cash price recovery. Continued compression or a move into backwardation would carry a more bearish demand signal.
Readers seeking ongoing LME aluminium price data, warehouse stock updates, and broader primary aluminium market coverage can access detailed tracking and industry analysis through AL Circle, which maintains comprehensive historical price records and market intelligence resources for the global aluminium industry.
This article contains forward-looking analysis and market interpretations that involve inherent uncertainty. Price movements, margin dynamics, and supply-side responses discussed here are based on publicly available market data and analytical frameworks, and should not be construed as financial or investment advice. Readers are encouraged to conduct independent research and consult qualified financial professionals before making any trading or investment decisions.
Want to Track the ASX Stocks Positioned to Benefit From Commodity Shifts Like This?
When alumina and aluminium diverge this sharply, margin pressure builds across the supply chain — and that pressure creates real opportunities in ASX-listed mining and exploration stocks. Discovery Alert's proprietary Discovery IQ model scans ASX announcements in real time, instantly identifying significant mineral discoveries across more than 30 commodities and turning complex market data into actionable insights — start your 14-day free trial today, or explore historic discovery returns to understand just how transformative the right alert at the right moment can be.