August 21, 2026
The Strait of Hormuz: Understanding the World's Most Critical Energy Chokepoint
Global energy markets have always been shaped by geography as much as geology. The location of hydrocarbon reserves matters far less than the infrastructure required to move those resources from production zones to consumption centres. Nowhere is this principle more starkly illustrated than in the narrow waterway connecting the Persian Gulf to the Gulf of Oman — a passage so strategically concentrated that its disruption sends shockwaves through refinery schedules, insurance markets, and sovereign energy security strategies simultaneously.
The number of ships passing through the Strait of Hormuz has become one of the most closely watched metrics in global commodity markets, and recent data has made for deeply uncomfortable reading. Furthermore, the implications extend well beyond shipping, touching crude oil price volatility and the broader LNG supply outlook for importing nations worldwide.
When big ASX news breaks, our subscribers know first
What the Strait of Hormuz Actually Moves
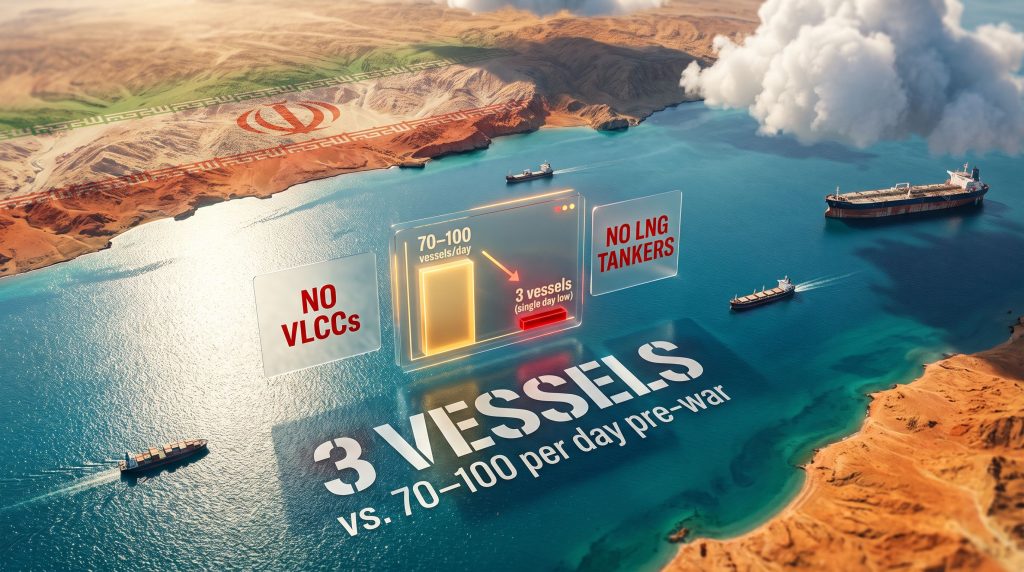
Before examining the current disruption, it is worth appreciating the sheer volume of energy that this corridor normally handles. Under stable operating conditions, the strait facilitates the transit of approximately 70 to 100 commercial vessels every single day, collectively representing close to one-fifth of the world's combined crude oil and liquefied natural gas supply.
No other maritime chokepoint on the planet concentrates this level of energy cargo in a corridor this narrow. The Strait of Malacca handles comparable vessel volumes but carries a far more diversified cargo mix. The Suez Canal moves significant energy volumes but operates within an internationally administered framework with established contingency protocols. The Bab el-Mandeb strait, which connects the Red Sea to the Gulf of Aden, carries meaningful crude flows but at lower concentrations.
| Chokepoint | Estimated Daily Vessel Traffic (Normal) | Key Commodities | Primary Risk Factor |
|---|---|---|---|
| Strait of Hormuz | 70–100 vessels/day | Crude oil, LNG, LPG | Geopolitical conflict, Iran tensions |
| Bab el-Mandeb | 40–60 vessels/day | Crude oil, refined products | Houthi maritime attacks |
| Strait of Malacca | 80–100 vessels/day | Crude oil, manufactured goods | Piracy, congestion |
| Suez Canal | 50–70 vessels/day | Mixed cargo, energy | Political instability, blockage risk |
The Hormuz corridor is unique in that it has no viable pipeline alternative capable of absorbing anything close to its full throughput. The East-West pipeline across Saudi Arabia and the Abu Dhabi Crude Oil Pipeline provide partial bypass capacity, but their combined rated capacity falls well short of what the strait normally handles on a daily basis. This absence of substitutes is what makes disruptions here categorically different from disruptions elsewhere, as detailed extensively in analysis of oil market disruptions affecting global supply chains.
How Far Traffic Has Fallen: The Data in Detail
Vessel tracking data compiled by Kpler, a widely used ship-tracking platform, has documented a sustained and severe contraction in the number of ships passing through the Strait of Hormuz since conflict escalated in the region beginning in February 2026.
On a recent Thursday, just seven commodity vessels transited the entire waterway. Of those, four entered and three exited. This figure represents approximately 7% of the pre-war daily average — a contraction with few modern equivalents at any major energy chokepoint. According to Britannica, the strait typically handles an enormous proportion of global seaborne oil trade under normal conditions, making the current collapse all the more striking.
That seven-vessel day was itself double the tally recorded on some of the most disrupted individual days, when as few as three commodity ships crossed the strait in a 24-hour period. A partial recovery window in early August saw 33 vessels transit across four consecutive days (Monday through Thursday), averaging fewer than nine per day. Kpler recorded 21 vessel entries during that same window, with the majority utilising the Iranian coastal routing option.
Critical context: All figures produced by transponder-reliant tracking platforms represent minimum counts only. Vessels operating with their Automatic Identification System (AIS) disabled are structurally invisible to these systems. The actual number of ships passing through the Strait of Hormuz on any given day is higher than published data indicates, though by exactly how much remains unquantifiable.
Why the Absence of VLCCs and LNG Tankers Is the Real Story
The headline vessel count matters, but energy market analysts pay closer attention to the vessel type composition of daily transits. On the seven-vessel day referenced above, not a single Very Large Crude Carrier (VLCC) or LNG tanker was among the ships recorded.
One notable exception during that period was a very large gas carrier transporting propane and butane that exited via the Iranian coastal route. This vessel type, while significant, carries a fundamentally different commercial profile to VLCCs and LNG tankers.
The strategic weight of this distinction cannot be overstated:
- VLCCs typically carry two million barrels of crude oil per voyage, making each vessel's absence from the corridor equivalent to losing a significant portion of a day's global production increment
- LNG tankers represent long-term contracted supply commitments, meaning their diversion creates downstream delivery obligations that cascade through import terminal schedules weeks later
- War-risk insurance surcharges for these vessel classes have escalated to levels that render standard voyage economics unworkable for many operators
- Cargo owners are absorbing significant rerouting costs and extended voyage times rather than expose these assets to the current risk environment
The Four Routing Strategies Now in Use
A lesser-known dimension of the current disruption is that the Strait of Hormuz is not a single lane. It encompasses multiple navigable corridors, and the crisis has forced operators to make routing decisions that were previously of only academic interest. Four distinct strategies have emerged:
- The pre-war central route — The historically standard path through the strait's centre, now largely abandoned by major tanker operators due to security exposure
- Oman's northern territorial waters route — A deviation hugging the Omani coastline that reduces exposure to Iranian-controlled maritime zones; preferred by Western-flagged vessels
- The Iran-asserted southern route — Used primarily by vessels with Iranian commercial affiliations or operating under sanctioned ownership structures; accounts for the majority of recent Kpler-tracked transits
- Dark transits with AIS disabled — Vessels running with transponders switched off, rendering them completely invisible to commercial tracking infrastructure; volume unknown but commercially significant
The dark transit category is particularly important for understanding why published vessel counts should be treated as floors rather than totals. Sanctioned tanker fleets, Iranian state-affiliated operators, and vessels serving buyers willing to absorb political risk have strong incentives to operate without transponders. The gap between tracked and actual traffic is real, material, and growing.
Real-time monitoring tools such as Hormuz Strait Monitor provide the closest available approximation of live traffic conditions, though even these platforms acknowledge the fundamental limitations imposed by dark transit volumes.
Bab el-Mandeb: A Second Chokepoint Fracturing Simultaneously
The geopolitical stress on global energy logistics is not confined to the Persian Gulf. Concurrent disruption at the Bab el-Mandeb strait has created a compounding chokepoint crisis that analysts have struggled to find historical precedent for. In addition, these simultaneous pressures are reshaping the broader geopolitical mining landscape and commodity supply chains well beyond the energy sector.
On the same Thursday that recorded seven commodity ships at Hormuz, Bab el-Mandeb traffic slowed to 23 commodity vessels, compared with 34 on each of the two preceding days. Of those 23, sixteen entered the strait and seven exited.
Among the seven exits, two Suezmax tankers drew particular attention. The Stoic Warrior was carrying crude oil bound for Vietnam, while the Dokos was transporting crude destined for India. No VLCCs or LNG tankers were recorded at Bab el-Mandeb on that day either.
| Importing Region | Primary Exposure | Alternative Supply Options | Key Risk |
|---|---|---|---|
| India | Both Hormuz and Bab el-Mandeb crude routes | US crude, West African barrels | Higher freight premiums, longer voyage times |
| China | Hormuz LNG and crude | Pipeline alternatives, spot LNG diversification | Supply timing disruption |
| Japan and South Korea | Hormuz LNG dependency | Australian LNG, US LNG via Pacific | Spot price exposure |
| Europe | Bab el-Mandeb refined products | North Sea, US Gulf Coast alternatives | Marginal cost increases |
India's exposure is particularly compounded. As a major importer through both chokepoints, it faces freight cost escalation and supply timing risk simultaneously. The Dokos cargo is a visible data point in a much larger pattern of cargo diversion affecting Indian refineries.
The next major ASX story will hit our subscribers first
How US-Iran Diplomatic Uncertainty Drives Shipping Decisions
One of the most underappreciated dynamics in the current crisis is the mechanism by which diplomatic uncertainty, rather than active military incidents, suppresses commercial shipping confidence. When US-Iran peace negotiations are perceived to be progressing, vessel operators and their war-risk underwriters revise their assessments upward, and transit volumes tend to recover incrementally. When talks stall, the inverse occurs with immediacy.
The current environment, characterised by negotiations that remain unresolved, has produced what is arguably the most damaging condition for shipping confidence: sustained ambiguity. Operators cannot build voyage economics around an unresolvable threat environment, and the result is structural withdrawal that persists even on days when no active incident is recorded. These dynamics mirror the safe-haven market dynamics observed across other asset classes during periods of prolonged geopolitical uncertainty.
This diplomatic-shipping feedback loop operates through three primary channels:
- War risk insurance pricing for Hormuz transits has escalated to levels that render many voyages economically non-viable before cargo value is even factored in
- Cargo diversion decisions are being made weeks in advance based on diplomatic signals rather than real-time security conditions, creating lead-time effects that amplify the apparent traffic collapse
- Flag state advisories from major maritime nations have broadly discouraged transit, shrinking the pool of operators willing to enter the corridor even when security conditions temporarily improve
Benchmarking the Current Crisis Against History
Context matters when interpreting traffic data this extreme. How does the current disruption compare to previous chokepoint crises?
| Event | Period | Estimated Traffic Reduction | Documented Impact |
|---|---|---|---|
| Tanker War (Iran-Iraq conflict) | 1984–1988 | 25–40% at peak | Significant regional risk premium |
| Gulf War I | 1990–1991 | Temporary near-closure | Brent spike above $40/barrel |
| Houthi Red Sea Campaign | 2023–2024 | ~50% at Bab el-Mandeb | Freight rate surge, limited crude price impact |
| Current Hormuz Disruption | February 2026–present | Up to 93% on worst days | Ongoing assessment |
The proportional scale of single-day traffic collapses recorded since February 2026 has no clear modern equivalent at the Strait of Hormuz. Previous crises reduced throughput substantially without approaching the single-digit vessel counts now being recorded on individual days.
Downstream Consequences Across Different Time Horizons
The market consequences of sustained Hormuz disruption are not uniform across time. They evolve as the disruption lengthens, with each phase generating different pressure points.
Immediate-term impacts (0–30 days):
- Spot freight rates on Cape of Good Hope rerouting surge as vessel capacity concentrates outside Hormuz
- LNG spot prices in Asia rise as contracted Gulf supply faces delivery uncertainty
- Refinery run rates in India and East Asia adjust to reduced crude availability
Medium-term impacts (30–90 days):
- Strategic Petroleum Reserve drawdowns activated by major importing nations
- Cape of Good Hope rerouting adds 10 to 15 days to voyage times, absorbing significant global tanker capacity
- Atlantic basin LNG cargoes are redirected eastward, tightening the spot market further
Long-term structural impacts (90+ days):
- Accelerated investment in alternative supply infrastructure and non-Gulf LNG capacity
- War-risk insurance market restructuring around updated chokepoint classifications
- Permanent traffic pattern shifts become increasingly difficult to reverse even after security conditions improve
Frequently Asked Questions About Ships Passing Through the Strait of Hormuz
Is the strait currently open or closed?
The waterway is not formally closed but is operating at severely reduced commercial capacity. Multiple routing options remain technically available; however, the volume of ships passing through the Strait of Hormuz on any given day has fallen to a fraction of pre-war norms, with some days recording fewer than ten vessels against a historical baseline of 70 to 100.
Why are no VLCCs transiting right now?
Very Large Crude Carriers represent the highest-value energy transport assets and are consequently the most sensitive to war-risk insurance pricing movements. At current premium levels, VLCC operators and cargo owners have determined that rerouting through longer alternatives is commercially preferable to Hormuz transit, even accounting for substantially higher voyage costs.
Do tracking platforms capture all ships passing through the Strait of Hormuz?
No. Platforms relying on AIS transponder data only capture vessels broadcasting their position. A material number of vessels, particularly those operating under sanctioned ownership or Iranian commercial structures, transit with transponders disabled and are therefore invisible to commercial tracking systems. Published daily counts represent minimums, not totals.
Which countries face the greatest supply risk?
India, China, Japan, and South Korea collectively represent the largest share of energy imports that historically transited the Strait of Hormuz. India faces compounded exposure through both major chokepoints simultaneously, as evidenced by Suezmax tanker diversion patterns carrying crude specifically destined for Indian refineries through alternative corridors.
This article draws on vessel tracking data reported by Reuters via ETEnergyworld and publicly available analysis of maritime chokepoint dynamics. Forecasts and timeline projections are inherently uncertain and should not be treated as predictive guarantees. Energy market conditions evolve rapidly in response to geopolitical developments, and readers should consult current reporting for the latest figures.
Want to Stay Ahead of the Commodity Market Shifts Triggered by Global Supply Disruptions?
When geopolitical crises reshape energy and commodity markets at speed, Discovery Alert's proprietary Discovery IQ model instantly identifies significant ASX mineral discoveries that may benefit from shifting supply dynamics — delivering real-time alerts so subscribers can act ahead of the broader market. Explore how historic mineral discoveries have generated substantial returns and begin your 14-day free trial today to secure a genuine market-leading edge.