July 5, 2026
The Hidden Architecture of Aluminium Price Discovery
Few commodities reveal the intersection of physical markets, financial positioning, and geopolitical anxiety quite like aluminium. Unlike crude oil, which commands daily headlines during supply disruptions, aluminium tends to move quietly through global supply chains until a structural trigger forces the market to reprice risk all at once. When that repricing happens, it happens fast. Understanding why prices move matters as much as tracking where they move, and the mechanics behind aluminium's pricing architecture are far more nuanced than most downstream buyers and industrial consumers ever appreciate.
The LME aluminium price four-year high recorded on May 13, 2026, is not simply a number on a trading screen. It is the output of several converging forces, including physical inventory drawdowns, geopolitical supply exposure, forward curve compression, and a warrant market signalling genuine urgency from buyers seeking to secure metal in hand rather than metal on paper.
When big ASX news breaks, our subscribers know first
The Structural Forces Reshaping Global Aluminium Pricing in 2026
Aluminium occupies a unique position among base metals. It is simultaneously an industrial commodity, a packaging material, a critical input for clean energy infrastructure, and an increasingly strategic resource for defence and aerospace manufacturing. This breadth of application means that pricing shocks propagate across more sectors, more quickly, than equivalent moves in more narrowly consumed metals.
Beyond the Headline: What a Four-Year Price Peak Actually Signals
When a commodity revisits a multi-year price extreme, the instinct is to focus on the number itself. However, the more analytically useful question is what structural conditions had to align for the market to reach that level again. In aluminium's case, the conditions of mid-2026 involve a combination of:
- Sustained demand from decarbonisation-driven sectors including electric vehicles, battery storage infrastructure, and solar energy systems
- Supply concentration risks in a small number of geographically exposed producing regions
- Inventory levels that, while not critically low by historical standards, are declining at a pace that signals tightening physical availability
- Financial market positioning that amplifies directional moves during periods of heightened uncertainty
Aluminium pricing cycles differ from copper or zinc in one important respect: the production process is far more energy-intensive, meaning that input cost dynamics interact with geopolitical factors in ways that can simultaneously compress smelter margins and elevate physical scarcity premiums. The two forces do not always move in the same direction, creating windows where smelters and traders capture different sides of the same supply shock. Furthermore, major aluminium mining companies must navigate these dynamics carefully when setting long-term production strategies.
What Is Driving the LME Aluminium Price to a Four-Year High?
The primary catalyst for the May 2026 surge was heightened geopolitical risk surrounding the Strait of Hormuz, the narrow waterway connecting the Persian Gulf to the Arabian Sea. The Strait is not merely an oil transit corridor. It is also a critical shipping route for aluminium produced across Gulf states, including the UAE, Bahrain, and Saudi Arabia.
Gulf Supply Exposure: A Market Repricing Event
What makes this particular supply risk so significant is the concentration of non-Chinese aluminium production in Gulf economies. Consider the scale:
| Supply Metric | Estimated Share |
|---|---|
| Gulf countries' share of global aluminium supply | ~9% |
| Gulf countries' share of non-Chinese global supply | ~25% |
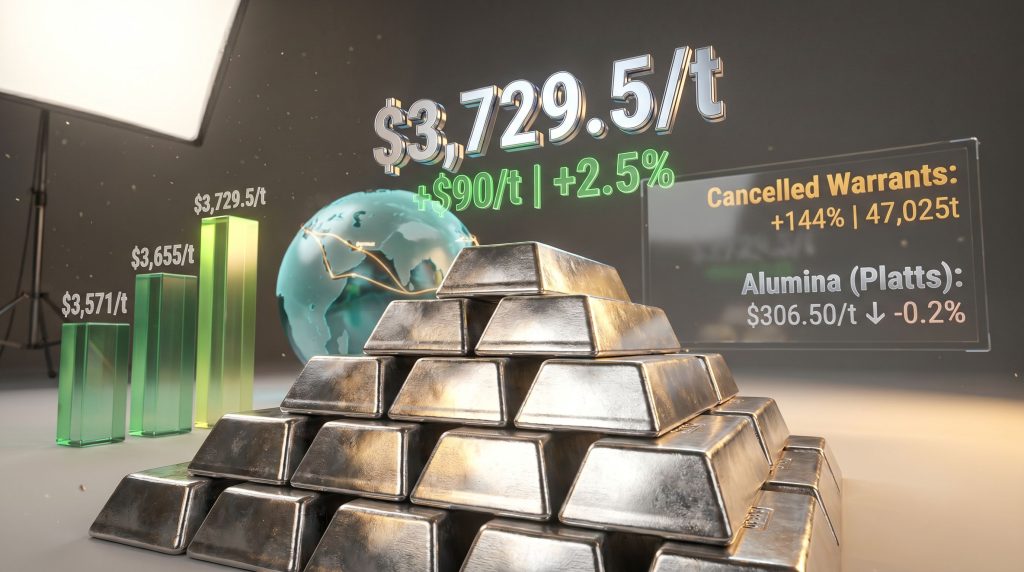
| LME cash offer peak (May 13, 2026) | $3,729.5/t |
| Prior session cash offer | $3,639.5/t |
| Single-session price gain | +$90/t (+2.5%) |
The significance of the non-Chinese share cannot be overstated. While China dominates global aluminium production, its output is largely consumed domestically and subject to separate export dynamics. For markets in Europe, Southeast Asia, Japan, and North America that rely on non-Chinese supply, the Gulf region represents roughly one quarter of all available metal. Any credible threat to that flow is repriced almost immediately. In addition, ongoing pressures from US aluminium tariffs have further complicated supply chain strategies for buyers in these regions.
Why Cash-to-Three-Month Spread Widening Is a Warning Signal
One of the lesser-discussed technical signals in the May 13 session was the compression pattern between spot and forward pricing. Cash prices rose by $90/t while three-month contracts advanced by approximately $83.5–$84/t, and December 2027 contracts moved by only $35/t. This flattening of the forward curve toward the front end is a textbook indicator of acute near-term supply anxiety rather than a permanent structural shift.
When spot prices outpace forward prices during a supply event, the market is communicating that the disruption risk is time-limited. If traders believed the supply loss was permanent, longer-dated contracts would rise by an equivalent amount. The compressed gain in December 2027 contracts suggests the market assigns a relatively low probability to multi-year supply disruption, even while pricing significant near-term risk.
How Did LME Aluminium Contracts Perform on May 13, 2026?
The session of May 13 produced broad-based gains across every contract tenor, though the magnitude of those gains declined systematically with contract maturity. This gradient is itself an important data point. You can track live aluminium prices directly on the LME's official platform to monitor ongoing movements.
Spot Market Movements
Both the LME cash bid and cash offer advanced by $90 per tonne, representing a 2.5% single-session move:
- Cash bid: $3,639/t to $3,729/t
- Cash offer: $3,639.5/t to $3,729.5/t
- Settlement price: $3,653.85/t
The spread between the intraday cash offer high of $3,729.5/t and the settlement price of $3,653.85/t reflects the difference between peak transactional prices and the official LME settlement mechanism, which uses a weighted average of Ring trading during the official closing session.
Three-Month Forward Contracts: Structural Demand Signals
- 3-month bid: Advanced from $3,565.5/t to $3,649/t, a gain of $83.5/t (+2.3%)
- 3-month offer: Rose from $3,566/t to $3,650/t, a gain of $84/t (+2.4%)
- 3-month Asian Reference Price: Climbed from $3,562/t to $3,652.5/t, a gain of $90.5/t (+2.6%)
The 3-month Asian Reference Price tracking slightly above the standard LME 3-month offer suggests that Asian physical buyers were willing to pay a marginal premium for forward delivery, reflecting regional tightness in Pacific basin supply chains.
Longer-Dated Contracts: Reading the December 2027 Signal
- December 2027 bid: $3,145/t to $3,180/t (+$35/t, +1.0%)
- December 2027 offer: $3,150/t to $3,185/t (+$35/t, +1.0%)
The fact that longer-dated contracts gained only 1.0% against the spot market's 2.5% gain is a structurally important divergence. It indicates the market is treating this as a shock to be absorbed over months rather than a permanent revision to supply expectations. That interpretation could change rapidly if disruption timelines extend beyond initial market assumptions.
What Is the LME Aluminium Price Timeline Leading Into the Four-Year High?
The May 13 session did not arrive in isolation. The approach toward a four-year high began approximately one month earlier and followed a pattern of acceleration, brief consolidation, and renewed advance.
Key Price Milestones: April to May 2026
| Date | LME Aluminium Price | Context |
|---|---|---|
| April 13, 2026 | ~$3,571/t | Initial four-year high territory reached |
| Mid-April 2026 | ~$3,655/t | Hormuz disruption fears accelerate pricing |
| May 13, 2026 (settlement) | $3,653.85/t | Sustained four-year high territory |
| May 13, 2026 (cash offer peak) | $3,729.5/t | Session peak price |
| Recent session high | ~$3,676/t | Highest level since March 2022 |
Why March 2022 Remains the Critical Historical Reference Point
March 2022 represented one of the most volatile periods in LME history, characterised by the nickel short-squeeze crisis that temporarily forced exchange trading to halt and rattled confidence across multiple base metal contracts. Aluminium was caught in the broader commodity surge of that period, amplified by energy supply disruptions and post-pandemic demand acceleration.
Revisiting those levels in 2026 from a different directional pathway — driven by geopolitical supply risk rather than post-pandemic demand surge — suggests the underlying structural tightness in aluminium markets has meaningfully increased over the intervening four years. Global demand from the energy transition has not materially paused, while new primary supply capacity additions have been modest outside of China. Consequently, shifts in aluminum and alumina markets are being watched closely by producers and buyers alike.
How Are LME Aluminium Inventories Shifting During This Rally?
Price movements in commodity markets can be dismissed as speculative noise. Inventory movements, however, cannot. The physical warehouse data from May 13 confirmed that the price signal was grounded in genuine physical market tightening.
Opening Stock and Live Warrant Declines
On May 13, 2026, LME warehouse inventory data showed the following:
- Opening stock: Declined by 2,350 tonnes (-1%), from 353,350t to 351,000t
- Live warrants: Fell by approximately 30,000 tonnes (-9%), from 331,725t to 301,725t
The distinction between opening stock and live warrants is technically important. Opening stock represents total metal registered across all LME-approved warehouses globally. Live warrants represent the subset of that metal that is available for trade, meaning it has not yet been earmarked for physical removal. A 9% decline in live warrants in a single session is a significant drawdown.
The Cancelled Warrant Surge: A 144% Single-Session Signal
Cancelled warrants jumped by 27,750 tonnes in a single session, a 144% increase, rising from 19,275t to 47,025t. This is the most structurally significant data point from the May 13 session.
Cancelled warrants represent metal that has formally been earmarked for physical removal from LME warehouses. Once cancelled, this metal is no longer available for LME trading purposes and is typically in the process of being collected by a buyer who needs physical delivery. A surge of this magnitude in a single session indicates that one or more large buyers rapidly accelerated their physical offtake, reducing the effective pool of available LME metal and directly contributing to spot price elevation.
The three-way relationship between these inventory metrics on May 13 tells a coherent story:
- Total stock declined modestly (-1%), suggesting inflows and outflows were near equilibrium overall
- Live warrants fell sharply (-9%), indicating rapid reclassification of available metal
- Cancelled warrants surged (+144%), confirming aggressive physical accumulation by buyers
This pattern is consistent with strategic inventory building by industrial consumers who fear supply disruption will outlast initial market expectations, creating a self-reinforcing dynamic where accelerated buying tightens the physical market further.
The next major ASX story will hit our subscribers first
Is the Aluminium Market Facing a Structural Supply Deficit or a Temporary Shock?
The honest answer is that the market itself has not yet decided. The forward curve pricing structure on May 13 suggests the dominant view is a temporary disruption, but temporary disruptions have a history of becoming permanent if geopolitical conditions deteriorate rather than stabilise.
Scenario Analysis: Three Possible Market Trajectories
Scenario 1: Disruption Resolves Within 60 to 90 Days (Base Case)
- Geopolitical tensions de-escalate through diplomatic channels
- Gulf aluminium producers resume normal export volumes
- Prices retreat toward a $3,400 to $3,500/t range
- Cancelled warrants unwind as physical urgency diminishes
Scenario 2: Prolonged Supply Constraint Through H2 2026
- Gulf supply routes remain disrupted or uncertain through the second half of the year
- Prices consolidate above $3,600/t with potential testing of $3,800/t
- Physical premiums in European and Asian spot markets widen materially above LME benchmarks
- Downstream manufacturers accelerate hedging activity, adding financial buying pressure
Scenario 3: Full Supply Shock Escalation (Low Probability, High Impact)
- Extended Strait of Hormuz disruption triggers emergency procurement across global buyers
- Analyst bull-case price targets approaching $4,000/t come into play
- Self-reinforcing demand pull as downstream buyers stock aggressively ahead of anticipated shortfalls
- A structural repricing of non-Chinese aluminium supply risk that persists beyond 2026
Disclaimer: Scenario projections involve significant uncertainty and should not be interpreted as financial forecasts or investment advice. Commodity markets are subject to rapid change based on geopolitical, macroeconomic, and supply-side developments that cannot be predicted with precision.
How Does the Alumina Price Fit Into the Broader Aluminium Cost Picture?
One of the more analytically interesting features of the May 13 session was the divergence between aluminium and alumina pricing. While aluminium surged by 2.5%, alumina moved in the opposite direction.
The Alumina Platts Benchmark on May 13, 2026
The alumina Platts benchmark declined by $0.65/t (-0.2%), shifting from $307.15/t to $306.5/t on the same day aluminium hit its session high.
| Stage | Commodity | May 13 Price (Approx.) | Direction |
|---|---|---|---|
| Raw material | Bauxite | Market-dependent | Variable |
| Intermediate | Alumina (Platts) | $306.50/t | Down 0.2% |
| Finished metal | LME Aluminium (cash offer) | $3,729.50/t | Up 2.5% |
Why Diverging Prices Create Smelter Margin Expansion
Alumina typically accounts for roughly 30 to 35% of total aluminium production costs at the smelter level, though this varies significantly based on energy costs, labour, and geography. When aluminium prices rise while alumina prices fall or remain flat, smelters experience meaningful margin expansion. This creates a financial incentive to maximise output, which over a medium-term horizon of several months could increase primary aluminium supply and eventually moderate prices.
However, this margin expansion signal takes time to translate into additional physical supply. Smelter ramp-up timelines, energy contract constraints, and logistical bottlenecks mean that even highly profitable production economics do not immediately translate into additional tonnes of available metal. This lag is one reason why physical tightness can persist even when smelter economics are favourable.
The bauxite-to-alumina-to-aluminium value chain is a three-stage process, and disruption or opportunity at any stage propagates differently through the system. Geopolitical supply shocks tend to hit finished metal prices first and fastest, with upstream effects emerging more gradually. Furthermore, global bauxite production patterns play a foundational role in determining how quickly any supply response can materialise across the value chain.
What Do Rising Aluminium Prices Mean for Downstream Industries?
The consequences of sustained aluminium price elevation extend well beyond commodity trading desks. The metal is embedded throughout the global manufacturing economy in ways that make price spikes broadly disruptive.
Sectors Most Exposed to Spot Price Volatility
- Automotive manufacturing: Modern vehicle platforms, particularly electric vehicles, use significantly more aluminium than combustion-engine equivalents. Input cost pressure is immediate and difficult to pass through quickly given contracted supply agreements
- Aerospace and defence: Long procurement cycles and fixed-price contracts limit short-term hedging flexibility, creating budget exposure for programmes with multi-year delivery schedules
- Packaging and consumer goods: High-volume, thin-margin users absorb spot price moves with minimal buffer, often requiring rapid renegotiation of supplier contracts
- Construction and infrastructure: Cost escalation risk on aluminium-intensive building projects affects project economics and can delay investment decisions
- Renewable energy infrastructure: Solar panel framing, transmission cable, and battery storage components all use aluminium intensively. This creates an ironic dynamic where the energy transition simultaneously drives demand and exposes the sector to the price consequences of that demand — a challenge also faced by developers pursuing low-emissions metals production
Hedging Strategies and Procurement Responses
Industrial buyers facing sustained price elevation typically respond through a combination of strategies:
- Forward purchasing: Locking in supply at current prices ahead of anticipated further increases
- LME hedging: Using financial derivatives to cap input costs without taking physical delivery
- Contract renegotiation: Adjusting pricing mechanisms in long-term supply agreements to include aluminium price pass-through clauses
- Substitution analysis: Evaluating whether alternative materials can replace aluminium in specific applications without performance compromise
- Inventory pre-building: Accelerating physical stock accumulation, which itself contributes to the cancelled warrant surge seen on May 13
Frequently Asked Questions: LME Aluminium Price Four-Year High
What is the LME aluminium price four-year high in 2026?
As of mid-May 2026, the LME aluminium cash offer reached $3,729.5 per tonne on May 13, representing a level not sustained since March 2022 and confirming a four-year high. You can view historical aluminium price data to contextualise this move within longer-term market trends.
Why did aluminium prices surge so sharply in May 2026?
The primary catalyst was escalating geopolitical risk centred on the Strait of Hormuz, which threatened the export routes of Gulf region producers collectively accounting for approximately 9% of global aluminium supply and approximately 25% of non-Chinese global supply.
What are LME cancelled warrants and why did they surge 144% in one session?
Cancelled warrants represent aluminium formally registered in LME warehouses that has been earmarked for physical removal by a buyer. The 144% single-session surge, rising from 19,275 to 47,025 tonnes, indicates aggressive physical accumulation — a leading indicator of tightening supply availability.
What is the difference between LME cash and three-month aluminium contracts?
Cash contracts represent immediate or near-immediate delivery, while three-month contracts reflect forward delivery pricing. The spread between them, called the basis, indicates market structure. When cash rises faster than forwards, as occurred on May 13, the market is signalling acute near-term tightness.
Could LME aluminium reach $4,000 per tonne?
Analyst bull-case scenarios suggest $4,000/t is achievable under sustained supply disruption and accelerated downstream inventory building. This remains a tail-risk outcome rather than a base-case projection, contingent on geopolitical conditions worsening rather than stabilising. This should not be construed as financial advice.
How does alumina pricing affect aluminium smelter economics?
Alumina is the primary raw material for aluminium smelting, typically representing 30 to 35% of production costs. When aluminium prices rise while alumina prices decline, as observed on May 13, smelter margins expand, potentially incentivising higher production over the medium term.
Key Takeaways: What the Four-Year High Tells Us About Aluminium Market Structure in 2026
The May 13 session was not a random price spike. It was the output of a coherent set of physical and financial market signals that, taken together, paint a picture of a market under genuine pressure.
The critical data points converge clearly:
- The LME aluminium price four-year high of $3,729.5/t was reached on the back of a 2.5% single-session move driven by Gulf supply disruption fears
- Cancelled warrants surged 144% in a single session, confirming physical buyers are accelerating offtake from exchange warehouses
- Live warrants fell 9% in the same session, reinforcing the physical tightening narrative
- Forward curve compression suggests the market views disruption risk as acute rather than permanent, though that view could shift rapidly
- Alumina pricing diverged downward on the same day, creating a smelter margin expansion that could incentivise medium-term supply response
Whether this rally proves to be a temporary repricing of geopolitical risk or the beginning of a sustained structural price elevation will depend heavily on how long Gulf supply routes remain under threat and how quickly downstream buyers move from cautious hedging to aggressive physical accumulation. The warrant data from May 13 suggests that process may already be underway.
Want To Identify ASX Mineral Discoveries Before The Broader Market Does?
Discovery Alert's proprietary Discovery IQ model delivers real-time alerts on significant ASX mineral discoveries — cutting through complex commodity data to surface actionable investment opportunities the moment they're announced. Explore how historic mineral discoveries have generated substantial returns and begin your 14-day free trial today to gain a market-leading edge.