July 16, 2026
The Hidden Cost Crisis Threatening America's Solar Boom
Few materials shape the economics of modern energy infrastructure as quietly as aluminium. Steel gets the headlines. Copper draws the attention of commodity traders. But in the world of solar energy, aluminium is the silent cost driver that underpins almost every installation from utility-scale desert arrays to commercial rooftop systems. The aluminium price surge hits US solar industry amid rising Gulf tensions is reshaping project budgets with surprising speed and depth, as geopolitical turbulence in the Middle East sends commodity markets into a volatile new phase.
When big ASX news breaks, our subscribers know first
Why Aluminium Is the Solar Industry's Most Overlooked Input
Understanding why aluminium matters so much to solar developers requires a closer look at what actually goes into a solar installation beyond the panels themselves. The photovoltaic modules capture the attention during procurement discussions, but it is the structural ecosystem surrounding those modules that demands physical aluminium in large quantities.
Every solar farm requires an extensive network of mounting rails, racking frames, bracket systems, and clamping hardware. These components hold panels at precise angles, withstand wind loads, accommodate thermal expansion, and anchor the entire array to whatever surface it sits on. Across a utility-scale installation, this structural layer represents a substantial portion of the bill of materials.
Industry analysis indicates aluminium accounts for roughly 9 to 10 percent of total solar project costs through these mounting and structural systems. That proportion may sound modest in isolation, but across the scale of planned US solar deployment, even incremental price changes in aluminium translate into billions of dollars of aggregate financial exposure.
The LME Benchmark Problem: Why Geography Offers No Protection
A common assumption among project developers is that sourcing aluminium from stable, nearby suppliers like Canada insulates them from disruptions occurring thousands of kilometres away in the Persian Gulf. This assumption is fundamentally incorrect, and understanding why requires grasping how commodity benchmark pricing actually functions.
The London Metal Exchange sets the reference price for aluminium globally. Whether a US buyer is procuring metal smelted in Quebec or refined in Abu Dhabi, the contract price is anchored to LME benchmarks plus regional delivery premiums. When supply concerns emerge in any significant producing region, the benchmark itself moves upward, lifting costs for all buyers regardless of where their physical metal originates.
This is the structural trap that North American solar developers are currently caught in. Canadian producers, who supply more than 50 percent of total US aluminium imports, are adjusting their contract pricing in alignment with elevated international benchmark rates. Furthermore, the geographic diversification of US supply chains has not provided the price insulation that many assumed it would. The broader impact of US aluminium tariffs has compounded these pressures considerably.
What Gulf Tensions Are Doing to Aluminium Markets
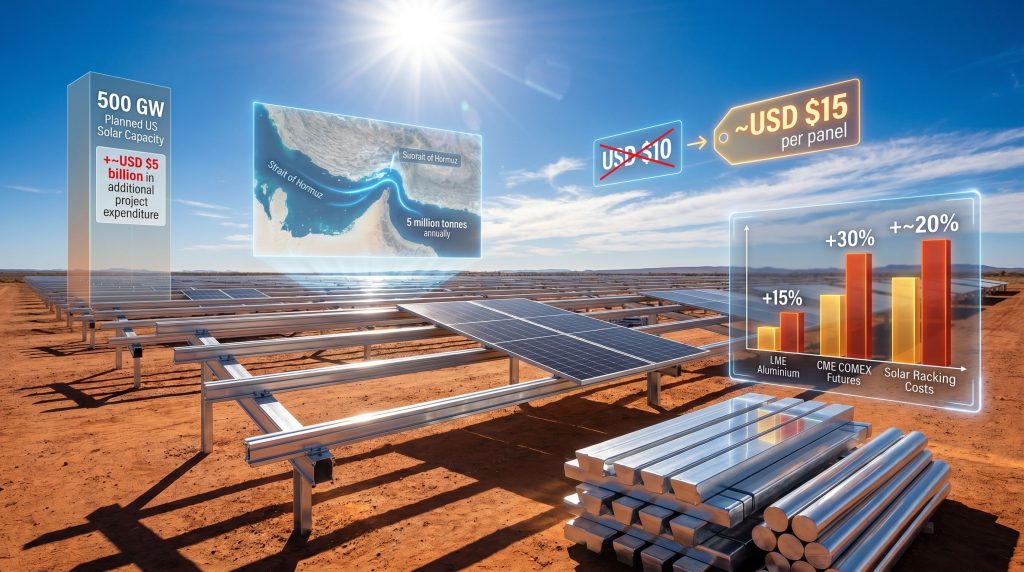
The Strait of Hormuz is one of the most strategically significant waterways on earth for energy markets. Less widely understood is its critical importance to global aluminium supply chains. More than 5 million tonnes of aluminium-related cargo transits this narrow passage annually, connecting Gulf-region smelting capacity with major consuming markets across Asia, Europe, and North America.
The Middle East represents approximately 8 percent of global aluminium smelting capacity, but its relevance to the US market is amplified by the concentration of bilateral trade flows. The UAE and Bahrain alone accounted for roughly 12 percent of US primary aluminium imports in the period leading into the current disruption, contributing to a Gulf-region share of approximately 21 percent of total US primary aluminium sourcing.
When conflict damages refining infrastructure and disrupts shipping logistics through the Strait of Hormuz, the immediate market consequence is not a physical shortage of global aluminium but rather an inflation of physical delivery premiums. Buyers scramble to secure alternative supply, shipping routes lengthen, insurance costs escalate, and the premium layer stacked above LME benchmark prices expands. Consequently, the result is higher effective costs for buyers even when total global production volumes remain largely intact. According to outages at Gulf smelters pushing prices up, the scale of these disruptions has been more significant than initially anticipated.
Benchmark Price Movements Since Late February
The speed and scale of the aluminium price response to Gulf tensions has caught many solar procurement teams off guard. The following table captures the key market movements:
| Benchmark or Cost Metric | Price Movement | Timeframe |
|---|---|---|
| London Metal Exchange Aluminium | +15% | Since late February |
| CME COMEX Aluminium Futures | +30%+ | Since late February |
| Solar Racking and Mounting Systems | +~20% | Project-level cost increase |
| Aluminium Frame Cost Per 500W Panel | USD $10 to ~$15 | Pre-disruption vs. current scenario |
| Cost Per Watt (Aluminium Framing) | $0.02 to ~$0.03 | +50% increase |
The divergence between LME and COMEX movements reflects differences in contract structure and market participation, but both indicators point unambiguously in the same direction.
Quantifying the Damage to Solar Project Economics
The financial mathematics of aluminium cost inflation become genuinely confronting when applied at the scale of the US solar deployment pipeline. According to data from the US Energy Information Administration, developers are targeting the addition of approximately 43.4 gigawatts of utility-scale solar capacity in 2026 alone, representing roughly 60 percent growth relative to the prior year's installation volume.
Across a planned pipeline of 500 gigawatts of US solar capacity, the increase in aluminium framing costs from approximately $0.02 per watt to $0.03 per watt generates an estimated $5 billion in additional project expenditure. Expressed at the panel level, a typical 500-watt solar module that previously required around USD $10 in aluminium framing costs now carries approximately USD $15 per panel under current market conditions.
| Scenario | Cost Per Panel | Cost Per Watt | Aggregate Impact (500 GW Pipeline) |
|---|---|---|---|
| Pre-Disruption Baseline | ~USD $10 | ~$0.02/W | Baseline |
| Post-Disruption Projection | ~USD $15 | ~$0.03/W | +~USD $5 billion |
Which Projects Are Most Exposed?
Not all solar projects carry the same vulnerability to this cost shift. The categories facing the greatest margin compression include:
- Utility-scale solar farms operating on thin internal rates of return where input cost assumptions are locked into financial models
- Commercial rooftop installations on office buildings, warehouses, and industrial facilities where budget flexibility is limited
- Data centre solar procurement tied to AI infrastructure expansion, where speed-to-power requirements create additional cost pressure
- Projects where racking and mounting represent a disproportionately high share of total installed cost relative to panel costs
Industry executives have indicated that some projects with weaker financial return profiles may no longer be economically viable under current aluminium pricing conditions. This is particularly concerning for projects that locked in revenue assumptions, such as power purchase agreement pricing, before the commodity escalation began in late February.
A Triple-Pressure Environment for US Solar Developers
The aluminium price surge hits US solar industry amid rising Gulf tensions at a moment when developers are already navigating compounding challenges. US solar developers in 2026 are simultaneously managing three distinct cost and policy headwinds that collectively represent an unusually hostile operating environment.
Three Simultaneous Cost Headwinds Facing US Solar in 2026:
- Aluminium price inflation (+15–30% on benchmarks; +20% on racking and mounting)
- Tariffs on imported solar panels raising module procurement costs
- Policy uncertainty under an administration prioritising fossil fuel development
In addition, the broader consequences of steel and aluminium tariffs introduced in recent years continue to reverberate through industrial supply chains. Adding complexity to this picture is the paradox created by AI-driven electricity demand. Surging power consumption from data centre construction is accelerating solar deployment timelines, intensifying procurement activity, and amplifying cost sensitivity simultaneously.
"The confluence of commodity inflation, trade tariffs, and policy headwinds creates a scenario where the economics of solar development are being stress-tested across multiple dimensions at once — a situation without clear precedent in the modern US renewable energy industry."
The Supply Chain Transmission Lag: When Will Costs Peak?
Commodity price movements do not immediately translate into project-level cost increases. There is a structural transmission lag as higher spot prices work their way through procurement contracts, fabrication pipelines, and installation schedules. This lag creates a window in which current project economics may appear intact while future project budgets are already compromised.
The cost passthrough moves through a distinct hierarchy:
- Raw material producers absorb initial margin pressure as spot prices spike faster than contract renegotiations
- Racking and mounting system manufacturers begin passing elevated input costs to distributors through revised pricing schedules
- Solar EPC contractors face a choice between revising project budgets upward or absorbing margin compression internally
- Commercial and utility-scale energy buyers encounter higher power purchase agreement pricing or face project delays as economics are reassessed
- End-use electricity consumers may experience long-term rate impacts if the pace of solar capacity additions slows materially
Industry participants expect the full financial impact to become most visible in the second half of 2026 as higher commodity prices complete their journey through the supply chain. Commercial buyers including utility-scale developers, large office buildings, factories, and data centres are expected to face direct cost increases during this period. Furthermore, the energy transition mineral demand outlook suggests these pressures are unlikely to ease quickly given the structural scale of clean energy buildout globally.
The next major ASX story will hit our subscribers first
The Strategic Blind Spot: US Aluminium Reserve Capacity
One underappreciated dimension of this situation is the structural absence of a US strategic reserve mechanism for aluminium comparable to the Strategic Petroleum Reserve framework for oil. As solar deployment scales toward hundreds of gigawatts annually, the reliance on globally priced aluminium with no domestic price insulation mechanism represents a growing systemic vulnerability.
The United States imported more than 5 million tonnes of aluminium in 2025 according to US Geological Survey data, reflecting a domestic smelting industry that has contracted dramatically over recent decades. Without meaningful domestic primary aluminium production capacity, US solar developers are permanently exposed to the full volatility of global benchmark pricing, including shocks originating from geopolitical events in regions as distant as the Persian Gulf.
However, some large-scale producers are moving to address supply constraints. For instance, the expansion of Gladstone aluminium operations by Rio Tinto signals that major aluminium supply leaders are beginning to respond to the structural demand signals emerging from clean energy industries. Moreover, stagflation fears gripping markets as aluminium prices soar are adding further urgency to policymakers' consideration of domestic capacity investment.
| Timeframe | Primary Risk | Likely Outcome |
|---|---|---|
| Near-Term (H2 2026) | Cost passthrough to commercial buyers | Higher PPA pricing; potential project deferrals |
| Medium-Term (2027-2028) | Sustained premium inflation if Gulf tensions persist | Supply chain restructuring; domestic sourcing push |
| Long-Term (2029+) | Structural dependency on globally priced aluminium | Policy pressure for domestic smelting investment |
Frequently Asked Questions
How significant is aluminium in total solar project costs?
Aluminium typically represents between 9 and 10 percent of total solar project costs, concentrated in structural mounting systems including rails, frames, clamps, and brackets. While this proportion may appear modest, at the scale of gigawatt-class installations the absolute dollar exposure is substantial.
Why does Gulf supply disruption affect buyers sourcing from Canada?
Because North American aluminium markets are integrated into the global LME benchmark pricing system, disruptions anywhere in the world's significant producing regions lift costs for all buyers. Canadian producers adjust contract prices in line with international benchmark movements, meaning physical proximity to a stable supplier does not provide price insulation.
Could the US solar build-out slow due to aluminium costs?
While the overall expansion trajectory is unlikely to halt entirely, projects operating at marginal economics are at genuine risk of deferral or cancellation. The EIA's projection of 43.4 GW of new solar capacity in 2026 carries downside risk if aluminium cost pressures persist through the year's second half and combine with ongoing panel tariff and policy headwinds. The aluminium price surge hits US solar industry amid rising Gulf tensions in ways that could materially reshape the deployment timeline.
What is the Strait of Hormuz's relevance to aluminium?
The strait functions as the primary maritime corridor connecting Gulf-region aluminium smelting capacity to global markets. More than 5 million tonnes of aluminium-related cargo transits this route annually. Any disruption to navigation through the strait elevates physical delivery premiums in global markets, lifting effective costs for buyers even when aggregate global production remains stable.
This article contains forward-looking projections and market estimates based on publicly available data and industry commentary. Commodity markets are subject to rapid and unpredictable change. Nothing in this article constitutes financial or investment advice. Readers should conduct their own due diligence before making any financial decisions.
Want to Capitalise on the Commodity Shifts Reshaping Energy Markets?
Discovery Alert's proprietary Discovery IQ model delivers real-time alerts on significant ASX mineral discoveries — including those tied to aluminium and other critical materials driving the global energy transition — instantly empowering subscribers to identify actionable opportunities ahead of the broader market. Explore Discovery Alert's discoveries page to understand how historic mineral discoveries have generated substantial returns, and begin your 14-day free trial today to position yourself ahead of the next major market move.