
July 19, 2026
When Geopolitics Moves Metal: Understanding Macro-Driven Sell-Offs in Aluminium Markets
Base metals are uniquely vulnerable to geopolitical sentiment shifts in ways that equity markets often are not. Unlike stocks, which price long-term earnings potential, commodity futures respond almost instantly to perceived changes in physical supply availability. When diplomatic signals suggest that previously restricted trade corridors may reopen, algorithmic and institutional traders reprice entire forward curves within hours. This is precisely the dynamic that unfolded across LME aluminium prices on June 24, 2026, when a single session erased weeks of price consolidation and pushed cash prices decisively below a key psychological threshold.
Understanding what happened on that date, and more importantly why, requires moving beyond the numbers themselves and examining the structural mechanics of how aluminium is priced, inventoried, and traded on the world's most liquid industrial metals exchange. Furthermore, shifts in the aluminum and alumina markets can amplify these dynamics considerably, adding another layer of complexity for traders to navigate.
When big ASX news breaks, our subscribers know first
LME Aluminium Prices on June 24, 2026: The Full Session Breakdown
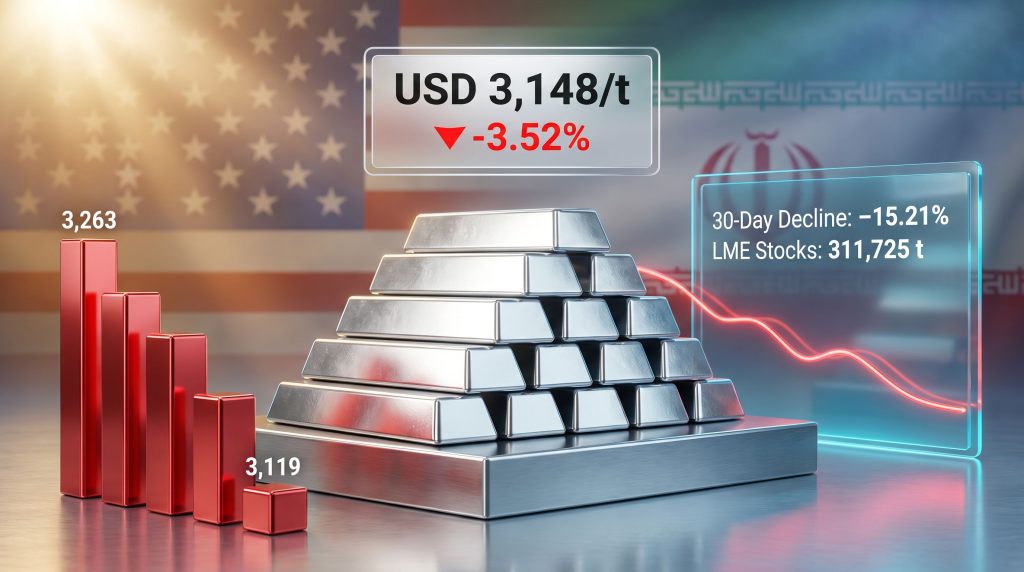
The headline figure from June 24 is stark: the LME aluminium cash bid price fell 3.52% in a single session, dropping from USD 3,263/t to USD 3,148/t. This was not a gradual drift lower but a decisive break through the USD 3,200/t level that had provided support during the June 23 session.
The composite closing price for the session was recorded at USD 3,119/t, reflecting a steeper intraday decline of 4.27% from the prior close. The session's trading range spanned USD 3,113.13 to USD 3,232/t, with sellers dominating throughout. Every contract maturity tracked on the LME aluminium declined on this date.
Complete Price Data: June 23 vs June 24, 2026
| Contract / Metric | June 23 (USD/t) | June 24 (USD/t) | Change (%) |
|---|---|---|---|
| Cash Bid | 3,263.00 | 3,148.00 | -3.52% |
| Cash Offer | 3,263.50 | 3,150.00 | -3.48% |
| 3-Month Bid | 3,269.00 | 3,160.00 | -3.33% |
| 3-Month Offer | 3,271.00 | 3,160.50 | -3.38% |
| Dec-27 Bid | 3,115.00 | 3,038.00 | -2.47% |
| Dec-27 Offer | 3,120.00 | 3,043.00 | -2.47% |
| 3M Asian Reference Price | 3,232.50 | 3,122.50 | -3.40% |
| LME Composite Close | n/a | 3,119.00 | -4.27% |
| Alumina (Platts) | 307.10 | 307.33 | +0.07% |
The divergence between the cash decline of 3.52% and the composite closing decline of 4.27% is analytically important. When the closing price falls by a greater margin than the bid-ask midpoint, it reflects a concentration of selling pressure in the final hour of the trading session. This pattern is characteristic of macro-driven liquidation events, where institutional participants exit positions ahead of weekend or multi-day risk windows rather than respond to supply-side developments.
What Caused the June 24 Aluminium Price Drop?
US-Iran Diplomatic Progress and the Persian Gulf Supply Equation
The dominant catalyst behind the June 24 session decline was renewed diplomatic engagement between the United States and Iran. Progress in these negotiations created market expectations that trade restrictions affecting Persian Gulf metal export corridors could ease in the near term.
For aluminium market participants, this matters for several interconnected reasons. In addition, the broader context of steel and aluminum tariffs has conditioned traders to react swiftly to any geopolitical development with potential supply implications:
- Gulf-region smelters operate in an energy-cost-advantaged environment, underpinned by access to subsidised natural gas, which represents aluminium's single largest input cost at approximately 30–40% of total production expenses
- Any relaxation of trade flow barriers involving Gulf-linked supply chains raises the prospect of additional primary aluminium reaching Western markets
- Traders had already begun positioning ahead of June 24, with UK aluminium futures having retreated to approximately USD 3,230/t in the preceding sessions, marking a three-month low before the June 24 break accelerated the move
"A core principle of commodity market pricing is that futures respond to anticipated supply changes, not confirmed ones. The diplomatic signal alone was sufficient to reprice the forward curve, even without any verified increase in physical shipments."
The Broader Correction Context
The June 24 session did not occur in a vacuum. Over the 30 days preceding this date, LME aluminium prices had already declined by 15.21%, representing one of the more significant correction phases in recent market history for this metal. A drawdown of this magnitude over a single month reflects sustained institutional repositioning rather than a series of independent sell-off events.
This contextual detail matters for interpreting the June 24 move accurately. Consequently, investors and traders who focus exclusively on the single-session percentage change risk misidentifying the event as anomalous, when it is in fact the continuation of a trend that had been building for several weeks. The wider picture of commodity market volatility during this period reinforces that aluminium was not alone in experiencing such corrections.
LME Aluminium Inventory Data: What Warehouse Stocks Reveal
June 24 Inventory Movement Summary
| Inventory Metric | June 23 Level | June 24 Level | Change |
|---|---|---|---|
| Opening Stocks (Total) | 313,800 t | 311,725 t | -2,075 t (-0.66%) |
| Live Warrants | 247,575 t | 247,575 t | Unchanged |
| Cancelled Warrants | 64,150 t | 62,650 t | -1,500 t (-2.34%) |
Decoding the Warrant Structure for Non-Specialist Readers
LME warehouse warrant mechanics are frequently misunderstood outside specialist trading circles. Here is how the two categories function:
- Live warrants represent physical aluminium sitting in LME-registered warehouses that is currently available for delivery against futures contracts. Their stability at 247,575 tonnes across four consecutive sessions means there was no significant demand-side drawdown of available physical inventory on this date.
- Cancelled warrants represent metal for which a delivery instruction has been issued. The holder intends to withdraw this material from the LME system. A decline in cancelled warrants from 64,150 to 62,650 tonnes indicates that near-term physical offtake demand actually softened slightly.
The significance of this inventory profile should not be underestimated. A bearish price move accompanied by stable live warrants and declining cancelled warrants tells a specific story: the sell-off was driven by paper market repositioning, not by an actual surge in available physical supply arriving at warehouses. This distinction separates sentiment-driven corrections from structurally driven bear markets.
"When live warrants remain unchanged during a sharp price decline, it is a signal that physical market participants have not changed their behaviour. The price move belongs to financial traders, not physical consumers or producers."
Reading the Forward Curve: What Longer-Dated Contracts Signal
Curve Structure on June 24
One of the more nuanced signals from the June 24 session comes from comparing the magnitude of declines across contract maturities:
- Cash bid fell 3.52% to USD 3,148/t
- Three-month bid fell 3.33% to USD 3,160/t
- December 2027 bid fell only 2.47% to USD 3,038/t
This graduated decline pattern, with near-term contracts falling harder than longer-dated ones, reveals an important structural dynamic. The market is pricing near-term weakness more aggressively than long-term weakness. With December 2027 contracts retaining a bid above USD 3,000/t even after the sell-off, the forward curve is not signalling a structural collapse in aluminium demand over the medium term.
The spread between the cash price (USD 3,148/t) and the December 2027 bid (USD 3,038/t) reflects a broadly backwardated structure, where near-term prices exceed longer-dated prices. This is typically associated with perceived near-term supply tightness relative to the medium term, even when overall prices are declining. It is a nuanced, and often counterintuitive, signal that experienced LME participants monitor closely when positioning across tenors.
Why Alumina Prices Bucked the Trend
Upstream vs Downstream Divergence
While every aluminium contract on the LME fell on June 24, LME Alumina as assessed by Platts closed at USD 307.33/t, a marginal gain of 0.07% from the prior session's USD 307.10/t. This decoupling carries analytical weight.
Alumina is the direct feedstock for primary aluminium smelting, refined from bauxite ore in a two-step process before being reduced to metal via electrolysis. Its price stability on a day when primary aluminium fell sharply implies several things:
- The sell-off in aluminium was not caused by a fundamental shift in production economics
- Smelter operating cost structures remained broadly unchanged on this date
- The alumina-to-aluminium price ratio compressed, marginally squeezing primary producer margins on an intraday basis
- Physical alumina buyers and sellers did not interpret the geopolitical catalyst as relevant to their near-term procurement calculus
However, this alumina price stability is an important quality filter when assessing the nature of any aluminium price move. When alumina moves in lockstep with aluminium, it suggests cost-side pressure is driving the metal lower. When alumina holds steady as aluminium falls, the sell-off is almost certainly driven by financial positioning, not production fundamentals.
The next major ASX story will hit our subscribers first
The Energy-Aluminium Nexus: A Less Discussed Market Dynamic
Aluminium is sometimes described as solidified electricity, given that electrolytic reduction is the only commercially viable pathway from alumina to primary metal. Energy costs account for a dominant share of smelter operating expenses, which is why aluminium price cycles have historically correlated strongly with regional electricity and natural gas pricing. For instance, tracking aluminium prices over extended periods reveals how tightly these energy cost relationships hold across different market conditions.
This energy dependency creates asymmetric geopolitical sensitivity. When diplomatic developments affect energy-abundant regions, aluminium markets reprice more aggressively than most other base metals because the market is simultaneously pricing both supply availability and the cost structure of that supply. The June 24 US-Iran dynamic tapped directly into this sensitivity, as Persian Gulf smelting capacity benefits from some of the lowest energy input costs globally.
A less commonly appreciated dynamic is the lag structure between energy price changes and aluminium output responses. Unlike, for example, zinc or copper where ore grade and mine throughput are the primary production constraints, aluminium smelters can modulate their output relatively quickly in response to power cost changes. This operational flexibility means the market frequently overreacts to perceived energy cost improvements before actual production responses materialise, creating short-term pricing distortions that revert once physical supply data catches up. Furthermore, these dynamics closely mirror patterns observed in green steel market dynamics, where energy input costs equally drive outsized price responses.
Key Takeaways From LME Aluminium Prices on June 24, 2026
For traders, analysts, and market observers tracking LME aluminium prices on June 24, the session produced a set of coherent, interconnected signals. In addition, understanding tariff impacts on supply chains remains essential context for interpreting why macro-driven sell-offs of this nature can amplify so quickly:
- The 3.52% cash price decline to USD 3,148/t broke a meaningful support level and extended a 15.21% trailing 30-day drawdown
- The steeper composite closing decline of 4.27% signals end-of-session institutional selling, consistent with macro-driven rather than supply-driven liquidation
- All contract maturities declined, with near-term contracts falling harder than longer-dated ones, preserving a December 2027 bid above USD 3,000/t
- Live warrants were unchanged at 247,575 tonnes, confirming the physical market was not actively driving the price move
- Alumina's marginal 0.07% gain confirmed that production cost fundamentals remained stable, and the sell-off was a financial market event
- The US-Iran diplomatic progress acted as the trigger, but the scale of the move was amplified by an already-weakened price structure heading into the session
Disclaimer: This article is intended for informational and educational purposes only. It does not constitute financial or investment advice. Commodity prices are subject to rapid change and past price behaviour is not indicative of future performance. Readers should conduct their own due diligence before making any investment or trading decisions.
Want to Stay Ahead of the Next Major ASX Mineral Discovery?
Discovery Alert's proprietary Discovery IQ model delivers real-time alerts on significant ASX mineral discoveries, cutting through market complexity to surface actionable opportunities the moment they are announced — explore historic discoveries and their returns to understand what early positioning can mean, then begin your 14-day free trial at Discovery Alert to gain a decisive market edge.