June 15, 2026
When Geopolitics Becomes a Price Signal: Understanding the Aluminum Market's Reaction to the Iran Peace Deal
Commodity markets have a long memory for disruption, but an even shorter fuse when that disruption begins to unwind. The aluminum price slumps on Iran peace deal dynamic, playing out across London Metal Exchange trading floors on June 15, 2026, offers a textbook study in how geopolitical risk premiums are built into metal prices during conflict, and just as rapidly deflated when peace frameworks emerge, even before the ink has dried on any formal agreement.
Furthermore, this selloff reflects something deeper than a single news event. It is the unwinding of months of structural anxiety baked into one of the world's most energy-intensive and logistics-dependent industrial metals. Understanding the aluminum and alumina markets is essential context for grasping the full significance of this shift.
When big ASX news breaks, our subscribers know first
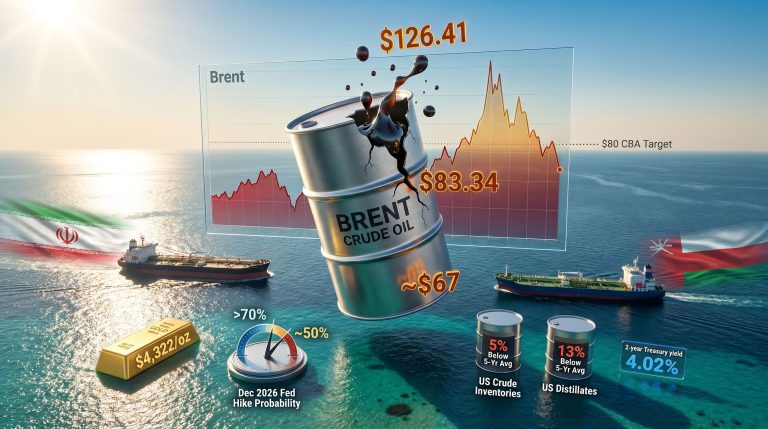
The Strait of Hormuz: A Chokepoint Most Investors Underestimate
The Strait of Hormuz, the narrow waterway connecting the Persian Gulf to the Gulf of Oman, is commonly associated with oil flows. What receives far less mainstream attention, however, is its critical role in the global aluminum supply chain. The strait serves as both an inbound corridor for alumina and bauxite shipments feeding Middle Eastern smelters, and an outbound artery for finished aluminum destined for Asian and European markets.
Middle Eastern producers, including major operations in the UAE, Bahrain, and Saudi Arabia, collectively account for approximately 10% of global aluminum supply. These facilities benefit from low-cost energy, particularly natural gas, which makes them structurally competitive on the global cost curve. Their vulnerability, however, is logistical: they are heavily dependent on unimpeded maritime access through Hormuz.
When the Iran war began, that access was severed or severely constrained. The consequences cascaded quickly:
- Incoming raw material shipments, including alumina, were disrupted, forcing smelters to ration feed stocks
- Outbound metal exports were blocked or rerouted at significant cost and delay
- Several smelting facilities sustained direct damage from missile strikes, compounding production losses
- Insurance premiums for vessels transiting the region surged, making even partial operations economically marginal
The result was a regional output contraction of approximately 35% year-on-year by April 2026, one of the most acute short-cycle supply disruptions in the modern history of the aluminum industry.
How the Market Priced the Conflict, and Then Repriced the Peace
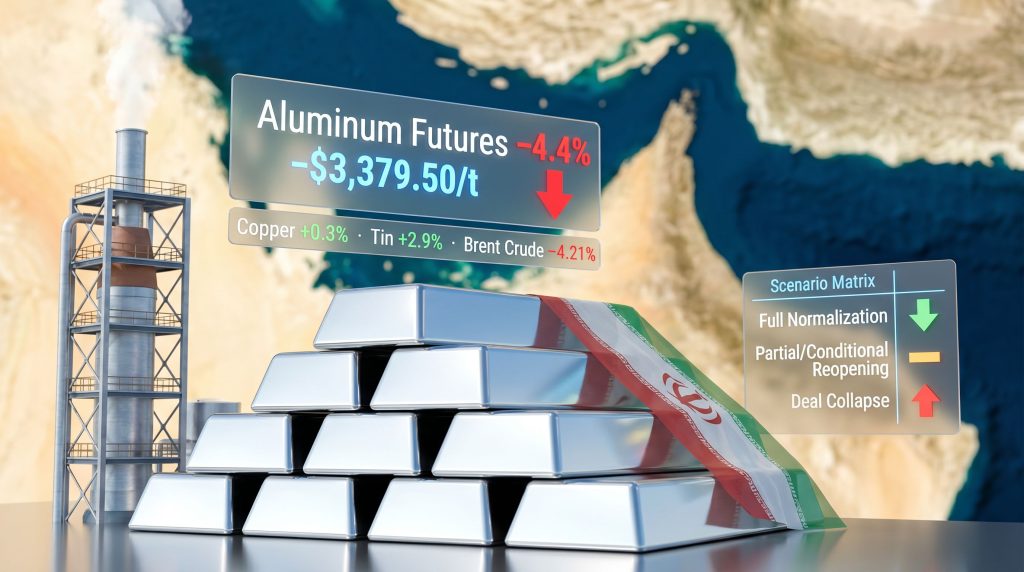
Aluminum futures on the LME dropped 4.4% on June 15, 2026, settling at a two-month low of $3,379.50 per metric ton, the lowest settlement price recorded since March 27. The move stood in stark contrast to the rest of the base metals complex, where most contracts ended the session in positive territory.
| Metal | Price Movement (June 15, 2026) |
|---|---|
| Aluminum Futures | -4.4% / settled at $3,379.50/t |
| Copper | +0.3% |
| Tin | +2.9% |
| Brent Crude Oil | -4.21% |
| Palladium | +5.39% |
Aluminum's decline was the most significant downside mover among base metals on the day, reflecting its concentrated exposure to Hormuz-linked supply risk.
The divergence is instructive. Copper, tin, and precious metals responded to their own individual supply and demand drivers. Aluminum, by contrast, had been trading with an embedded conflict premium tied directly to Hormuz, and that premium began unwinding the moment an interim US-Iran framework agreement was announced.
The agreement, which was still being finalised as of June 15, called for the reopening of the strait once formal signing occurred later that week. Critically, Iran's conditional reopening was reported to cover only a 60-day window, with the terms of any extension subject to further negotiation. That conditionality did not prevent markets from repricing aggressively in the immediate term.
Aluminum's Unique Energy Dependency and Why It Matters
Why Does Energy Cost Define the Aluminum Market?
To understand why aluminum fell harder than any other base metal on this news, it is essential to understand the metal's structural relationship with energy markets. Aluminum smelting is among the most electricity-intensive industrial processes on earth, consuming roughly 13 to 15 megawatt-hours of electricity per metric ton of primary aluminum produced. This makes energy cost the single largest variable in the smelting cost curve.
The correlation between oil price movements and aluminum production economics means that when Brent crude fell 4.21% on the same day, it compounded the bearish signal for aluminum. Lower energy prices reduce the operational cost burden for smelters globally, which, when combined with an anticipated return of Middle Eastern supply, points toward a structurally better-supplied market in the months ahead.
As Gregory Shearer, Head of Base and Precious Metals Research at JPMorgan Chase, has noted, a Hormuz reopening could trigger an immediate knee-jerk price decline given aluminum's high correlation with energy markets. However, Shearer has also emphasised that the underlying supply gap in the market remains substantial, and the central unresolved question is how much longer before depleted invisible inventories are exhausted and visible exchange stocks begin to be drawn down meaningfully.
This distinction between visible and invisible inventories is one of the most important and least understood dynamics in the aluminum market.
Visible vs. Invisible Inventories: The Hidden Dimension of Aluminum Supply
Visible inventories refer to aluminum stocks held in LME-registered warehouses, which are publicly reported and widely tracked. Invisible inventories, by contrast, are held in private storage, off-warrant in non-exchange facilities, or as unreported producer and consumer stocks. These are not publicly disclosed and can only be inferred from indirect signals like warrant cancellation rates, shipping data, and regional premium movements.
During the Iran war, both types of inventory were drawn down simultaneously as the industry sought to maintain supply continuity in the absence of Middle Eastern output. The critical risk now is that even if Hormuz reopens, the pipeline of raw materials and finished metal cannot be restored instantaneously. Smelters that were partially damaged require time to restart safely. Supply chains that were rerouted take time to normalise.
The sequential depletion of invisible stocks before visible LME inventories tighten creates a dangerous false signal for markets. Prices may ease prematurely, discounting a supply recovery that has not yet materially arrived.
China's Production Ceiling: A Structural Constraint the Market Cannot Ignore
China's role in the global aluminum equation during this period has been dual-natured and deserves careful analysis. On one hand, Chinese producers ramped up export volumes significantly after the Iran war began, partially offsetting the loss of Middle Eastern supply to international buyers. On the other hand, Chinese domestic smelters are now approaching state-mandated production caps, a policy constraint that limits how much further output can expand.
China's government-imposed ceiling on aluminum production was designed primarily to manage environmental targets and energy consumption benchmarks under national carbon reduction commitments. The practical effect in 2026 is that the relief valve China provided to global markets during the war is now approaching its operational limit.
Bank of America analysts, including Michael Widmer, have flagged that rising Chinese production and potential inventory releases from the Middle East represent compounding bearish factors that could amplify near-term downside beyond what the peace deal alone would imply. However, the same team acknowledges that once Chinese output hits its regulatory ceiling, that bearish buffer disappears entirely.
This creates an asymmetric risk scenario: bearish in the near term as supply normalises, but potentially bullish again in the medium term if Middle Eastern recovery is slower than markets expect and Chinese capacity headroom has been exhausted.
The next major ASX story will hit our subscribers first
Three Scenarios for Aluminum Prices as the Hormuz Situation Evolves
The path forward for aluminum pricing is not binary. In addition to the peace deal's immediate impact, at least three materially different outcomes are plausible depending on how the geopolitical situation develops.
| Scenario | Hormuz Status | Middle East Output Recovery | Price Outlook |
|---|---|---|---|
| Full Normalisation | Fully reopened, sustained | Rapid recovery within 6 months | Significant downside pressure; inventory rebuild accelerates |
| Partial/Conditional Reopening | 60-day window, uncertain renewal | Gradual, constrained recovery | Modest near-term decline; structural deficit persists |
| Deal Collapse | Strait closure resumes | Output remains suppressed | Sharp price rebound; supply crisis deepens |
The partial reopening scenario is arguably the most likely in the immediate term given the reported 60-day conditional framework. It is also the scenario that creates the most complexity for traders and major aluminium producers attempting to plan forward purchasing or hedging strategies.
Indonesia's Emerging Role as a New Supply Variable
One dimension of the aluminum supply picture that has received comparatively little attention is the accelerating buildout of smelting capacity in Indonesia. The country has been expanding its downstream aluminum processing capability in parallel with its bauxite export restrictions, which were designed to force value-added processing domestically.
Indonesian smelter output is now emerging as an additional bearish variable in the near-term supply balance. As Bank of America analysts have noted, increased supply from Indonesian facilities could compound downside price pressure at precisely the same time that Middle Eastern inventories are being released back into international markets. This confluence of supply-side normalisation events, if they occur simultaneously, could produce a sharper and more sustained price correction than the June 15 move implied.
What Investors and Industry Participants Should Monitor
Navigating the aluminum market through this transition period requires attention to a specific set of forward indicators. Consequently, the following factors will collectively determine whether the current price weakness deepens, stabilises, or reverses.
- Hormuz transit confirmation: Whether shipowners validate safe passage after the formal agreement signing. Shipowner caution has been explicitly flagged as a constraint on rapid supply normalisation
- Middle East smelter restart timelines: Facilities damaged during missile strikes require engineering assessments before capacity can be restored. Recovery rates will be measured in months, not weeks
- China export volumes and output cap enforcement: Any tightening of China's export licensing or domestic output monitoring could rapidly change the supply calculus
- Visible LME inventory movements: Rising LME stocks would indicate that the supply pipeline is recovering. Continued drawdowns would signal the deficit persists despite the peace framework
- Final deal ratification: The interim agreement still requires formal signing, and the specific terms of the 60-day window and any extension mechanism remain incompletely disclosed
- Indonesian smelter ramp rates: The pace at which new Southeast Asian capacity comes online will affect the magnitude of any medium-term price floor
Furthermore, broader trade policy considerations should not be overlooked. US aluminium tariffs continue to shape how global supply flows are redirected, adding another layer of complexity to an already intricate market. Similarly, developments in green steel pricing may influence downstream demand dynamics for aluminium in the medium term.
Frequently Asked Questions
Why did aluminum prices fall on the Iran peace deal news?
Aluminum had been trading with a significant conflict premium embedded in its price, reflecting the loss of Middle Eastern supply and Hormuz-related logistics disruption. When a framework agreement emerged, markets began unwinding that premium in anticipation of supply normalisation, even before the deal was finalised. Copper, by contrast, moved higher on the same day, illustrating how differently individual metals respond to the same geopolitical signal.
What is the difference between visible and invisible aluminum inventories?
Visible inventories are publicly reported stocks held in LME-registered warehouses. Invisible inventories are privately held in off-exchange storage and are not publicly disclosed. Both types were drawn down during the supply crisis, and the depletion of invisible stocks before visible tightness occurs creates a risk of premature market optimism.
How much of global aluminum supply comes from the Middle East?
The Middle East accounts for approximately 10% of global aluminum production, with major smelting operations in the UAE, Bahrain, and Saudi Arabia. During the Iran war, regional output fell approximately 35% year-on-year by April 2026.
Why does China's production cap matter for the global aluminum outlook?
China is the world's largest aluminum producer. During the conflict, Chinese producers increased export volumes to offset some of the Middle Eastern supply loss. However, domestic producers are now approaching state-mandated output ceilings, which means this compensatory buffer has limited remaining capacity.
Will aluminum prices continue to fall if the deal is finalised?
A near-term continuation of downside pressure is plausible if the deal is formally ratified and Hormuz reopens as planned. However, the speed and completeness of Middle Eastern supply recovery remains genuinely uncertain. If the 60-day window expires without renewal, or smelter restarts are slower than anticipated, prices could reverse sharply. The aluminum price slumps on Iran peace deal story is therefore only the opening chapter of what is likely to be a volatile and closely watched market narrative throughout the remainder of 2026.
Disclaimer: This article contains forward-looking analysis and scenario projections based on publicly available information as of June 15, 2026. Commodity markets are subject to rapid change driven by geopolitical, macroeconomic, and supply-side variables. Nothing in this article constitutes financial or investment advice. Readers should conduct their own due diligence before making any investment decisions.
Want to Stay Ahead of the Next Major Commodity Market Shift?
Discovery Alert's proprietary Discovery IQ model delivers real-time alerts on significant ASX mineral discoveries, instantly translating complex commodity dynamics into actionable investment insights — explore historic discoveries and their exceptional market returns to understand the opportunity, then begin your 14-day free trial at Discovery Alert to position yourself ahead of the broader market.