June 9, 2026
The Hidden Transmission Mechanism Connecting Asian Gas Consumption to European Energy Bills
Most European energy consumers instinctively link their gas bills to pipeline politics, winter weather, or domestic policy decisions. Far fewer understand that a utility company in Seoul deciding to rebuild its gas storage inventories in June can directly raise the price of heating a home in Berlin or running a factory in northern Italy. The Asia LNG demand rebound and European gas prices are connected through this transmission mechanism, operating through the global LNG spot market, and it has quietly become one of the most consequential forces shaping European energy costs in 2026.
Understanding why requires stepping back from the news cycle and examining how liquefied natural gas has fundamentally rewired the architecture of global energy pricing over the past decade.
When big ASX news breaks, our subscribers know first
How the Global LNG Market Actually Works as a Pricing System
LNG is natural gas that has been supercooled to approximately minus 162 degrees Celsius, reducing its volume by roughly 600 times and enabling transport by specialised tanker vessels across oceanic distances that pipelines cannot bridge. This physical transformation created what is, in effect, a globally traded commodity, though one with important structural asymmetries that matter enormously for price formation.
The critical distinction within the LNG market is between long-term contracted volumes and spot or flexible cargoes. Long-term contracts, typically lasting 15 to 20 years, link specific export terminals to specific buyers at prices partly indexed to oil benchmarks. Spot cargoes, by contrast, are sold on short-term or even voyage-by-voyage terms and flow to wherever market prices make them most profitable to deliver.
It is the spot and flexible cargo segment that acts as the global balancing mechanism, and it is this segment where Asian demand and European supply interact most directly. Furthermore, the natural gas supply outlook heading into 2025 and beyond has only amplified the sensitivity of this dynamic.
Europe has structurally repositioned itself as the residual buyer in global LNG markets since losing the majority of its Russian pipeline gas flows following the 2022 energy crisis. This means European importers must continuously compete with Asian buyers for available spot cargoes, making Asian demand cycles a direct input into European price formation.
The JKM-TTF Spread: A Barometer Few Outside the Industry Monitor
Two benchmark prices govern this competitive dynamic. The Japan-Korea Marker (JKM) represents the spot price for LNG delivered into Northeast Asia. The Title Transfer Facility (TTF) is Europe's dominant natural gas pricing hub, based in the Netherlands, and serves as the reference price for gas contracts across the continent.
The spread between these two benchmarks functions as a real-time signal of relative demand intensity across the two regions. When the JKM trades at a significant premium over TTF, Asian buyers are outbidding European importers for flexible cargoes, which physically redirects tanker flows eastward and tightens European supply. When TTF trades closer to or above JKM, Europe becomes the more attractive destination, pulling cargoes westward.
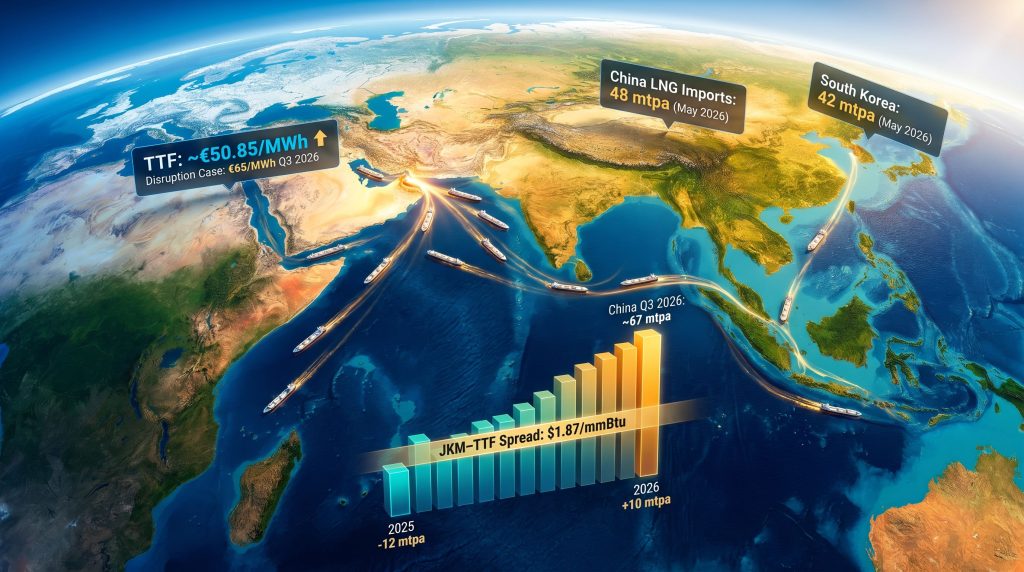
This spread widened to $1.87 per million British thermal units (mmBtu) in May 2026, up from $1.59/mmBtu in April 2026, according to Goldman Sachs analysis reported by Reuters. While this may sound like a modest figure, in a market where individual cargoes contain approximately 65,000 to 80,000 tonnes of LNG, even small per-unit spread differentials translate into multi-million dollar routing decisions for cargo operators.
The 2025 Demand Contraction That Set Up the 2026 Rebound
To properly contextualise the Asia LNG demand rebound and its implications for European gas prices, it is essential to understand the unusual demand environment that preceded it. Asian LNG consumption contracted by an estimated 12 million tonnes in 2025, with China accounting for the largest share of that decline. The causes included a combination of mild weather, sluggish industrial output, and lower-than-expected post-pandemic economic momentum.
This contraction had a tangible and measurable benefit for European gas markets. With Asian buyers absorbing fewer spot cargoes, additional volumes flowed into European terminals, improving storage fill rates and placing a ceiling on TTF price appreciation. Goldman Sachs characterised this dynamic as Asian demand effectively buying Europe additional time to stabilise its post-crisis supply position.
The risk embedded in that assessment, however, is that the benefit was contingent and temporary. A normalisation of Asian demand would inevitably reverse the cargo flow pattern, and preliminary data from May 2026 suggest that reversal is now underway. In addition, European gas price pressures from other sources have compounded the challenge facing importers across the continent.
Understanding the Base Effect Distortion
One analytical nuance that is frequently overlooked in media coverage of the 2026 LNG demand rebound is the role of statistical base effects. When measuring year-on-year demand growth, an anomalously weak prior year naturally produces an amplified growth rate even if the current year's absolute volumes are unremarkable. Part of what is being described as a demand rebound in Asia in 2026 reflects normalisation from the 2025 trough rather than exceptional new demand creation.
This distinction matters for forecasting. Normalisation-driven demand recovery has a natural ceiling once inventory and consumption levels return to trend. Genuine structural demand growth, driven by new gas-fired power capacity, industrial expansion, or LNG import terminal additions, creates a more sustained upward trajectory.
The evidence from China in 2026 suggests both forces are operating simultaneously, which makes the demand signal stronger and more durable than a pure base effect explanation would imply.
Asia's LNG Import Acceleration in Numbers
The quantitative evidence for the Asia LNG demand rebound in 2026 is specific and material. The following table summarises the key data points drawn from Goldman Sachs analysis reported in May 2026:
| Market / Metric | 2025 Position | May 2026 Position | Q3 2026 Projection |
|---|---|---|---|
| China LNG Imports (4-week avg.) | ~36 mtpa (March trough) | ~48 mtpa | ~67 mtpa |
| South Korea LNG Imports | Below trend | ~42 mtpa | Continued elevation |
| Asia-wide LNG Demand vs. Forecast | Below baseline | ~4 mtpa above 225 mtpa forecast | Accelerating |
| Asia LNG Demand Change vs. Prior Year | -12 mtpa contraction | Recovery phase | Strong growth |
The projected acceleration of Chinese LNG imports toward approximately 67 mtpa in Q3 2026 is particularly significant. This trajectory reflects two reinforcing demand drivers:
- Seasonal summer cooling demand from China's expanding urban air conditioning load, which increasingly relies on gas-fired power generation during peak periods.
- Strategic inventory rebuilding ahead of the winter heating season, a pattern that Chinese state utilities have institutionalised following the supply disruptions and price volatility of 2021 and 2022.
South Korean import volumes reaching 42 mtpa in May 2026, above April levels, indicates that the demand recovery is not a single-country phenomenon but reflects broader Northeast Asian energy system dynamics operating in parallel. As Euronews reports, Europe is increasingly losing its grip as LNG cargoes chase higher prices in Asia, reinforcing the competitive pressure on European buyers.
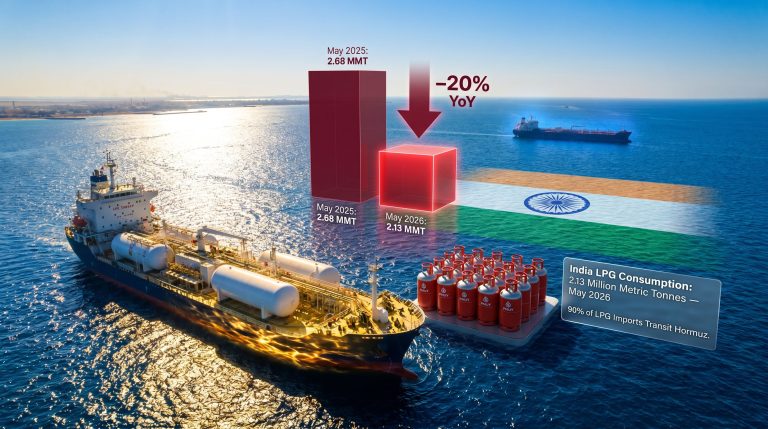
India and Southeast Asia: The Next Layer of Demand Pressure
While China and South Korea dominate the near-term demand narrative, the medium-term trajectory of the Asia LNG demand rebound and its consequences for European gas prices must also account for India and Southeast Asia.
India's LNG import infrastructure has expanded substantially in recent years, with regasification terminal capacity additions enabling it to participate more actively in spot markets. Historically, Indian buyers have been highly price-sensitive, stepping back from spot purchases during price spikes and re-entering opportunistically during softer periods. The current price environment appears to be within tolerance for renewed Indian spot participation.
Southeast Asian buyers present a similar profile: largely price-responsive, with growing domestic gas demand underpinned by industrial development and power sector expansion. Their collective re-entry into spot markets consequently compounds the competition for flexible cargoes that Europe depends upon.
Shell's long-term LNG outlook projects global demand growing by approximately 60% through to 2040, with Asian markets accounting for the dominant share of incremental volumes. This structural trajectory means the 2026 dynamic is not a temporary anomaly but an early-cycle manifestation of a competitive tension that will intensify over the coming decade.
What the Goldman Sachs Scenario Models Reveal About TTF Risk
Goldman Sachs has constructed scenario-based TTF price projections that illustrate the range of outcomes European gas markets face in the second half of 2026. These scenarios incorporate both the Asian demand recovery and an additional geopolitical risk layer involving potential disruptions to LNG supply through the Strait of Hormuz. Moreover, geopolitical trade tensions more broadly have added further uncertainty to commodity flow patterns globally.
| Scenario | TTF Q3 2026 Forecast | TTF Q4 2026 Forecast |
|---|---|---|
| Base Case (no prolonged Hormuz disruption) | €44/MWh | €40/MWh |
| Disruption Case (Hormuz constraints persist post-late June) | €65/MWh | €53/MWh |
| Actual Market Level (mid-May 2026) | ~€50.85/MWh | Not yet determined |
The current mid-May TTF level of approximately €50.85/MWh is already positioned between these two scenarios, suggesting markets are pricing in a meaningful but incomplete probability of the disruption case materialising. This is consistent with how forward markets typically handle ongoing geopolitical uncertainty: discounting the tail risk partially rather than fully.
The Strait of Hormuz carries an estimated 20% of global LNG trade, serving as the primary export route for major Middle Eastern LNG producers. Any sustained disruption to this chokepoint would constrain supply at precisely the moment Asian demand is accelerating, creating a compounding price shock scenario for European importers who lack alternative sourcing flexibility.
Goldman Sachs identifies late June 2026 as the critical analytical inflection point for assessing whether the disruption scenario translates into sustained price pressure or dissipates into the base case trajectory.
Why Europe's Structural Position Makes It Particularly Vulnerable
The asymmetry in this market structure deserves emphasis. Europe's vulnerability to the Asia LNG demand rebound is not simply a matter of supply and demand arithmetic. It reflects a structural feature of how European gas markets have been rebuilt since 2022.
Prior to the loss of the majority of Russian pipeline gas, Europe imported relatively modest volumes of LNG and maintained gas price stability primarily through long-term pipeline contracts. The rapid pivot to LNG dependence after 2022 was an emergency-driven structural shift, achieved partly by Europe offering TTF prices sufficiently elevated to attract flexible LNG cargoes away from their traditional Asian destinations.
This worked during periods of weak Asian demand. However, it becomes progressively more expensive, and eventually less reliable, as Asian demand strengthens. European importers are, in effect, competing in a spot market auction they did not design and cannot control, against buyers with growing domestic infrastructure and, in China's case, significant state-directed procurement capacity. Furthermore, commodity market volatility and oil price movements in 2025 have added further layers of complexity to the pricing environment facing European energy buyers.
Industrial and Household Cost Implications Across Europe
The consequences of sustained TTF elevation are unevenly distributed across Europe. Eurostat data confirm that household and non-household gas prices differ substantially across EU member states, reflecting divergent levels of LNG import infrastructure, residual pipeline dependency, domestic storage capacity, and national energy policy frameworks.
Energy-intensive industries face the sharpest exposure:
- Chemical manufacturing uses natural gas as both a feedstock and an energy source, making production economics highly sensitive to TTF movements.
- Steel producers operating electric arc furnaces are exposed through electricity prices, which in gas-marginal power markets track TTF closely.
- Glass and ceramics manufacturers depend on continuous high-temperature processes that cannot easily shift to alternative fuels at short notice.
- Fertiliser producers use natural gas as the primary input for nitrogen-based products, meaning TTF spikes flow directly into agricultural input costs and ultimately food prices.
For households, the impact is more diffuse but cumulative. Elevated winter gas prices erode real incomes and complicate the energy affordability policies that multiple EU governments have struggled to manage since 2021.
Strategic Levers Europe Can Pull to Reduce Exposure
Reducing structural exposure to the Asia LNG demand rebound and its transmission into European gas prices requires action across multiple timescales:
- Expanding long-term LNG supply contracts to reduce reliance on spot market volumes, which are most directly exposed to Asian demand competition.
- Accelerating renewable energy deployment to structurally reduce the volume of gas required for power generation, shrinking the demand base that TTF prices must serve.
- Building out LNG regasification capacity in markets currently constrained by import infrastructure limitations, improving supply source diversification.
- Deepening cross-border pipeline interconnection within Europe to allow lower-cost supply access points to reach price-stressed markets more efficiently.
- Implementing industrial demand response programmes that allow energy-intensive users to reduce gas consumption during price spike periods in exchange for tariff benefits.
None of these responses operate on the timescale of a single summer season. They represent medium to long-term structural investments, which is precisely why the near-term exposure to Asian demand cycles remains significant.
The next major ASX story will hit our subscribers first
Frequently Asked Questions: Asia LNG Demand and European Gas Prices
What is the JKM-TTF spread and why does it matter for European gas prices?
The JKM-TTF spread measures the price differential between Asian LNG spot markets and the European TTF benchmark. When Asian buyers are willing to pay more relative to European levels, the spread widens and flexible LNG cargoes are preferentially routed to Asia, tightening European supply and placing upward pressure on TTF. The spread's movement to $1.87/mmBtu in May 2026 from $1.59/mmBtu in April is an early-warning signal that this diversion pressure is building.
How much could TTF rise if Asian LNG demand continues to strengthen?
Goldman Sachs modelling places TTF at up to €65/MWh in Q3 2026 under a scenario combining Asian demand recovery with sustained Strait of Hormuz supply disruptions, compared to a base case of €44/MWh for the same period. Current mid-May levels near €50.85/MWh suggest markets are already partially pricing in elevated risk.
What is driving China's LNG import recovery in 2026?
China's acceleration from approximately 36 mtpa in March to 48 mtpa by May 2026 reflects a combination of summer power sector demand, strategic pre-winter storage rebuilding, and underlying gas demand growth estimated at around 5% for 2026, driven by infrastructure investment and industrial activity.
How does the Strait of Hormuz disruption scenario compound the Asian demand rebound?
The Strait of Hormuz is a critical transit route for LNG exports from major Middle Eastern producers. Supply constraints through this route would reduce global LNG availability at precisely the point when Asian demand is drawing more cargoes eastward, creating a simultaneous demand-side pull and supply-side push that would amplify TTF price pressure beyond what either factor alone would produce.
Is the 2026 Asian LNG demand rebound structural or cyclical?
The honest answer is both. The immediate rebound partially reflects normalisation from an anomalously weak 2025. However, the underlying drivers — including China's gas infrastructure investment, South Korea's utility storage behaviour, and India's expanding import capacity — are structural. Shell's projection of approximately 60% global LNG demand growth by 2040 supports the view that the competitive tension between Asian and European buyers for flexible cargoes will intensify over time, not diminish.
Disclaimer: This article contains forward-looking projections and scenario-based forecasts sourced from Goldman Sachs analysis as reported by Reuters in May 2026. These projections involve significant uncertainty and should not be interpreted as investment advice. Energy market conditions can change rapidly due to geopolitical, weather, and macroeconomic factors. Readers should conduct independent analysis before making any financial or commercial decisions based on energy price forecasts.
Want to Stay Ahead of the Next Major Resource Discovery Driven by Shifting Energy Markets?
Discovery Alert's proprietary Discovery IQ model delivers real-time alerts on significant ASX mineral discoveries — instantly translating complex market signals into actionable opportunities for both short-term traders and long-term investors. Explore how historic discoveries have generated substantial returns by visiting Discovery Alert's dedicated discoveries page, and begin your 14-day free trial today to position yourself ahead of the market.