July 9, 2026
The Commodity Cycle That Rewrote Investor Expectations
Every decade or so, a commodity cycle emerges with enough force to completely reshape the investment landscape for an entire sector. The lithium boom of FY26 was one of those rare moments. After enduring one of the most punishing multi-year price collapses in recent memory, the lithium market snapped back with extraordinary velocity, catching many investors off guard and rewarding those who held their positions through the downturn with returns that most equity categories can only dream of.
Understanding what drove this reversal, which companies benefited most, and how to think about the road ahead requires looking beyond the headlines and into the operational, geological, and structural forces that made FY26 a breakout year for the top ASX 200 lithium shares.
When big ASX news breaks, our subscribers know first
From Glut to Equilibrium: The Three-Year Arc That Set Up FY26
Between 2023 and mid-2025, the lithium market experienced a supply glut of significant proportions. A flood of new production from Australian hard-rock mines, South American brine operations, and an aggressive ramp-up of Chinese processing capacity overwhelmed demand growth that, while strong in absolute terms, failed to absorb the volume of new supply entering the market. The lithium market downturn during this period left many producers under severe financial strain.
Spodumene prices collapsed by more than 85% from their late-2022 peaks. Carbonate prices followed a similar trajectory. For ASX-listed producers, this translated into margin compression, balance sheet stress, and in several cases, suspended dividends and deferred capital expenditure.
The rebalancing that arrived at the start of FY26 was driven by several converging forces:
- A wave of mine curtailments and care-and-maintenance decisions reduced global supply meaningfully
- Chinese cathode producers began restocking at lower price points, absorbing available concentrate supply
- EV sales volumes in Europe and North America accelerated beyond earlier projections, tightening battery-grade material demand
- Several planned greenfield lithium projects were delayed or cancelled due to the preceding low-price environment
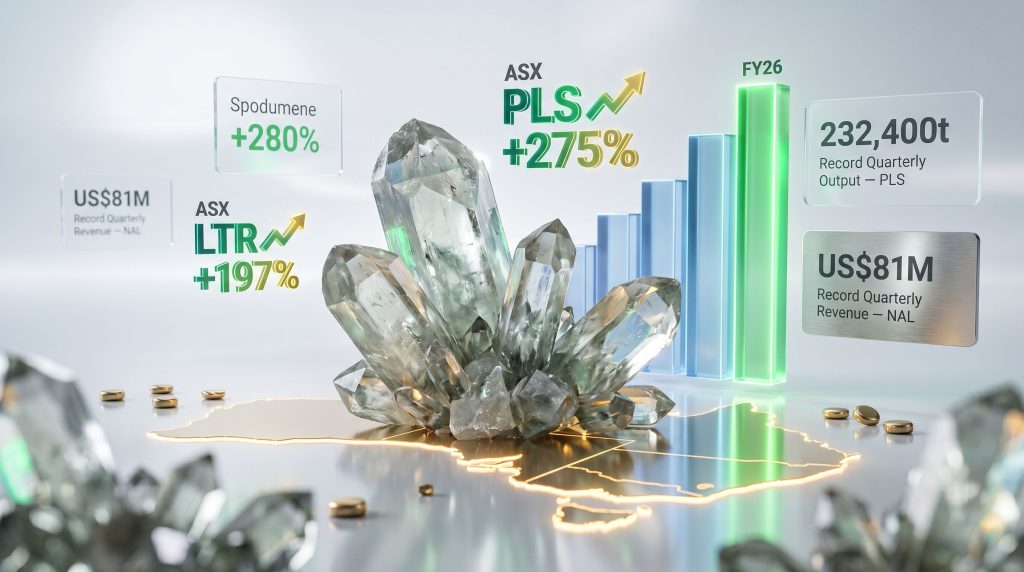
The result was a supply-demand equilibrium that the market had been anticipating but struggling to time. When it arrived, lithium became the standout commodity performer of FY26 by a significant margin, with spodumene prices surging approximately 280% and lithium carbonate climbing roughly 160% across the financial year.
What Makes an ASX 200 Lithium Share? Understanding the Index Criteria
Not every lithium company listed on the ASX qualifies for the ASX 200, and this distinction matters considerably for investors. The ASX 200 tracks the 200 largest companies by float-adjusted market capitalisation that meet minimum liquidity requirements. For a lithium producer, this typically implies a market capitalisation well above A$1 billion and sufficient daily trading volume to satisfy institutional eligibility criteria.
Pure-Play vs. Diversified Lithium Exposure
The structural composition of lithium exposure across ASX 200 constituents varies considerably:
| Category | Description | Examples |
|---|---|---|
| Pure-Play Lithium | Revenue primarily from lithium mining or processing | PLS Group, Elevra Lithium |
| Diversified with Lithium Exposure | Lithium is one of several commodity revenue streams | Mineral Resources, IGO |
| Development-Stage (Non-ASX 200) | Pre-revenue or early-stage lithium projects | Lake Resources, Galan Lithium |
Pure-play exposure amplifies earnings leverage to lithium price movements in both directions. When prices rise sharply, as they did in FY26, pure-play producers deliver outsized share price returns. However, during commodity downturns, the same operational leverage works in reverse, making diversified producers a structurally different risk proposition.
Why Do Smaller Lithium Explorers Not Qualify for the ASX 200?
Companies such as Winsome Resources, Lake Resources, and Galan Lithium operate within the lithium thematic but remain outside ASX 200 eligibility due to their pre-production status, smaller float sizes, or insufficient liquidity. For investors seeking index-grade exposure to the lithium cycle, the universe is deliberately narrow. This partly explains why the five companies profiled below attracted disproportionate institutional capital flows when sentiment turned. Investors searching for a broader list of ASX lithium companies will find a far wider range of market capitalisation tiers and development stages than the ASX 200 alone represents.
Hard-Rock vs. Brine: Why Australian Producers Favour Spodumene
A dimension of the lithium story that receives less mainstream attention is the geological distinction between the two primary lithium sources globally: hard-rock spodumene deposits and brine-hosted deposits.
Australia dominates global hard-rock lithium production. Furthermore, spodumene lithium extraction from Australian operations typically grades between 5.5% and 6% lithium oxide (Li₂O), which is the industry benchmark for processing into battery-grade chemicals. Higher-grade concentrates command pricing premiums and reduce downstream processing costs per tonne of lithium output.
Lithium brine extraction, concentrated in the South American Lithium Triangle across Argentina, Bolivia, and Chile, offers lower extraction costs in some cases but is subject to longer evaporation timelines, water rights challenges, and regional regulatory complexity. The processing pathway from brine to battery-grade lithium carbonate is also more capital-intensive at scale.
This geological advantage underpins why ASX-listed producers were direct beneficiaries of the FY26 price recovery, as the spodumene market tightened faster than brine-based supply could respond.
Top 5 ASX 200 Lithium Shares of FY26: Ranked by Capital Growth
FY26 Capital Growth Summary
| ASX Code | Company Name | FY26 Share Price Return | Closing Price (FY26) |
|---|---|---|---|
| ELV | Elevra Lithium Ltd | +327% | $9.60 |
| PLS | PLS Group Ltd | +275% | $5.02 |
| LTR | Liontown Ltd | +197% | $1.58 |
| MIN | Mineral Resources Ltd | +188% | $62.65 |
| IGO | IGO Ltd | +77% | $7.37 |
5. IGO Ltd (ASX: IGO) — +77% in FY26
IGO entered FY26 as a company in transition. Its vertically integrated lithium business model, spanning upstream mining via its stake in Greenbushes through to downstream hydroxide production at the Kwinana refinery, had faced persistent commissioning headaches that frustrated investors and suppressed the share price well below the company's fundamental asset value.
The FY26 recovery reflected a material improvement across multiple operational fronts simultaneously:
- Kwinana Lithium Hydroxide Refinery output scaled to 3,047 tonnes in Q3 FY26, up from 2,120 tonnes in Q2, representing 51% of nameplate capacity
- Greenbushes delivered a 75% EBITDA margin in Q3 FY26, one of the highest margins in the global lithium industry
- Nova nickel mine contributed $52 million in free cash flow during Q3, with production rising 11% quarter-on-quarter
- Group underlying EBITDA reached $119 million in Q3 FY26, compared to just $30 million in Q2
- Net cash strengthened to $327 million as at 31 March 2026
What Does IGO's Business Model Reveal About Vertical Integration?
IGO's operational structure provides a useful lens for understanding a key strategic debate in the lithium industry: whether to sell concentrate at the mine gate or invest in downstream processing to capture the value-add margin in lithium hydroxide or carbonate production.
Lithium hydroxide commands a premium over spodumene concentrate on a lithium-unit basis, but the conversion process is energy-intensive, technically demanding, and subject to significant commissioning risk. Kwinana's gradual ramp-up illustrated precisely how difficult downstream integration can be. Yet once operational, the margin profile at full nameplate capacity justifies the investment thesis for patient capital.
4. Mineral Resources Ltd (ASX: MIN) — +188% in FY26
Few corporate recoveries in the ASX resources sector during FY26 were as dramatic in their context as Mineral Resources. The company entered the financial year carrying significant reputational and governance damage following the disclosure of conduct by founder Chris Ellison that prompted the board to impose financial penalties totalling $8.8 million, along with a potential loss of remuneration reaching up to $9.6 million.
The board responded with a disciplined capital allocation reset:
- Dividend payments were suspended to accelerate balance sheet repair
- Management focus shifted to operational performance and debt reduction
- Strategic assets, including the Onslow iron ore project, were prioritised for ramp-up
The market's response was initially punitive, but FY26 delivered a remarkable re-rating as the results spoke for themselves. Mineral Resources reported:
- Record half-year revenue of $3.1 billion in 1H FY26
- EBITDA of $1.2 billion in the same period
The Mineral Resources case study demonstrates a pattern that experienced value investors recognise: governance-related share price dislocations sometimes create entry points that are entirely disconnected from the underlying asset quality. When the operational performance eventually reasserts itself, the share price recovery can be exceptionally rapid.
The dual contribution of rising lithium commodity prices and the Onslow project ramp-up created a powerful earnings compounding effect that the market had not fully priced into the stock at the start of FY26.
3. Liontown Ltd (ASX: LTR) — +197% in FY26
Liontown's trajectory in FY26 was fundamentally a story about operational execution during a commodity price recovery. The Kathleen Valley Project, located in Western Australia's goldfields region, only commenced production in early FY25, making FY26 its first full ramp-up year. The timing proved fortuitous. Analysing Liontown stock performance over this period reveals just how meaningful early production milestones were to investor sentiment.
Key milestones achieved during FY26 include:
- Underground production volumes grew 70% in 1H FY26 relative to the prior corresponding period
- Revenue doubled year-on-year to $207.5 million in 1H FY26
- Cash flow positive status was achieved in Q3 FY26, a critical de-risking event for the company
- The operation reached its 1.5 million tonnes per annum (Mtpa) annualised underground run-rate ahead of the original schedule
Why Does Early Run-Rate Achievement at Kathleen Valley Matter?
Reaching a targeted production run-rate ahead of schedule carries outsized significance for a mining investment. It signals that the underground ore body is performing to geological model, that the processing plant is operating within design parameters, and that management's operational execution capability is credible. Each of these outcomes reduces the risk premium the market attaches to the stock, which contributes to share price re-rating independent of commodity price movements.
For Kathleen Valley specifically, the geology is worth noting. The deposit hosts high-grade spodumene mineralisation within a large pegmatite system, with ore grades that support competitive processing recoveries. High lithium recovery rates at the processing plant directly translate into lower unit costs per tonne of spodumene concentrate produced, which is a key metric on the global cost curve.
2. PLS Group Ltd (ASX: PLS) — +275% in FY26
PLS Group, formerly known as Pilbara Minerals prior to its corporate rebrand, occupies a singular position in the global lithium industry. Its Pilgangoora Operation is the world's largest independent hard-rock lithium mine by production capacity, and the company holds the distinction of being the largest pure-play lithium producer by market capitalisation on the top ASX 200 lithium shares list.
FY26 was the year when the Pilgangoora asset demonstrated its full earnings leverage to a recovering lithium price environment:
- Record quarterly production of 232,400 tonnes was achieved in Q3 FY26, the highest output in the company's history
- Unit operating costs declined 11% over the same quarter
- The average realised spodumene price increased approximately 61% quarter-on-quarter
The combination of record volume, declining unit costs, and rising realised prices in a single quarter represents what operators refer to as an earnings leverage trifecta. When all three variables move simultaneously in a producer's favour, the amplification effect on earnings and cash flow can be exponential rather than additive.
Management attributed the production record to improved plant reliability, extended operational run times, and consistently high lithium recovery rates throughout the processing circuit. These are not accidental outcomes. They reflect sustained investment in maintenance, process optimisation, and workforce capability that is often invisible to investors during a down-cycle but becomes extremely visible when prices recover.
One less commonly discussed aspect of Pilgangoora's competitive advantage is the scale of its resource base. The operation's mineral resource inventory provides decades of mine life at current production rates, which removes the reserve depletion risk that constrains many mid-tier producers. This longevity supports long-term offtake agreements and financing structures that lower the company's cost of capital relative to peers with shorter mine lives.
1. Elevra Lithium Ltd (ASX: ELV) — +327% in FY26
The top-performing stock among the top ASX 200 lithium shares in FY26 was a company that many Australian investors were still familiarising themselves with at the start of the financial year. The Elevra lithium merger of Piedmont Lithium and Sayona Mining created a geographically diversified lithium producer with operating assets across Québec, North Carolina, Ghana, and Western Australia.
The flagship North American Lithium (NAL) operation in Québec was the primary earnings driver:
- NAL generated record quarterly revenue of US$81 million in Q3 FY26, a 22% increase on Q2 FY26
- Year-to-date revenue reached US$167 million, representing 68% growth on the prior corresponding period
- An accelerated expansion programme is underway to bring additional production capacity online ahead of the original schedule
Why Does Geographic Diversification Carry Strategic Value?
Elevra's multi-jurisdiction portfolio is a structural characteristic that institutional investors weigh carefully when assessing concentrated commodity producers. A single-asset lithium company carries binary operational risk: any disruption at the mine or processing facility translates directly into earnings loss with no offsetting production elsewhere.
Elevra's spread across North America and West Africa also provides optionality in terms of which markets its product reaches. North American lithium production carries an inherent advantage in terms of proximity to battery manufacturing facilities being established across the United States and Canada, particularly as regional supply chain development accelerates.
The North Carolina project, which remains in development, represents a potential future growth vector that the market has begun to attribute value to as the Québec flagship demonstrates its operational credibility.
A Comparative View: What Separated the Top Performers
| Company | Key Asset | Notable Q3 FY26 Metric | Structural Differentiator |
|---|---|---|---|
| ELV | North American Lithium (NAL) | US$81M record quarterly revenue | Geographic diversification across four jurisdictions |
| PLS | Pilgangoora Operation | 232,400t record quarterly output | Largest independent hard-rock mine globally |
| LTR | Kathleen Valley | Cash flow positive, run-rate achieved early | High-grade pegmatite, strong recovery rates |
| MIN | Wodgina + Mt Marion + Onslow | $3.1B record half-year revenue | Diversified commodity base, governance reset |
| IGO | Greenbushes + Kwinana | $119M group EBITDA in Q3 FY26 | Vertically integrated from mine to hydroxide |
The next major ASX story will hit our subscribers first
Key Risks Facing ASX 200 Lithium Shares Going Forward
Lithium Price Volatility and Cyclical Risk
The FY26 price recovery does not eliminate the fundamental cyclicality of the lithium market. Commodity prices respond to supply and demand imbalances, and the history of lithium demonstrates that periods of price strength attract new investment that eventually overshoots demand growth. Investors should consequently treat FY26 returns as a product of an unusual cyclical alignment rather than a new structural baseline.
Corporate Governance Considerations
The Mineral Resources experience in FY25 provides a timely reminder that governance risk can compress valuations significantly and rapidly. ASX-listed mining companies with concentrated executive power structures or limited independent board oversight carry a risk premium that is sometimes difficult to quantify until an adverse event materialises.
Expansion Execution Risk
Several companies in the top-five ranking are pursuing accelerated production expansions. The history of lithium project development suggests that commissioning timelines are consistently underestimated. Processing plant performance, underground mine development rates, and equipment availability all introduce execution variability that can delay expected cash flow generation.
Geopolitical and Supply Chain Exposure
As battery supply chains increasingly regionalise in response to geopolitical tensions between major economies, ASX producers with North American or European project exposure may benefit from proximity premiums. However, producers reliant on Chinese offtake remain exposed to policy shifts and demand volatility from their largest customer base.
How to Evaluate ASX 200 Lithium Shares: A Five-Step Framework
Assessing lithium producer quality requires a structured approach that goes beyond share price momentum. For instance, investors tracking lithium commodity prices should pair that data with the following fundamental assessment criteria:
- Assess Production Stage: Is the company generating revenue, ramping up, or still in development? Production-stage companies carry fundamentally different risk profiles to exploration-stage peers.
- Analyse Cost Position: Where does the operation sit on the global lithium cost curve? Lower-cost producers survive downturns and generate outsized returns in upturns.
- Evaluate Balance Sheet Strength: Net debt relative to EBITDA determines how much operational flexibility the company retains during commodity price weakness.
- Examine Commodity Price Sensitivity: Higher earnings leverage to spodumene prices amplifies both upside and downside. Model multiple price scenarios before sizing a position.
- Review Governance and Management Quality: Capital allocation decisions, executive remuneration structures, and board independence are leading indicators of long-term shareholder value creation.
Market Capitalisation as a Proxy for Institutional Confidence
| Company | Market Cap (A$) | Index Tier |
|---|---|---|
| PLS Group Ltd | ~A$19.36 billion | ASX 200 |
| Mineral Resources Ltd | ~A$12.70 billion | ASX 200 |
| Liontown Ltd | ~A$7.47 billion | ASX 200 |
| IGO Ltd | ~A$6.43 billion | ASX 200 |
| Elevra Lithium Ltd | ~A$1.85 billion | ASX 200 |
Frequently Asked Questions: ASX 200 Lithium Shares
What Is the Largest ASX 200 Lithium Share by Market Capitalisation?
PLS Group Ltd (ASX: PLS) is currently the largest pure-play lithium producer in the ASX 200, with a market capitalisation of approximately A$19.36 billion. Its Pilgangoora Operation is the world's largest independent hard-rock lithium mine by production capacity.
Which ASX 200 Lithium Share Delivered the Highest Return in FY26?
Elevra Lithium Ltd (ASX: ELV) delivered the strongest capital return of the group at approximately 327% across FY26, driven by record revenue from its North American Lithium flagship operation.
Why Did Lithium Shares Perform So Strongly in FY26?
The primary driver was the rebalancing of global lithium supply and demand after a prolonged oversupply period spanning 2023 to 2025. Spodumene prices rose approximately 280% and carbonate prices climbed around 160% across FY26, directly boosting producer revenues, margins, and cash flow generation.
What Is the Difference Between Lithium Spodumene and Lithium Hydroxide?
Spodumene is a hard-rock lithium mineral concentrate, typically grading at 5.5% to 6% Li₂O, that is produced at the mine and sold to chemical processors. Lithium hydroxide is a refined downstream product used directly in high-energy-density battery cathode manufacturing, particularly for nickel-rich chemistries. IGO's Kwinana facility converts spodumene into lithium hydroxide, capturing the value-add margin but also absorbing the associated processing complexity and cost.
Are There ASX Lithium Companies Outside the ASX 200?
Yes. Companies including Lake Resources, Winsome Resources, and Galan Lithium operate within the lithium investment thematic but do not currently meet the market capitalisation or liquidity thresholds required for ASX 200 inclusion.
Is Investing in ASX 200 Lithium Shares Suitable for All Investors?
Lithium equities carry elevated commodity price risk, operational execution risk, and cyclical volatility. Individual risk tolerance, investment time horizon, and portfolio diversification should all be considered before allocating capital to lithium-exposed shares. The information in this article is general in nature and does not constitute personal financial advice.
The Outlook Beyond FY26: Structural Tailwinds and Key Uncertainties
Global EV Adoption and Battery Demand Growth
Global electric vehicle penetration continues to rise, with battery demand forecasts pointing to sustained growth in lithium consumption through the 2030s. The critical question for investors is not whether demand will grow, but whether new supply coming online will match or exceed that demand growth, determining whether the FY26 pricing environment represents a new normal or a cyclical peak.
Capacity Expansion Pipelines
Several ASX 200 lithium producers are investing for growth beyond their current operational footprints. PLS Group's Pilgangoora expansion stages, Elevra's NAL acceleration, and Liontown's Kathleen Valley optimisation all represent production growth vectors. Whether these expansions deliver on schedule and within budget will be a key performance differentiator over the next two to three years.
The China Factor
China remains the dominant buyer of Australian spodumene concentrate and the largest processor of lithium chemicals globally. Chinese refining capacity significantly exceeds current global lithium production, giving Chinese processors substantial negotiating leverage in offtake pricing discussions. Any material shift in Chinese domestic EV policy, battery chemistry preferences toward lithium iron phosphate rather than nickel-rich cathodes, or strategic stockpiling behaviour can move global lithium prices independently of physical supply and demand fundamentals.
The AI Infrastructure Connection
A less discussed but growing demand driver for grid-scale battery storage is the energy intensity of artificial intelligence infrastructure. Large-scale data centres require reliable baseload power and increasingly use battery storage systems to manage grid instability and peak demand. While this remains a secondary driver relative to EV demand, it introduces an additional long-term demand variable that may support lithium consumption over a broader timeframe than transport electrification alone would suggest.
This article contains general information only and does not constitute personal financial advice. All investment decisions should be made in consultation with a licensed financial adviser. Past share price performance is not indicative of future returns. Market capitalisation figures and share prices referenced are based on FY26 data as reported.
Want to Capitalise on the Next Major ASX Commodity Cycle Before the Market Moves?
Discovery Alert's proprietary Discovery IQ model delivers real-time alerts on significant ASX mineral discoveries, transforming complex geological and market data into actionable investment insights the moment they are announced — giving subscribers a critical edge in fast-moving commodity cycles like the lithium surge seen in FY26. Explore how major discoveries have historically generated extraordinary returns on Discovery Alert's dedicated discoveries page, and begin your 14-day free trial today to position yourself ahead of the next breakout opportunity.